
Running a home lab in 2025 is one of the most exciting and fun things you can build. It also develops skills that others simply don’t build without one. Networking is one of the core technologies that underpins the home lab environment as it does in any production environment. There are several Linux networking commands that every home lab admin should know in 2025 to help troubleshoot, measure performance, and validate connectivity, etc. Let’s take a look at 10 of these tools that are super helpful that you can include in your toolkit.
nstat
The nstat command line tool is part of the iproute2 suite of tools. It gives you access to the kernel level network statistics. This makes it super helpful when you need to understand what is happening on your system from a packet perspective. This is a really helpful tool to use to understand what is happening with network packets.
You can use it to look at dropped packets, TCP resets, ICMP errors, and other types of network statistics. If you are seeing strange performance or network issues, this command can give visibility to those types of issues and errors.
You can run it with:
nstat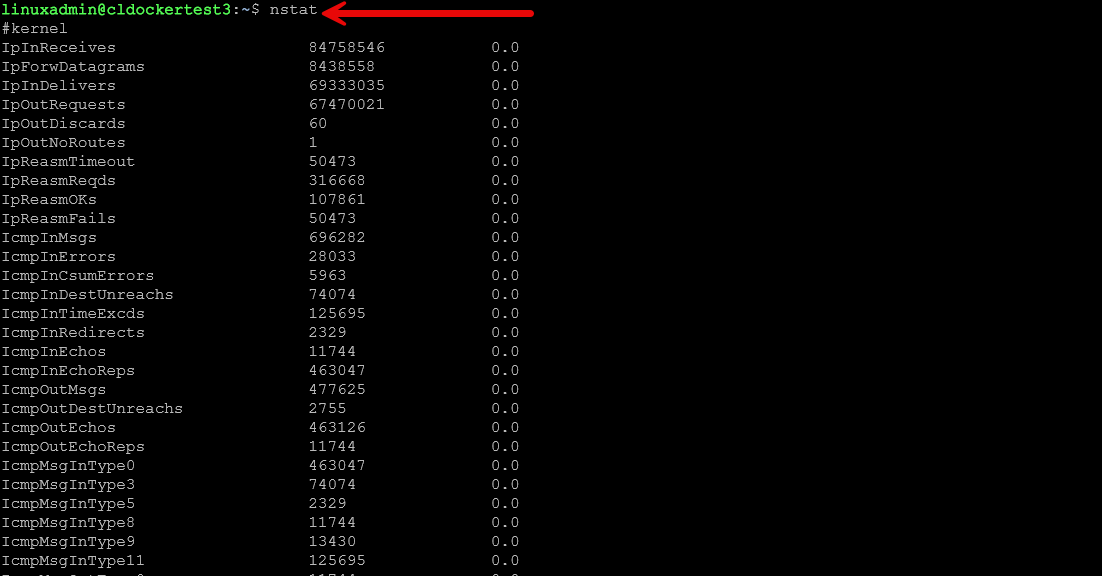
If you want to see continuous updates from the tool, run the command with these parameters:
nstat -az 1Running nstat is helpful when testing new interfaces, or working with virtual bridges in Proxmox. It can help verify a new firewall rule is not causing unexpected drops. You can also use it to help with weird issues with Docker networks, etc.
ss
You have probably used netstat quite a few times in the past. However, the ss command is the modern alternative to netstat and is much faster. On top of that, it is more accurate and gives you flexibility. You can see active connections, listening ports, sockets, TCP states, and more information.
If you want to see all listening ports:
ss -tulnpIf you need to see real time connection information:
watch ss -sTo filter by port:
ss -tuln | grep 443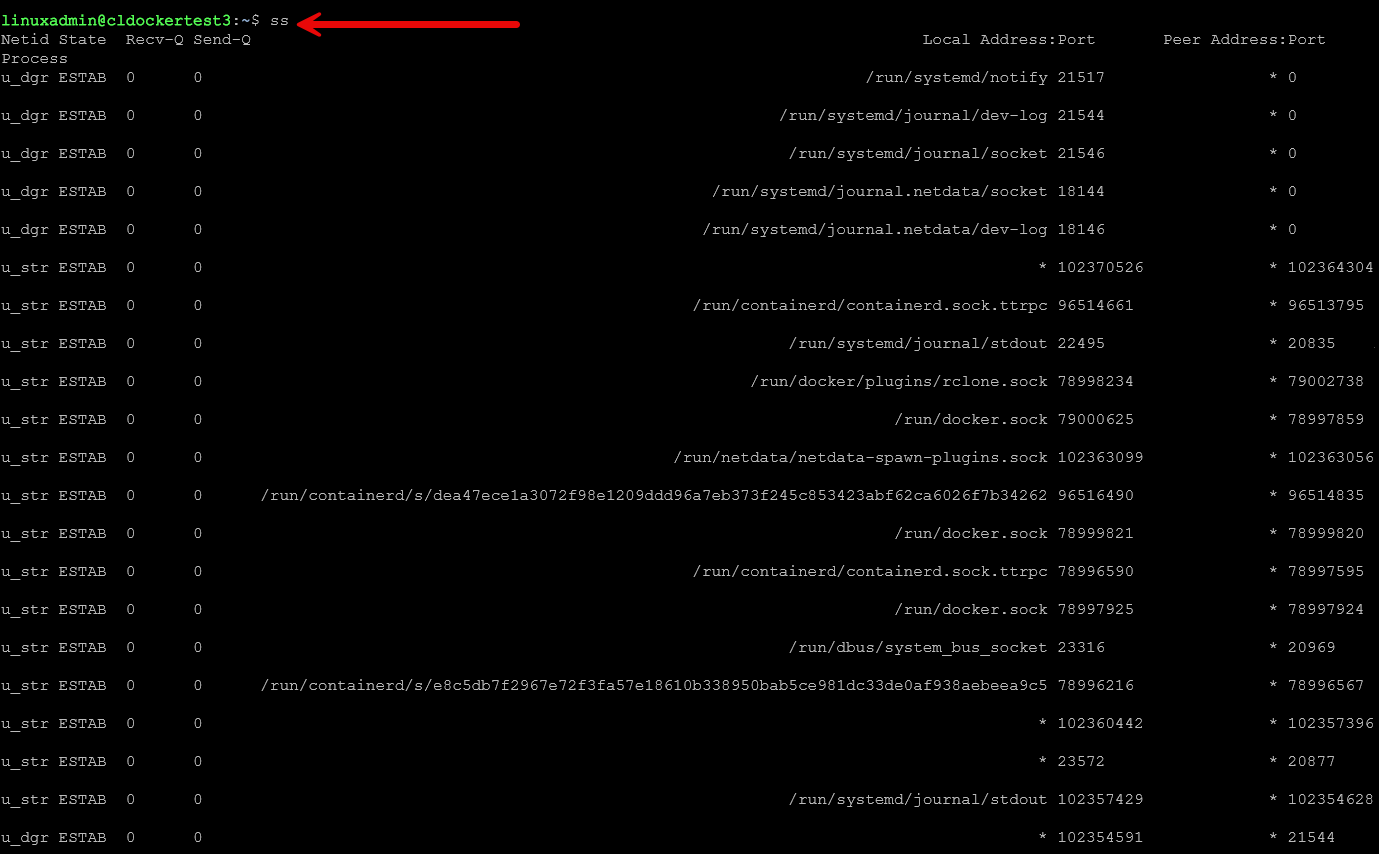
The ss command is helpful when using reverse proxies. Things like Traefik or Nginx Proxy Manager. It helps you to check which services are bound to which interfaces. You can also use it to validate VPN ports, or troubleshoot containers listening where you expect them to be listening.
ethtool
If you use multi gig networking in your home lab, or you run hardware like Minisforum MS series systems, Intel NUCs, Supermicro boards, or MikroTik switches, ethtool is your friend. It gives you detailed information about your NICs, including supported speeds, offloading capabilities, link status, and driver information.
Check link speed and duplex:
ethtool eth0Disable offloading features if something is misbehaving:
sudo ethtool -K eth0 gro off tso off gso off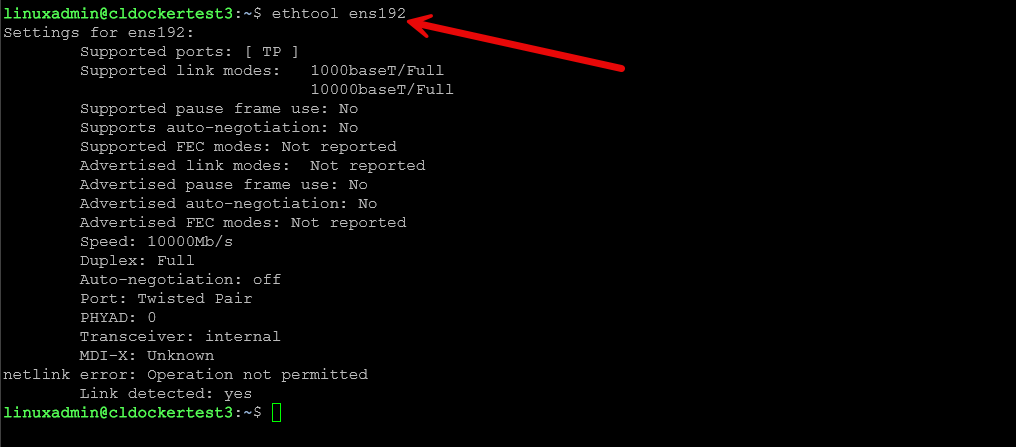
This can fix issues with pfSense, OPNsense, Proxmox bridges, or Ceph networks where offloading features sometimes introduce latency or break certain traffic flows.
You can also force speed autonegotiation or troubleshoot cable quality problems, which is useful when running high speed 2.5, 5, or 10 GbE links in your lab.
ip addr, ip link, ip neigh
There are definitely times in the lab environment where you need basic commands to view your IP addresses, your link speed and if you see any neighbors on the network. The old ifconfig tools and route commands are still valid, but are legacy. Most of the modern Linux distros at this point use the ip command. There are three variations of this command to know and use in your information gathering and troubleshooting.
View IP addresses
This is probably the most basic, finding IP addresses. The ip addr command allows you to see the layer 3 properties of the connections.
ip addr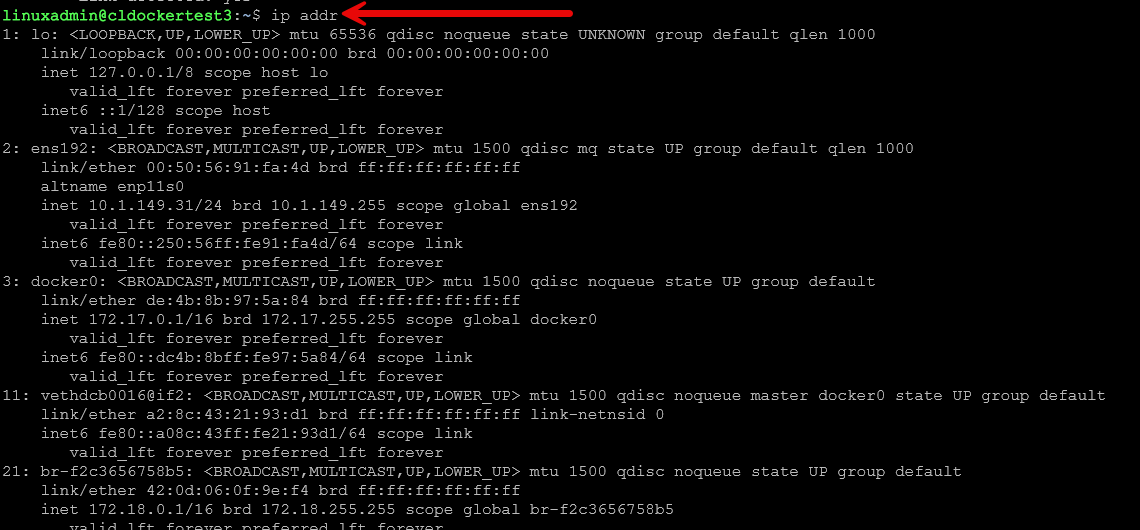
View network interfaces and states
What if you need to see the layer 2 properties of your connection? That is where the ip link command comes in. With it, you can see things like:
- Interface state (UP or DOWN)
- MAC address
- MTU
- Interface type (Ethernet, bridge, VLAN, bond, veth, tap, etc.)
- Promiscuous mode
- TX/RX queue lengths
- Hardware level stats
- Link settings for virtual or physical NICs
ip link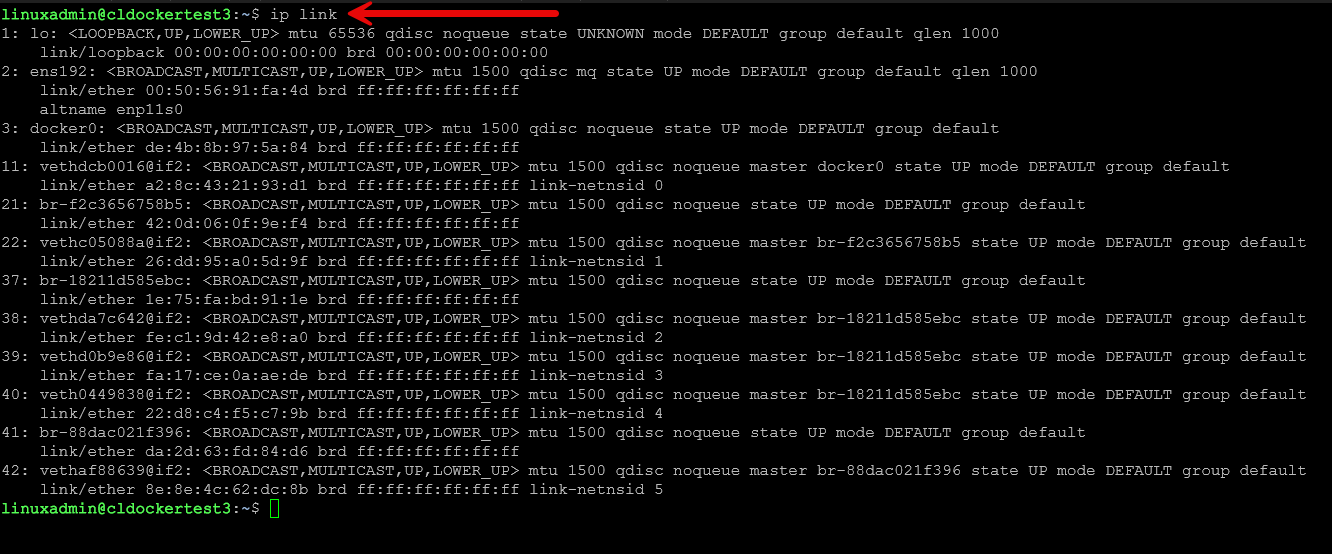
Inspect ARP and neighbor tables
The ip neigh command is a really good one to see your neighbors found by ARP requests. This helps track down ARP issues, gateway problems, or machines that are inconsistent or flaky in how they respond.
ip neigh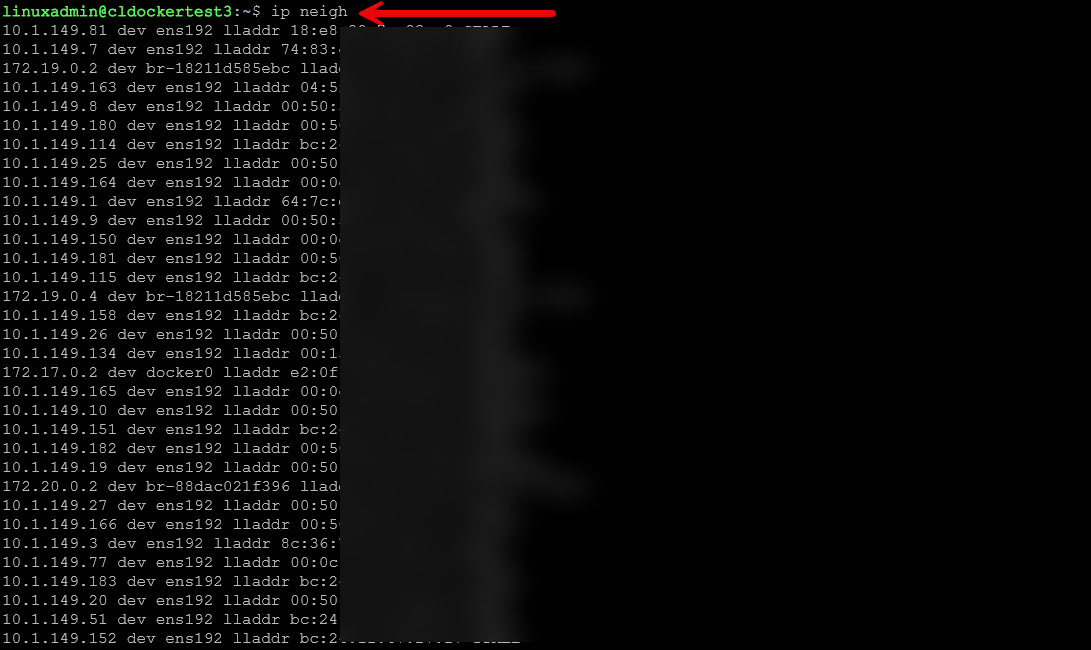
mtr
The mtr (my traceroute) command is like a combination of ping and traceroute into a single command. But, instead of the legacy traceroute that was “one and done” the mtr command updates continously and gives you percentage of packets lost, and latency as these changes happen.
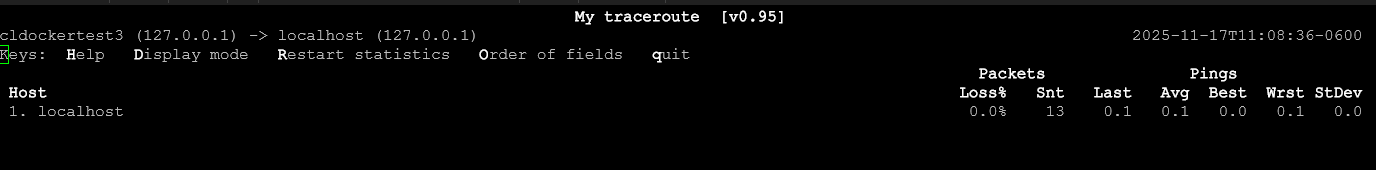
Run it with:
mtr google.com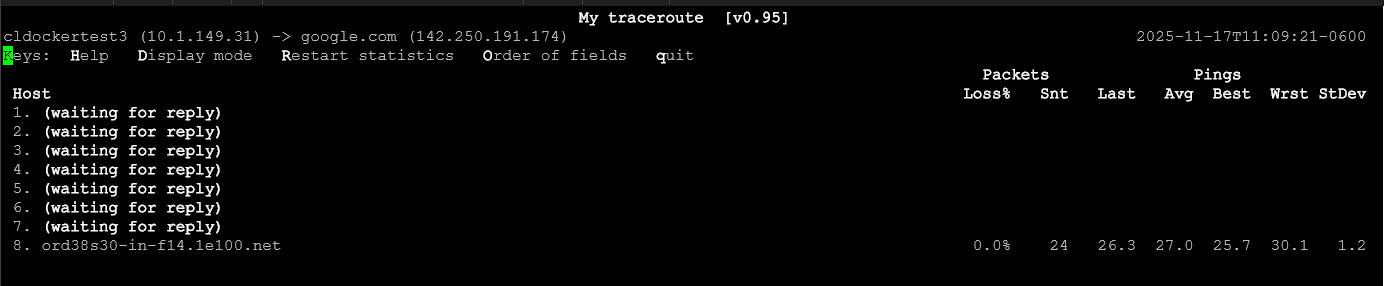
For report output:
mtr -rw google.comIf you need to troubleshoot and test Internet performance or check things like VPN tunnel latency, routing, or traffic shaping and QoS, this is a great tool to add to the toolbelt.
traceroute
Even though mtr is a more advanced tool, traceroute still has value. Some environments may block ICMP or not respond to things like UDP based traces. So you can use it as a backup means to get routing information and statistics.
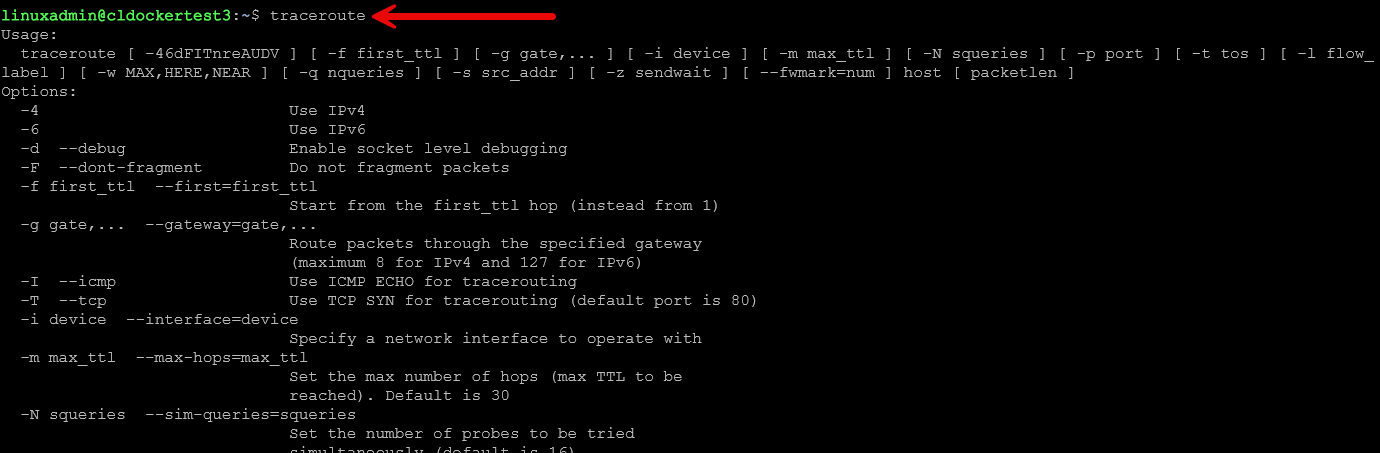
Basic usage:
traceroute 8.8.8.8You can use this to diagnose routing loops, asymmetric paths, or other types of hops and information. It helps to make your routing path visible.
dig
In terms of a well-known tool to troubleshoot and look at DNS name resolution, the dig command is one to note. When you have reverse proxies, and SSL terminal going on in the home lab, it is easy for name resolution to become an issue.
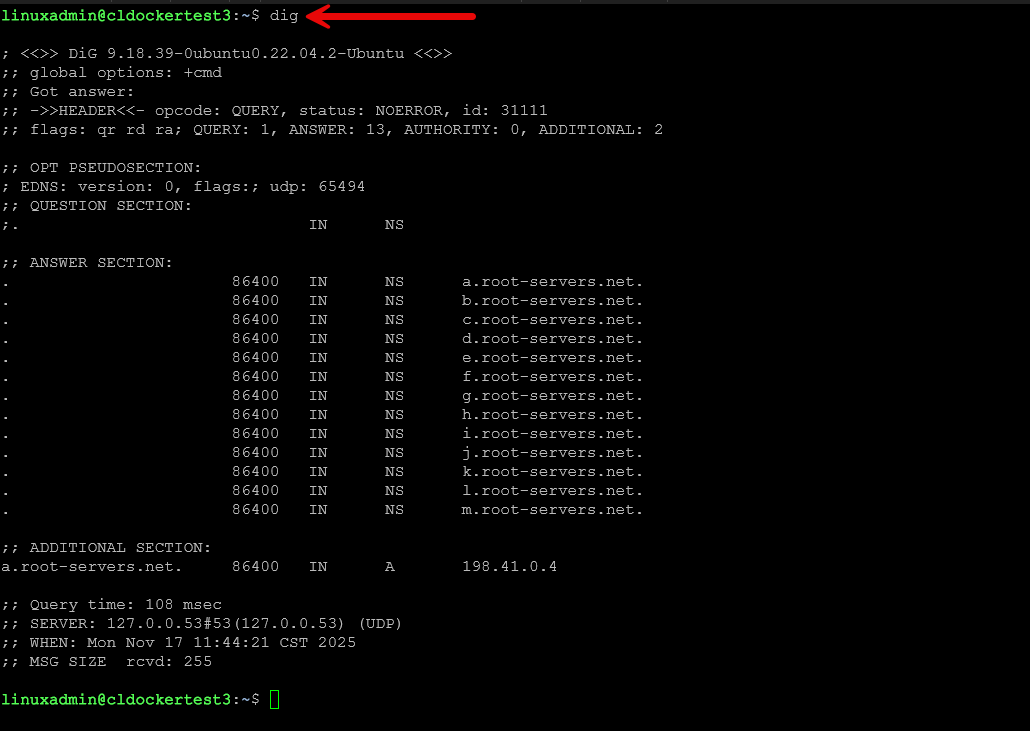
dig is the one of the best ways to diagnose DNS without caching involved or a specific host configuration in play.
Lookup a record:
dig example.comDisplay only the answer:
dig +short example.comCheck which DNS server responded:
dig example.com @1.1.1.1Query internal services:
dig pve1.home.localnc (netcat)
The nc tool is one of the best little port scanners that you can use from the command line. It can also act as a file transfer utility, debugging tool, or even as a quick test server, which is functionality that I only recently discovered.
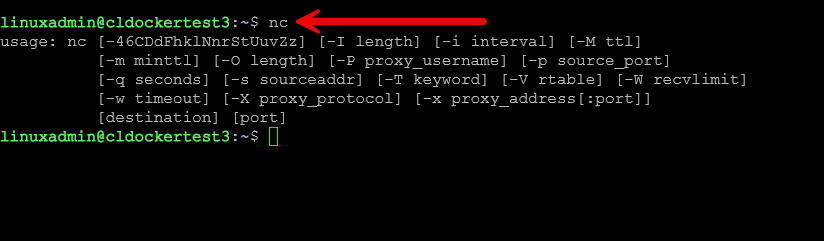
Check whether a port is open:
nc -zv 192.168.1.10 443Spin up a quick listener (server, pretty cool!)
nc -lvnp 9000Send file content across systems (did you know you could do this?)
cat file.txt | nc 192.168.1.20 3000Test TCP connections inside containers:
nc -zv mycontainer 5432The nc tool is like a jack of all trades type tool that can function as a tester, server, and file transfer utility. I really like this as it not only tests the ports, but it allows you to then take that further and actually test at the application level.
tcpdump
The tcpdump tool is a great tool that you can use if you are troubleshooting serious network issues. It allows you to see at a low level what is being transmitted on the network. You can also use very granular filters with the tool to filter down to only specific types of traffic.
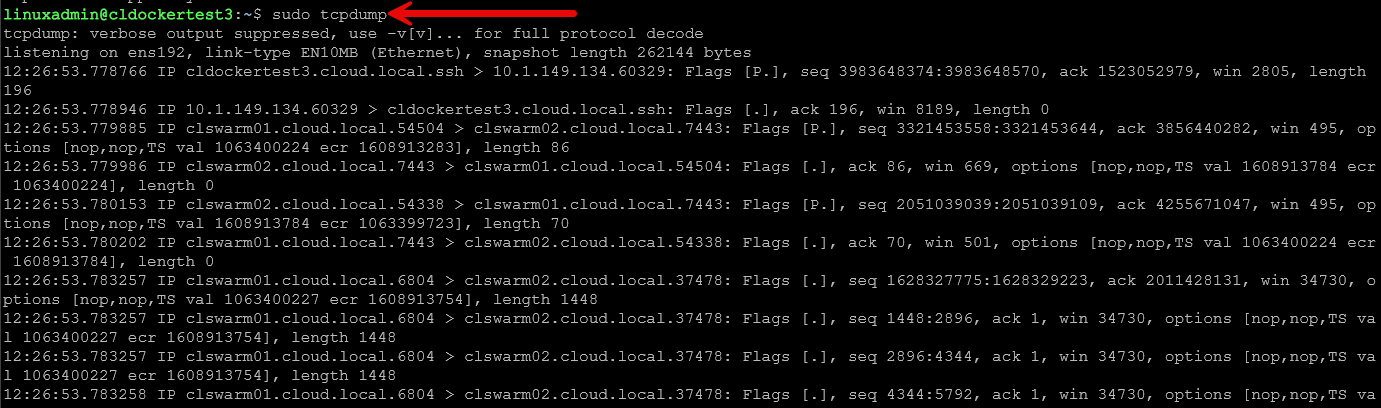
Capture traffic on an interface:
sudo tcpdump -i eth0Filter by port:
sudo tcpdump -i eth0 port 443Filter by host:
sudo tcpdump -i eth0 host 192.168.1.50Write to a pcap file for Wireshark:
sudo tcpdump -i eth0 -w capture.pcapThis is an essential tool if you need to debug network traffic for VLANs, ARP problems, DHCP issues, Kubernetes overlay networks, container traffic, or finding the source of broadcast storms.
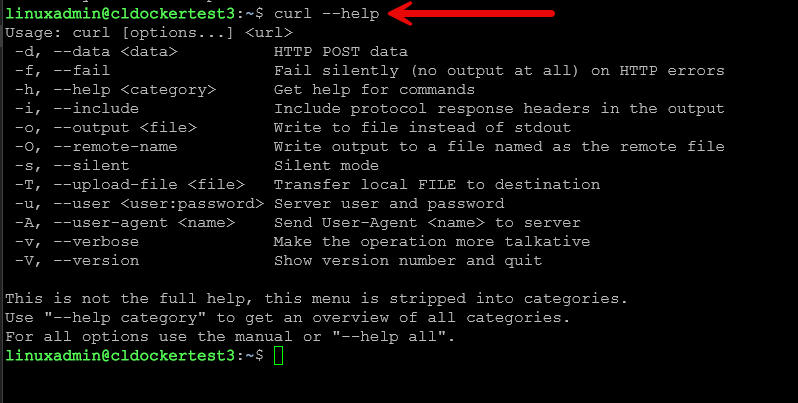
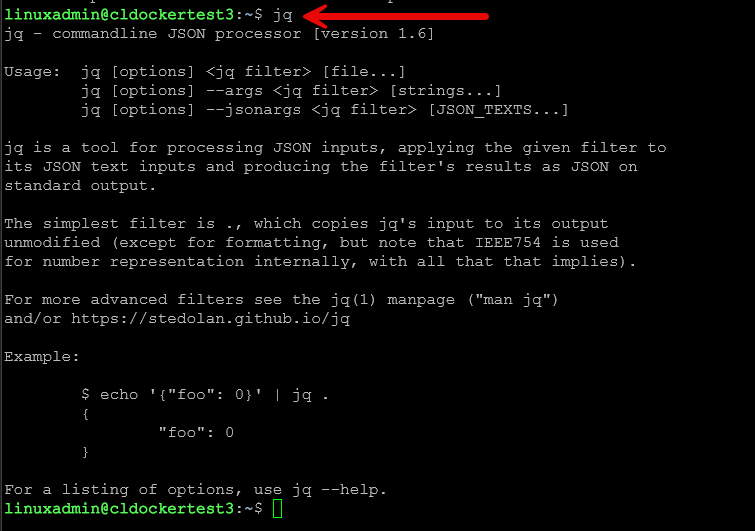
curl + jq
You have probably seen or used the curl command before. It is one of the defacto standards when you need to test out APIs from the command line or download files even. When you combine this with the jq command, you can interact with APIs and other resources very easily. The jq command is a JSON processor that takes a messy JSON output and formats it into something you can actually read.
Get JSON output:
curl -s https://api.example.com/data | jqExtract a specific field:
curl -s https://api.example.com/data | jq '.results[0].status'Authenticate against an API:
curl -H "Authorization: Bearer $TOKEN" https://api.example.comYou can use curl to verify webhook endpoints or check the output of automation tools. You can even test whether containers are serving the right response.
Bonus
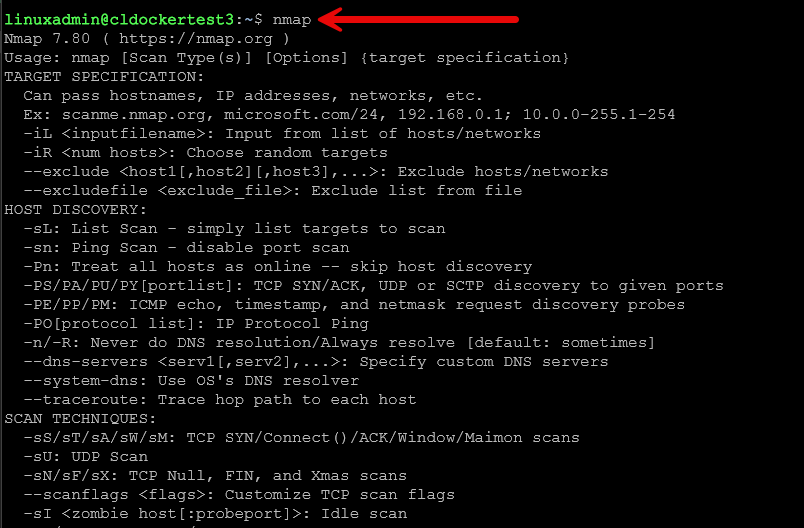
If you want an eleventh command as a bonus, nmap is one of the easiest and coolest discovery tools available for network scanning. It can show open ports, running services, fingerprint the OS, and give you network layouts.
Scan a host:
nmap 192.168.1.10Scan an entire subnet:
nmap 192.168.1.0/24Check for vulnerable SSL configurations:
nmap --script ssl-enum-ciphers -p 443 yourserverWrapping up
These Linux networking commands give you a serious set of tools that you can use to troubleshoot or get information on just about every aspect of your network from the Linux command line. When you need to troubleshoot an issue or run a quick test, there is arguably not a much faster way than from the command line. These commands we have covered help you shed light on misconfigurations, look at performance, test connectivity, and diagnose issues. How about you? What does your list of Linux networking command include?
Google is updating how articles are shown. Don’t miss our leading home lab and tech content, written by humans, by setting Virtualization Howto as a preferred source.
About The Author

I love these lists, gives me ideas or just reminds me of commands that I have forgotten about.
Hi,
I found nmtui quite handy too when you are not a Linux guru like I am!
This helped me reconfigure NICs/LAG whenever the server lost the config.
Franck,
That is a great shout out on nmtui for sure….great tool to have the TUI interface for network configs. I have definitely used it myself as well.
Brandon