If you are like me, I have always been interested in networking and the technologies that allow us to get packets from point A to point B. In the home lab, the underlying network that underpins your self-hosted services is extremely important. So, you definitely want to have visibility on it. If you want a tool that allows you to see what is going on in your home lab network ntopng is one of those tools that will completely change how you see the network. Let’s take a look at ntopng home lab network monitoring and why you need it.
Are you flying blind?
Most if they are honest would say yes when it comes to knowing or having good monitoring on their networking in the home lab. I have seen this to be a pain point and weak spot even in many production environments. Many don’t have the tools implemented to have the visibility they need. I can guarantee you as I have experienced this, you will eventually encounter an issue where you need to get out something like wireshark to have visibility if you don’t have another tool.
You may be troubleshooting a latency issue, analyzing bandwidth usage, or you may just be curious about which devices are chatting the most on your network. You can’t see these types of things with just normal monitoring of your home lab (your hosts, your storage, etc, etc).
What is ntopng
It is surprising to me that ntopng is not a tool that more have heard about. I was surprised that I hadn’t heard about it either until just a while ago. It is a network monitoring tool that gives you a visual and an interface to really understand the network traffic happening in your network, whether home lab or a production network. I like to think of it as a mix between Wireshark and a lightweight network analytics dashboard rolled into one.
What makes it great for home labs is that you can run it anywhere, from a Raspberry Pi to a full-blown server or even in a Docker container (which we will show below). And with the Community Edition, you can get a powerful set of features for free.
This aspect of ntopng really blew me away when I saw just how much visibility it gives you into network traffic flows, without having to run a full wireshark capture. It actually does packet capture (using libpcap or PF_RING) and flow data (sFlow, NetFlow, or IPFIX) to know which clients and servers are talking to who. Also, it answers the question of how much data is flowing, and what apps or protocols are being used. You can view things as a live view or view historical data.
Take a look at the following table showing what you can do with ntopng:
| What You Can Do with ntopng | Description |
|---|---|
| Monitor all traffic on your LAN or VLANs | You can see packets moving across your network in real time, including internal VLANs and trunked interfaces. |
| View bandwidth usage by host or by protocol/application | See which devices and protocols use the most bandwidth |
| See new hosts and network anomalies | Learn when a new device joins your network or when unusual traffic happens |
| Track active flows and network “conversations” | Drill into which devices are talking on the network, the amount of data transferred, and the protocols used |
| Know what traffic is classified as at Layer-7 | You can identify applications such as HTTPS, DNS, SSH, or streaming services based on deep packet inspection |
| Integrate with tools like nProbe for flow collection | It collects and analyzes NetFlow, sFlow, or IPFIX data for enterprise-level visibility |
It means you can keep an eye on everything network wise. This includes your Proxmox cluster, Docker hosts, and smart devices to your NAS and security cameras. Also, the part that I really like too is seeing things that maybe you don’t know are on your network. This is the maybe more interesting aspect of seeing network traffic at this level.
You can view the official GitHub repo here: ntop/ntopng: Web-based Traffic and Security Network Traffic Monitoring.
OK, so how do we get up and running with ntopng? Let’s see.
Installing ntopng
You can install ntopng home lab network monitoring in several ways depending on your setup. The easiest and most flexible option for most home labs is Docker. The official ntopng image works well and can be deployed in just a few commands.
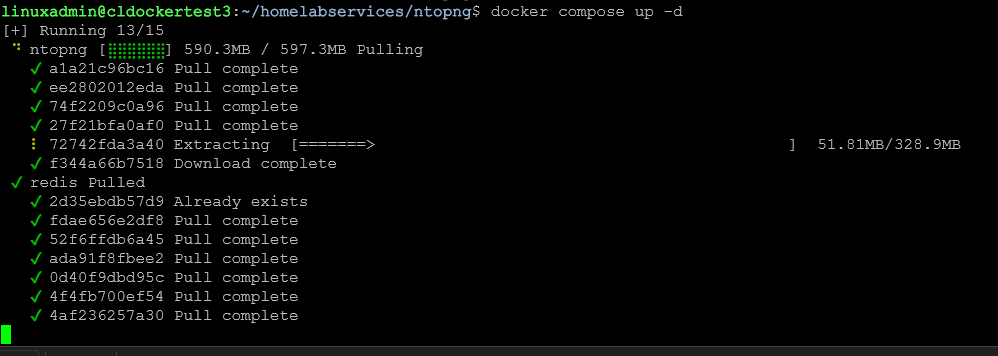
The ntopng stack below is made up of ntopng and redis containers. I left the bind mount I used in this example so you can see how that looks. Also, you will notice we are using the host network mode for the configuration. We want ntopng to be able to “see” the traffic the host sees and not just inside the Docker network. So, configuring it this way is what you want to get started. Save the below as docker-compose.yml after customizing.
services:
redis:
image: redis:alpine
container_name: ntopng-redis
restart: unless-stopped
volumes:
- /home/linuxadmin/homelabservices/ntopng/redis:/data
command: redis-server --save 60 1
network_mode: host
ntopng:
image: ntop/ntopng:latest
container_name: ntopng
restart: unless-stopped
network_mode: host
cap_add:
- NET_ADMIN
- NET_RAW
environment:
- TZ=America/Chicago
volumes:
- /home/linuxadmin/homelabservices/ntopng/data:/var/lib/ntopng
command: >
--community
--http-port 3000
--redis 127.0.0.1:6379
--interface ens192
--disable-login 0
depends_on:
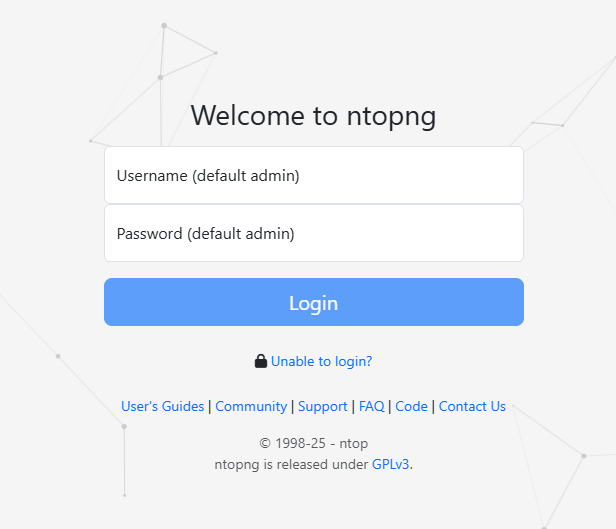
- redisOnce the containers come up and are healthy, which you can find with docker compose ps in the directory where you have your docker compose file. You will get to the login screen where you can login with the default admin/admin username and password.
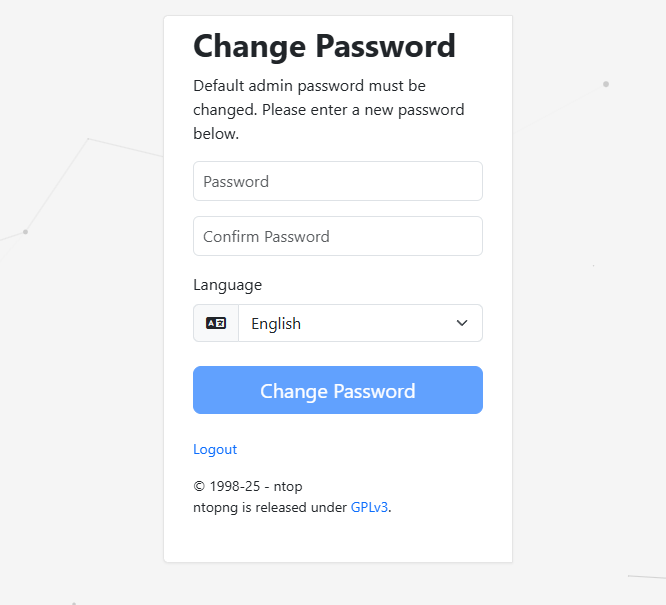
It will then prompt you to change your password.
Exploring the ntopng dashboard
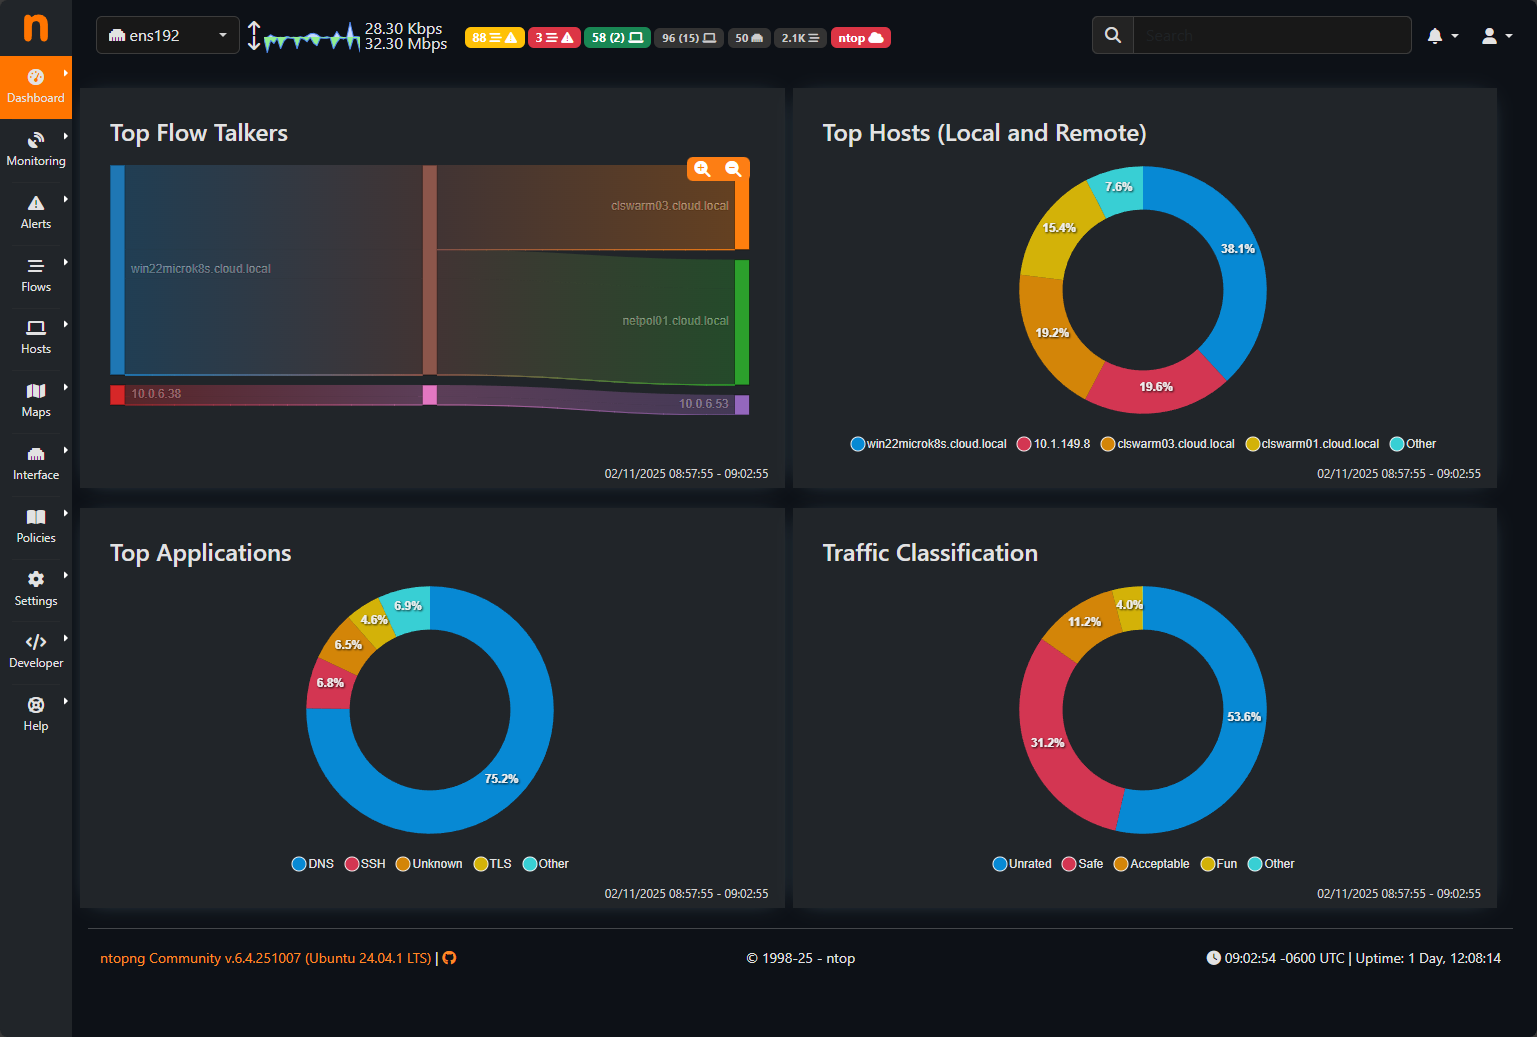
Once you get into ntopng and look around the dashboard you will see why it is such an extremely cool tool for the home lab. It starts giving you instant stats on traffic and throughput as well as top talkers on the network, and traffic flows. So you will start seeing network flows and protocols after just a couple of minutes of it gathering network packets, etc.
You will see widgets displayed on the dashboard of things like the top hosts in terms of traffic on the network, top applications, top flow talkers, and traffic classifications, pretty cool.
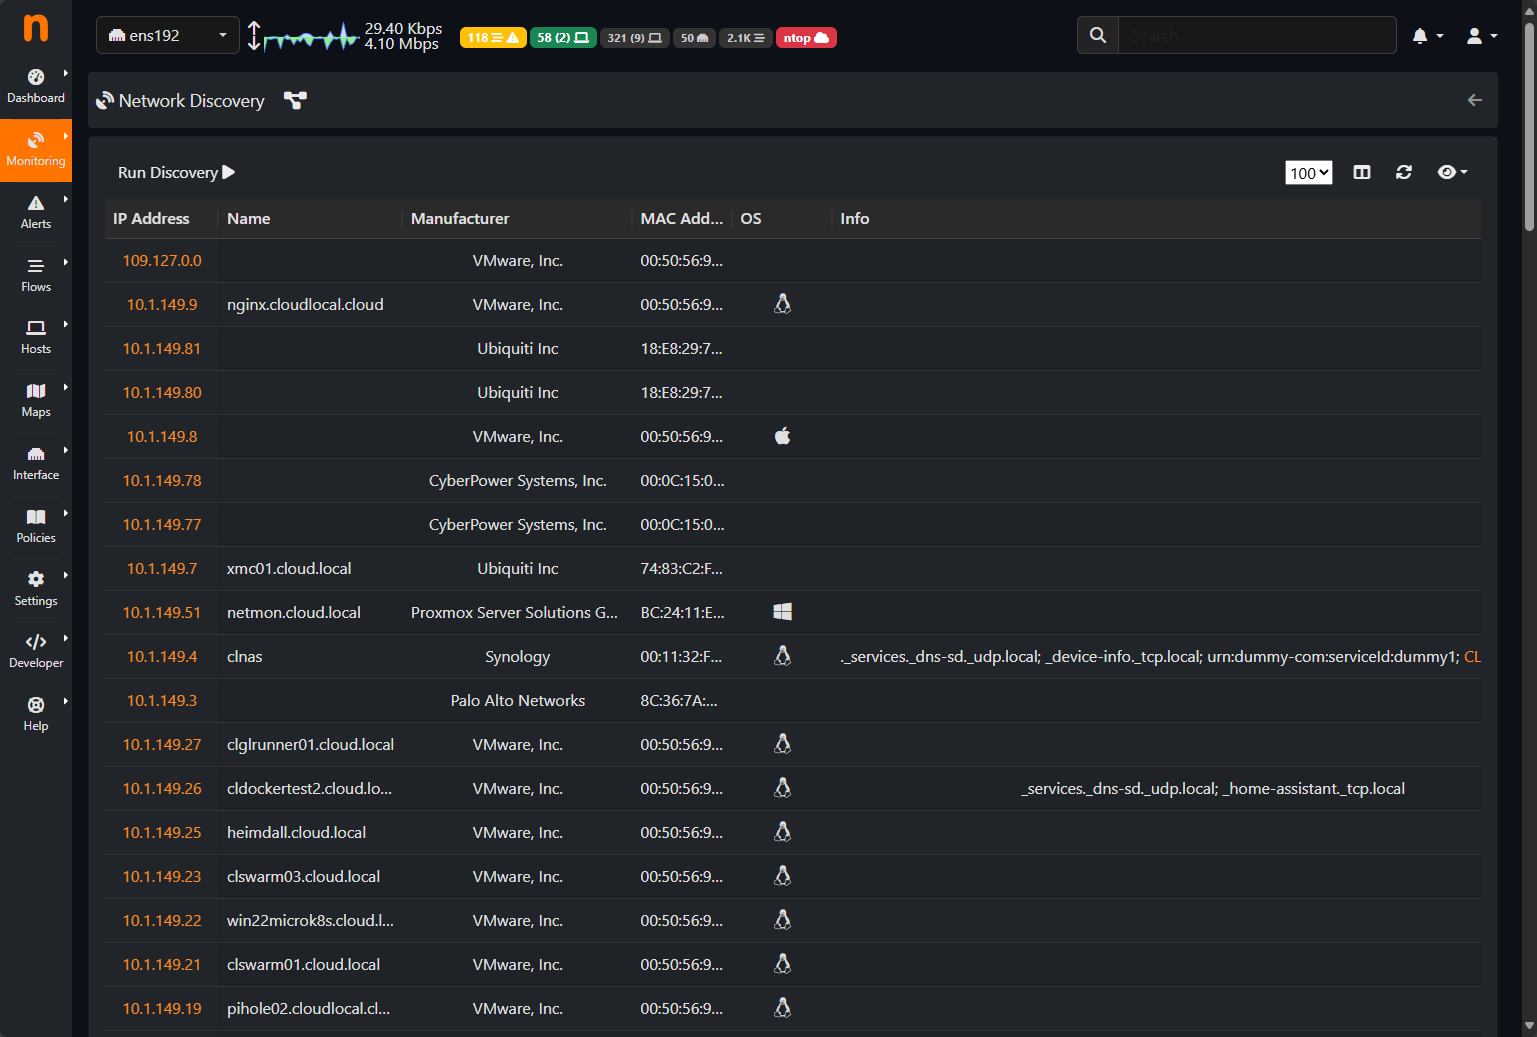
Network discovery
One of the first things that you will want to do is run a network discovery for your network using the network discovery feature of ntopng. As you can see, it finds IP addresses, DNS names if those exist, OUI lookups on the MAC addresses, the mac addresses themselves, and the operating system these are running.
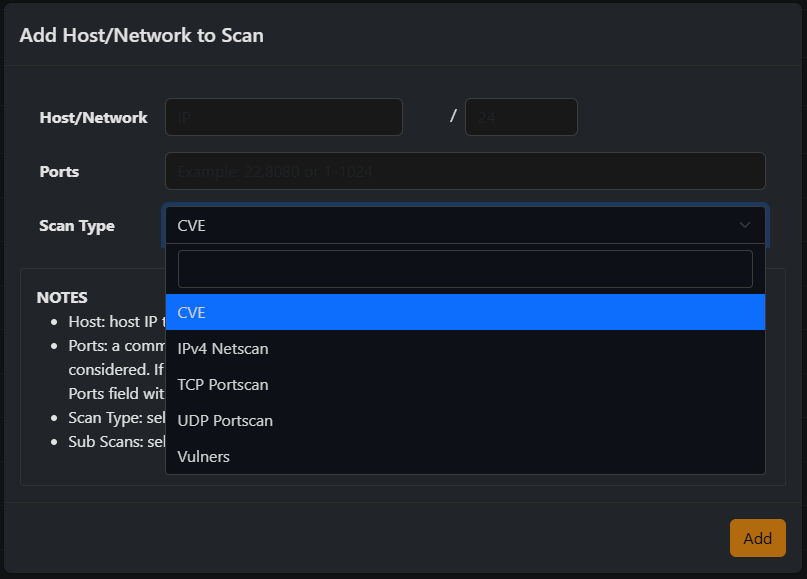
Vulnerability scan
One of the other really cool things that I think you have the ability to do with ntopng is vulnerability scans. Just hit the “+” button to add a network vulnerability scan for a host or network range. In the Scan Type drop down menu, you can see the scan types, including CVE, IPv4 Netscan, TCP Portscan, UDP Portscan, and Vulners.
Below, you can see a few scans that I ran on a few hosts.
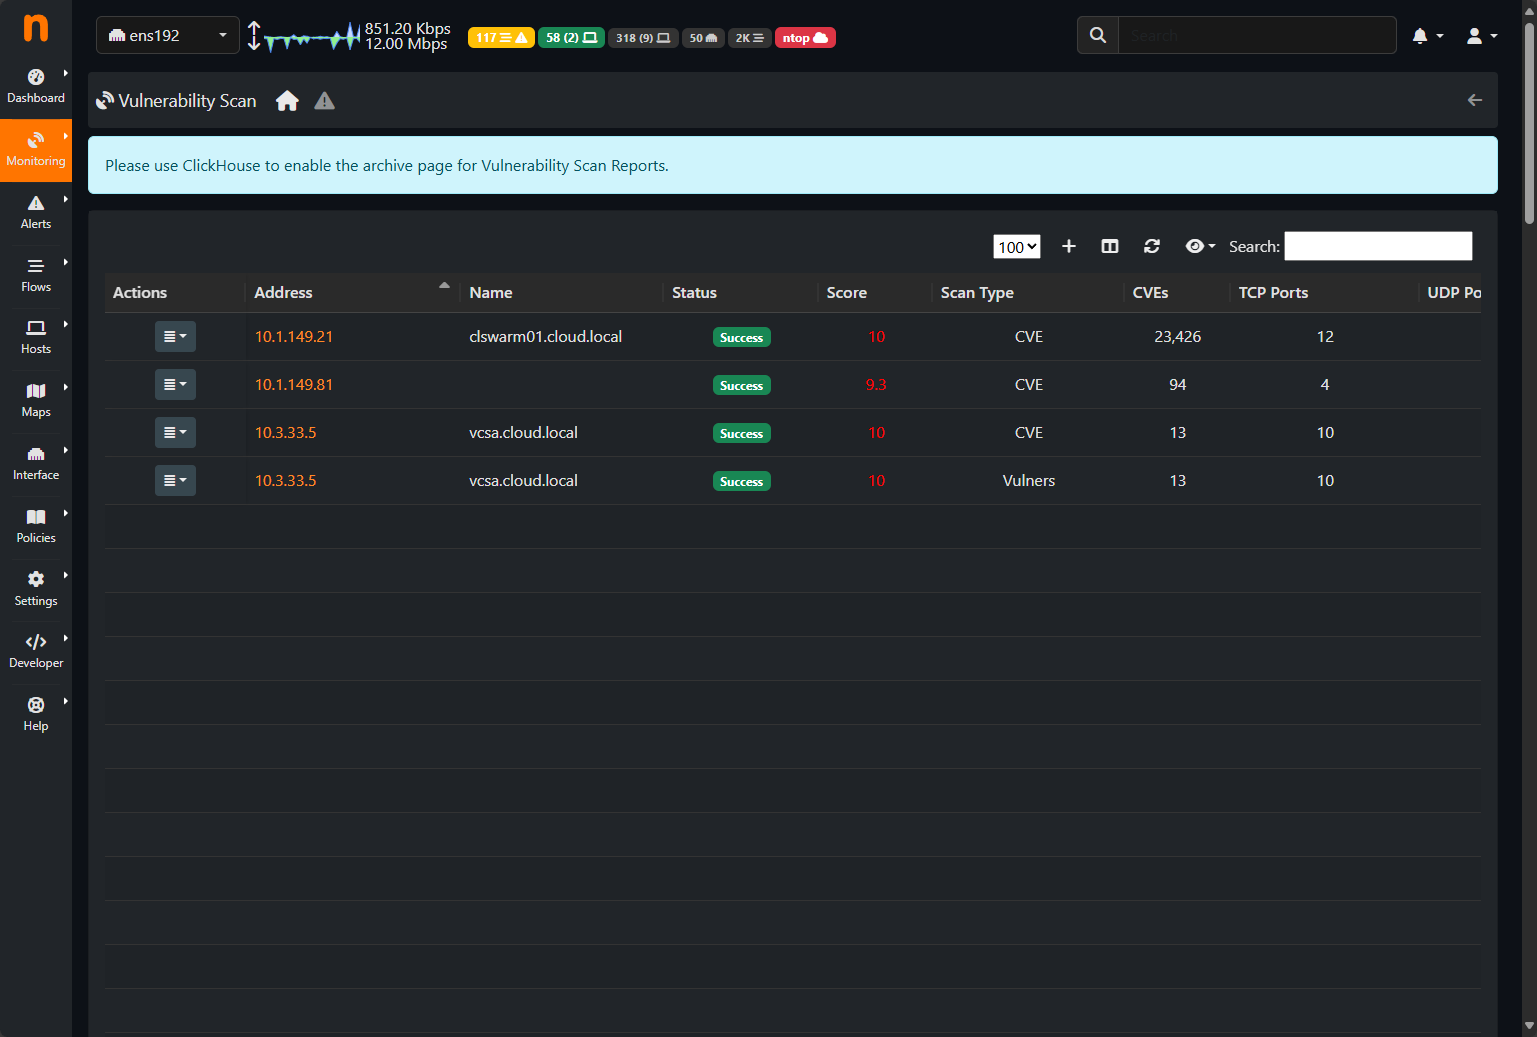
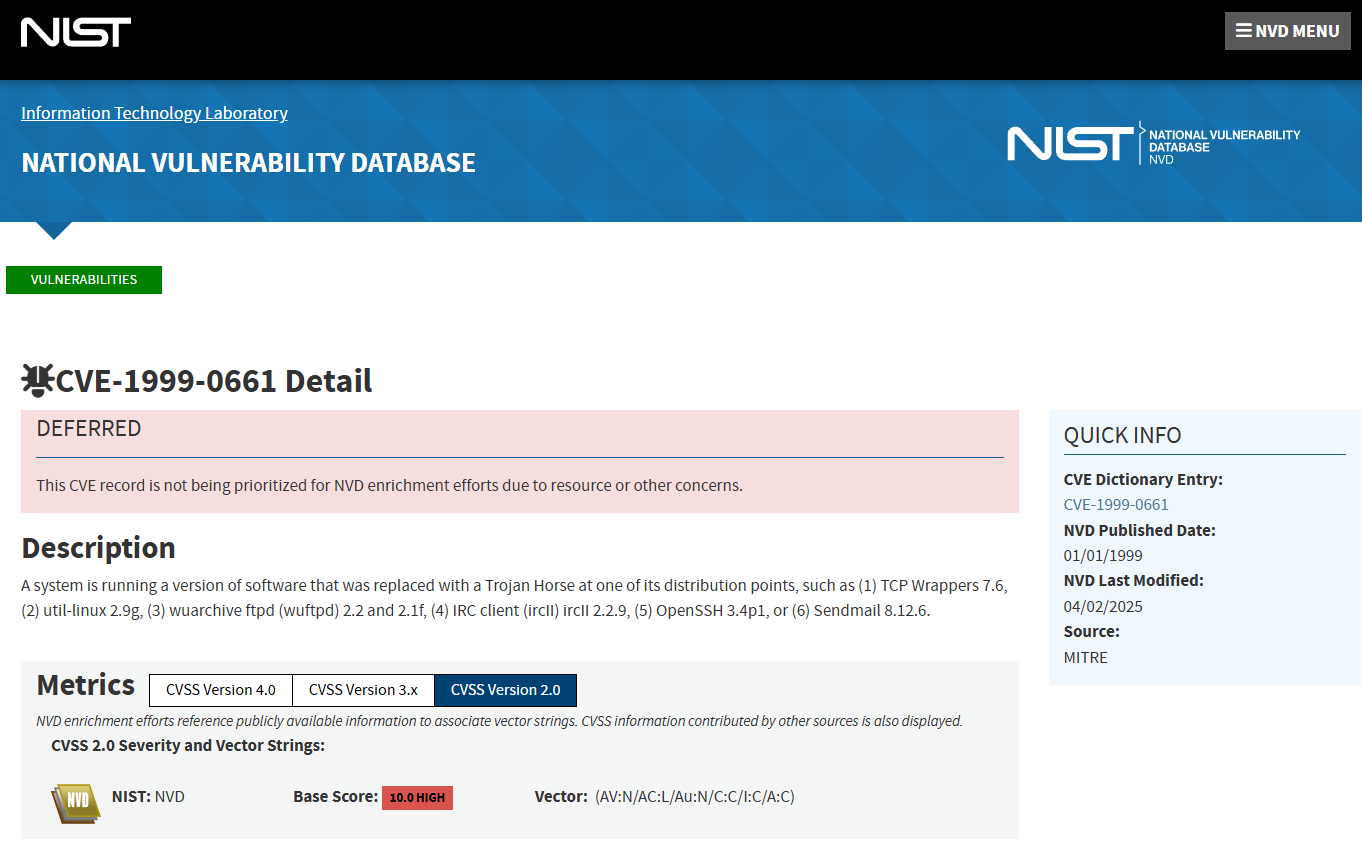
Once a scan is completed, you can click on it and view the results. The cool thing is it gives you clickable CVE hyperlinks that you can click and read more about the specific vulnerability.
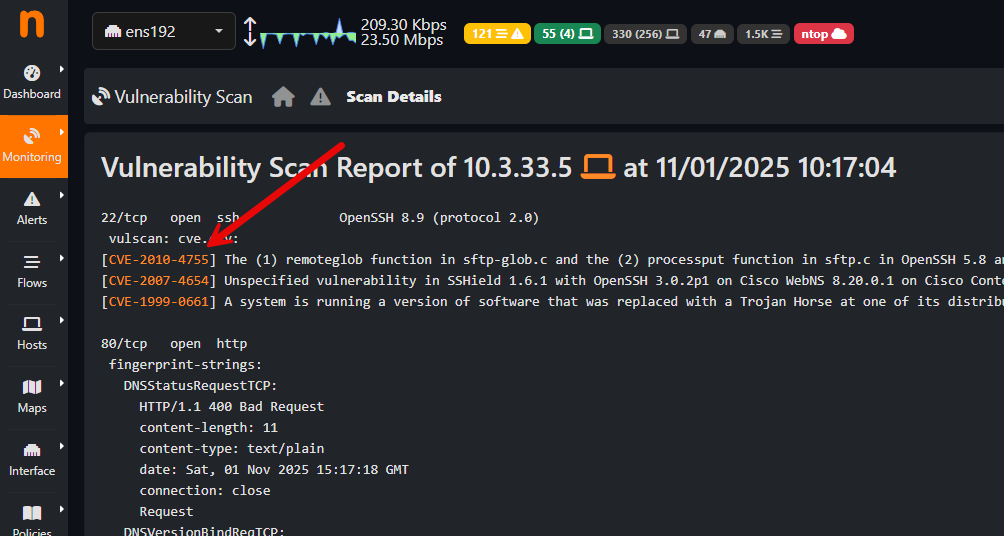
These links take you to the NIST vulnerability database page for that specific CVE.
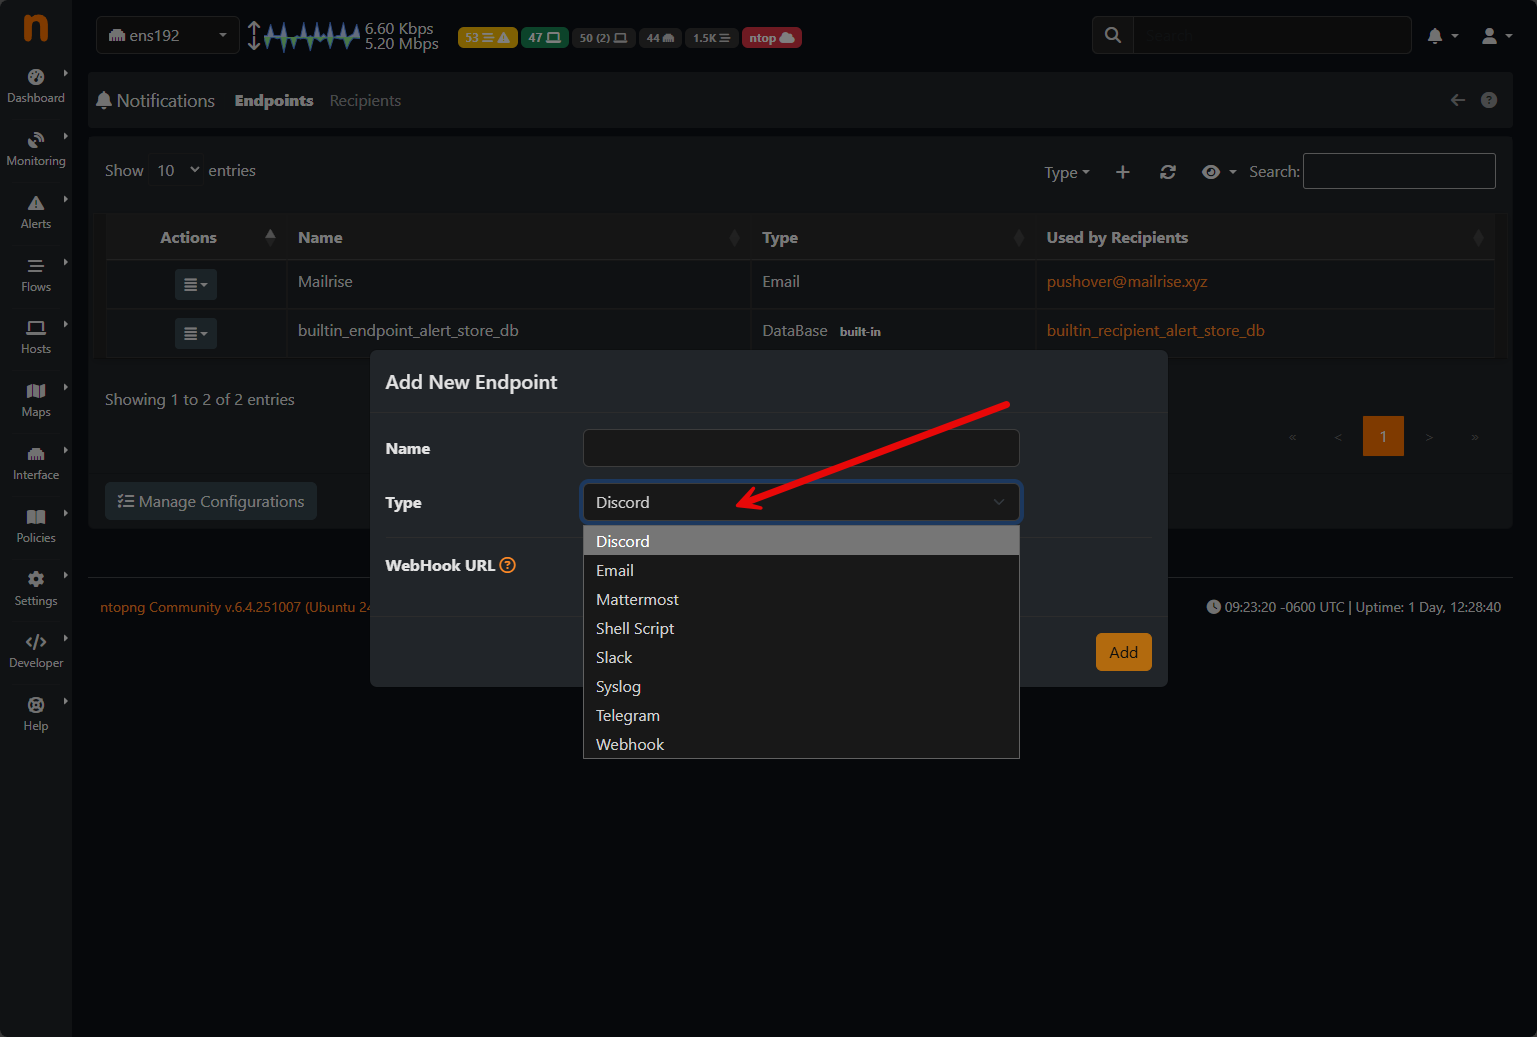
Alerting
Also, another great feature is the alerting that is built-in. Even in the community edition, you can setup a new alert endpoint and target a wide range of notification platforms, including legacy Email, or you can target:
- Discord
- Mattermost
- Shell Script
- Slack
- Syslog
- Telegram
- Webhook
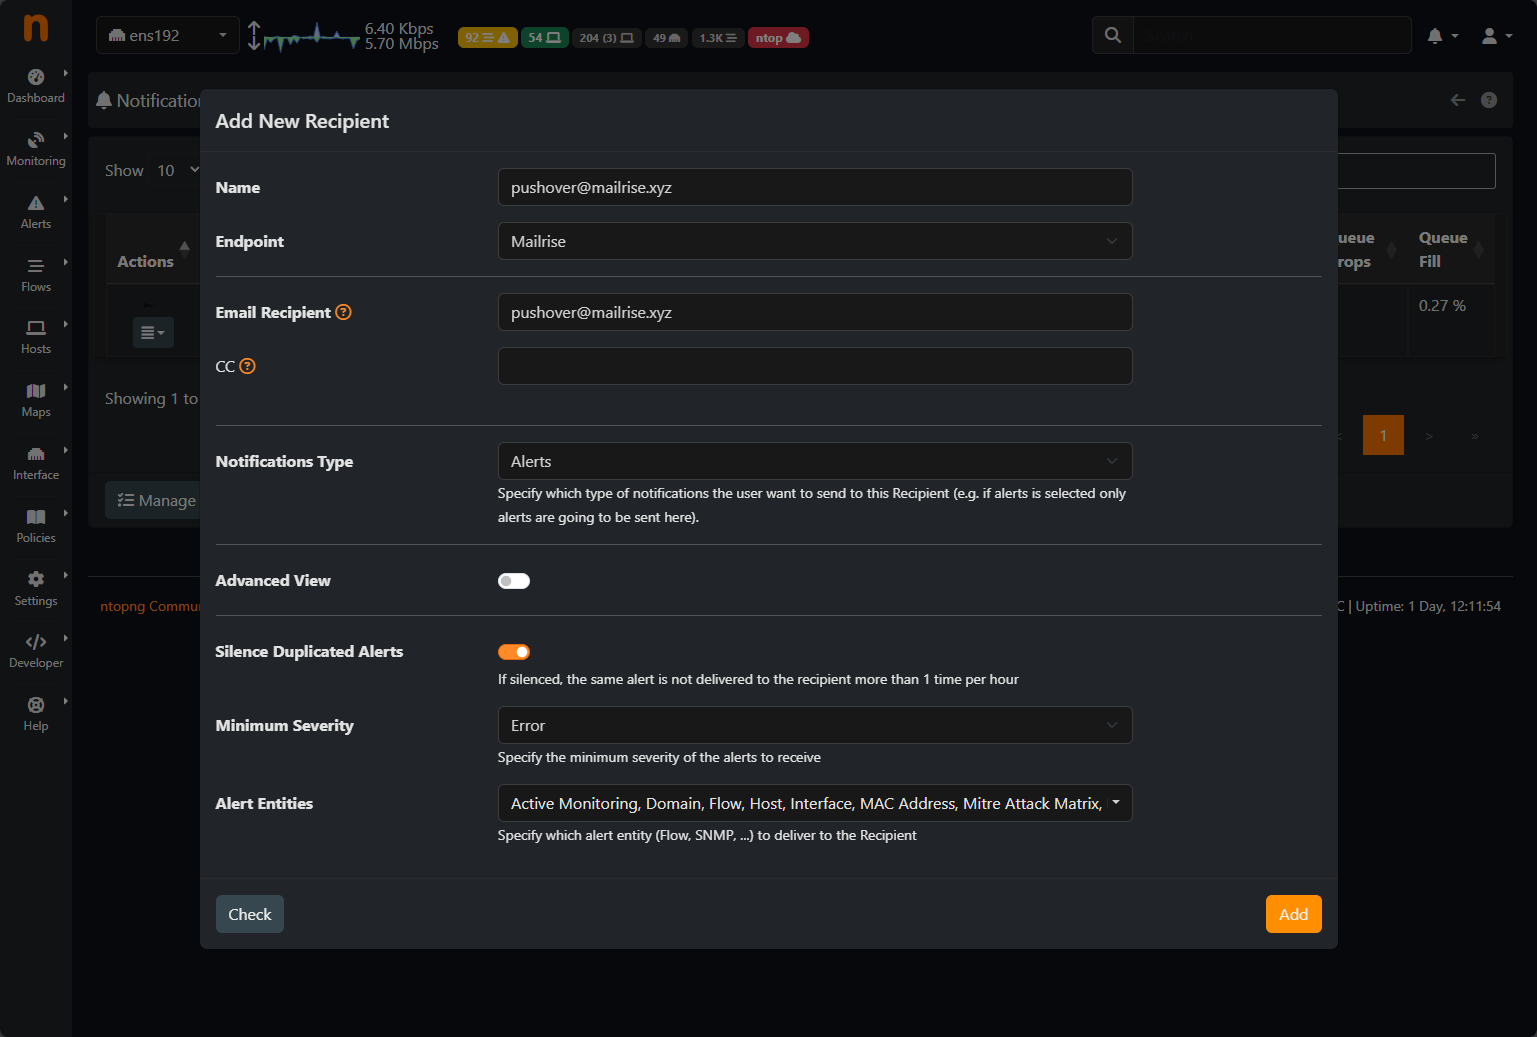
Below, I am targeting a mailrise endpoint I have running in the home lab that takes legacy SMTP and flips it to target any locations I want, like Pushover, as it is built on the Apprise framework.
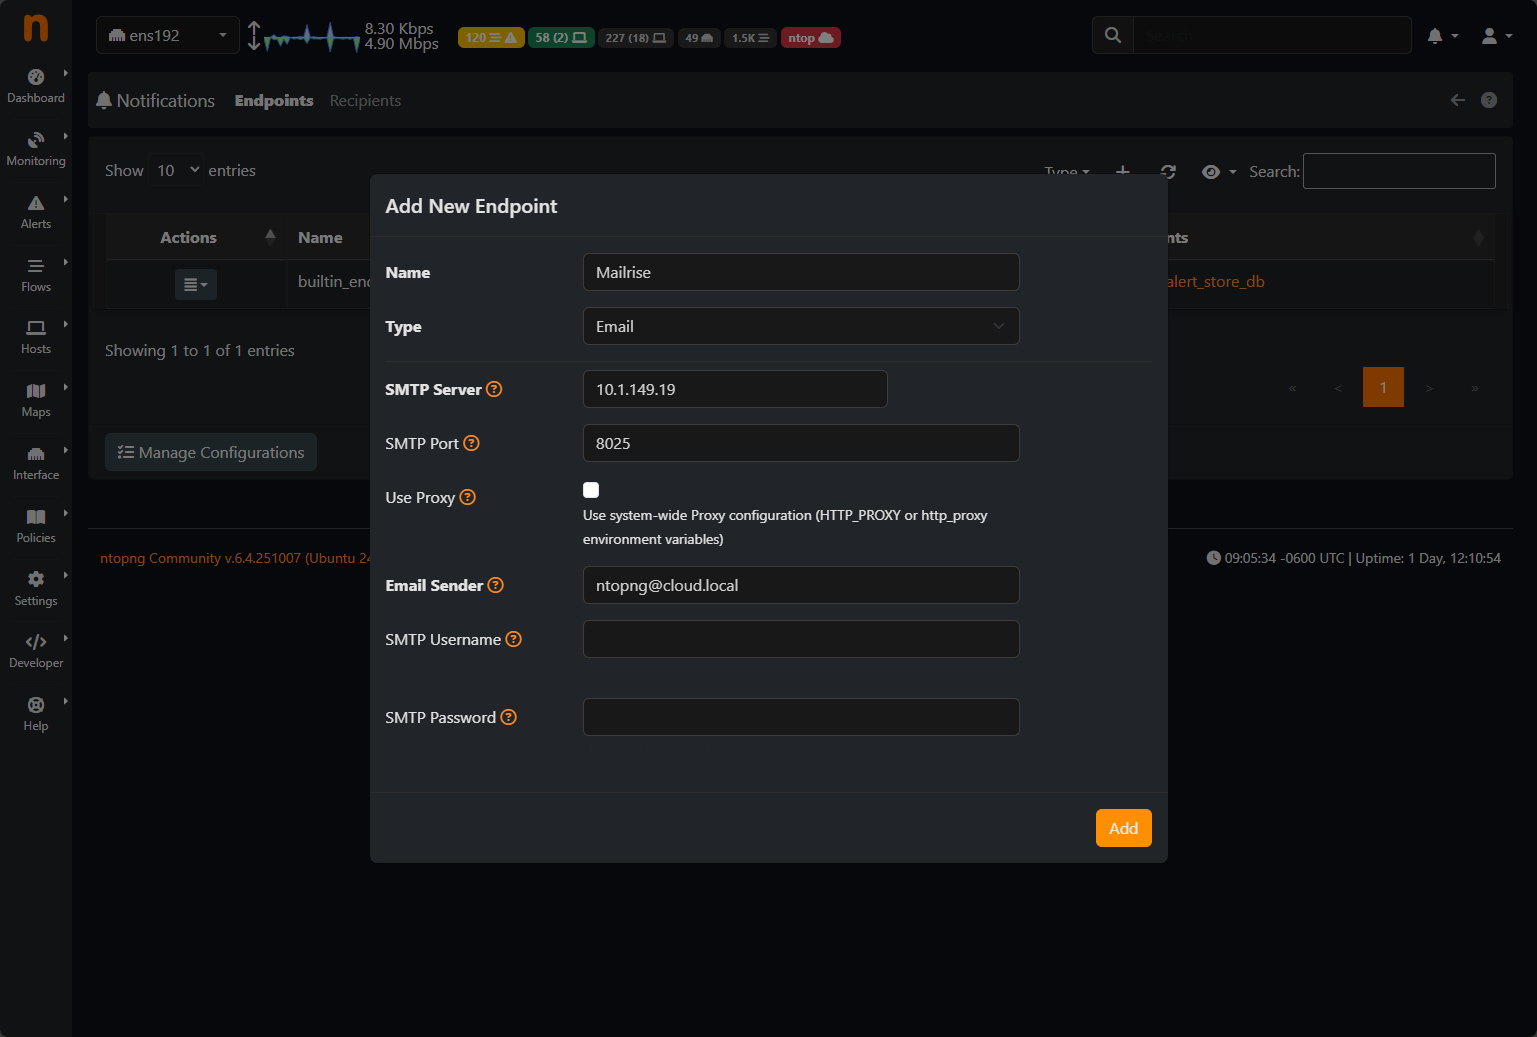
Then, you set up a new recipient for the alert. You can customize the notification type and other things.
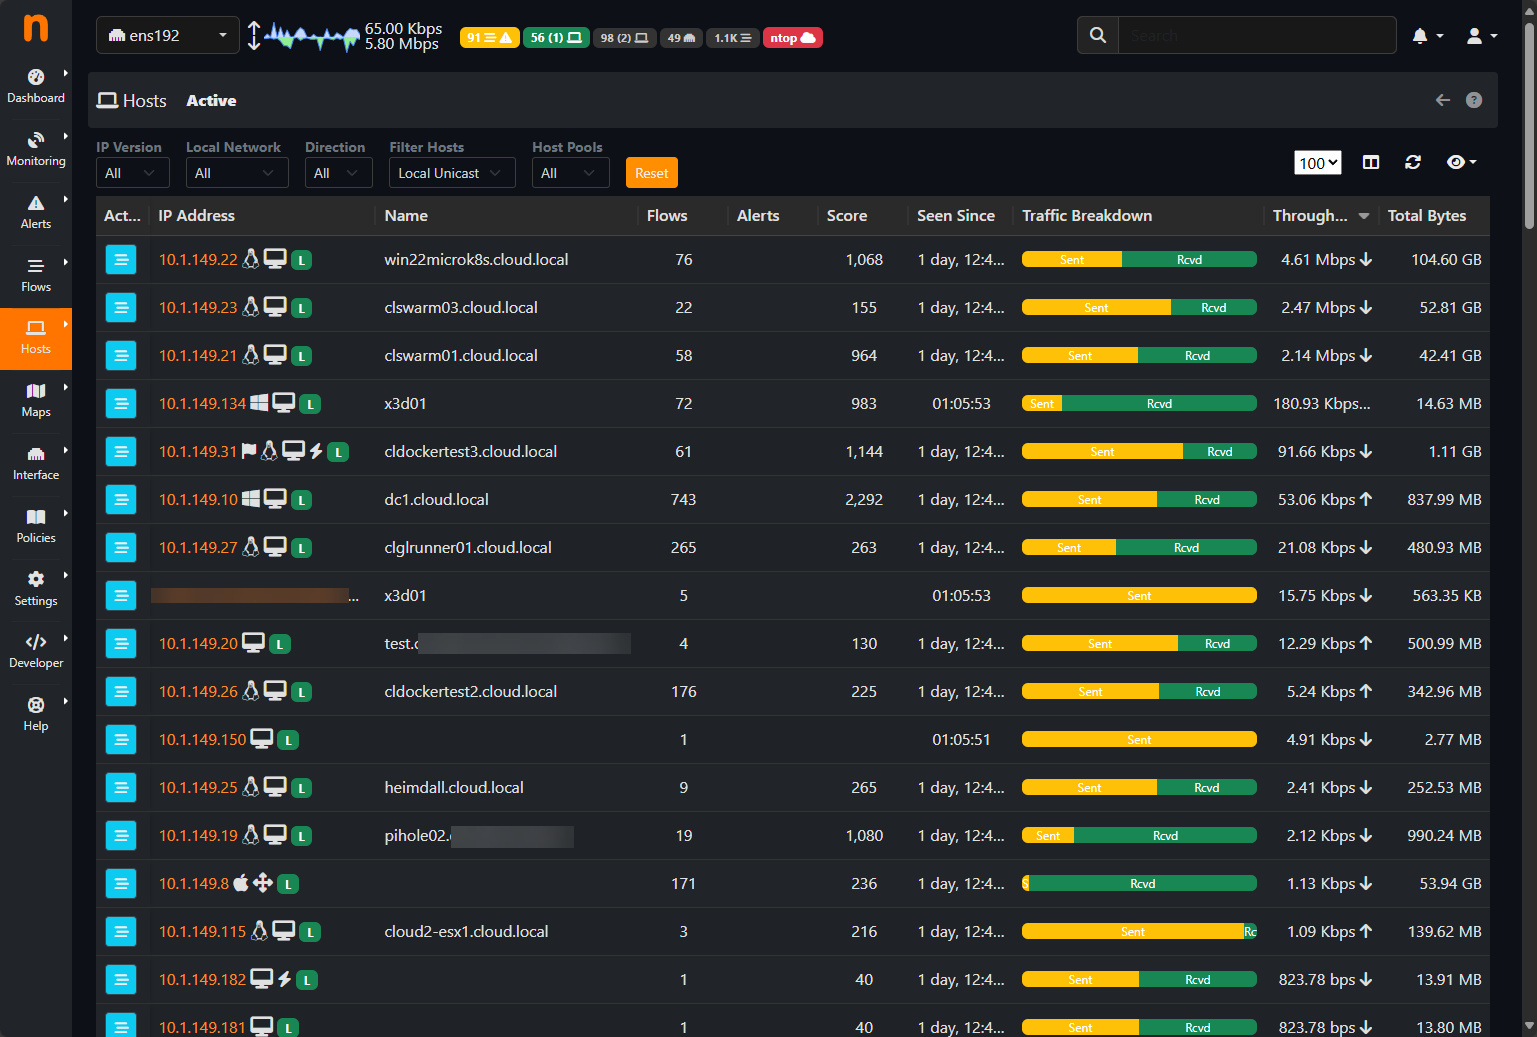
Viewing hosts that have warning, alerts, or normal traffic
Take a look at the wealth of information that you get on the hosts screen. The visual cues are really great here as it shows you the traffic breakdown for each host, the throughput and total bytes. You can also drill into these for even more detail.
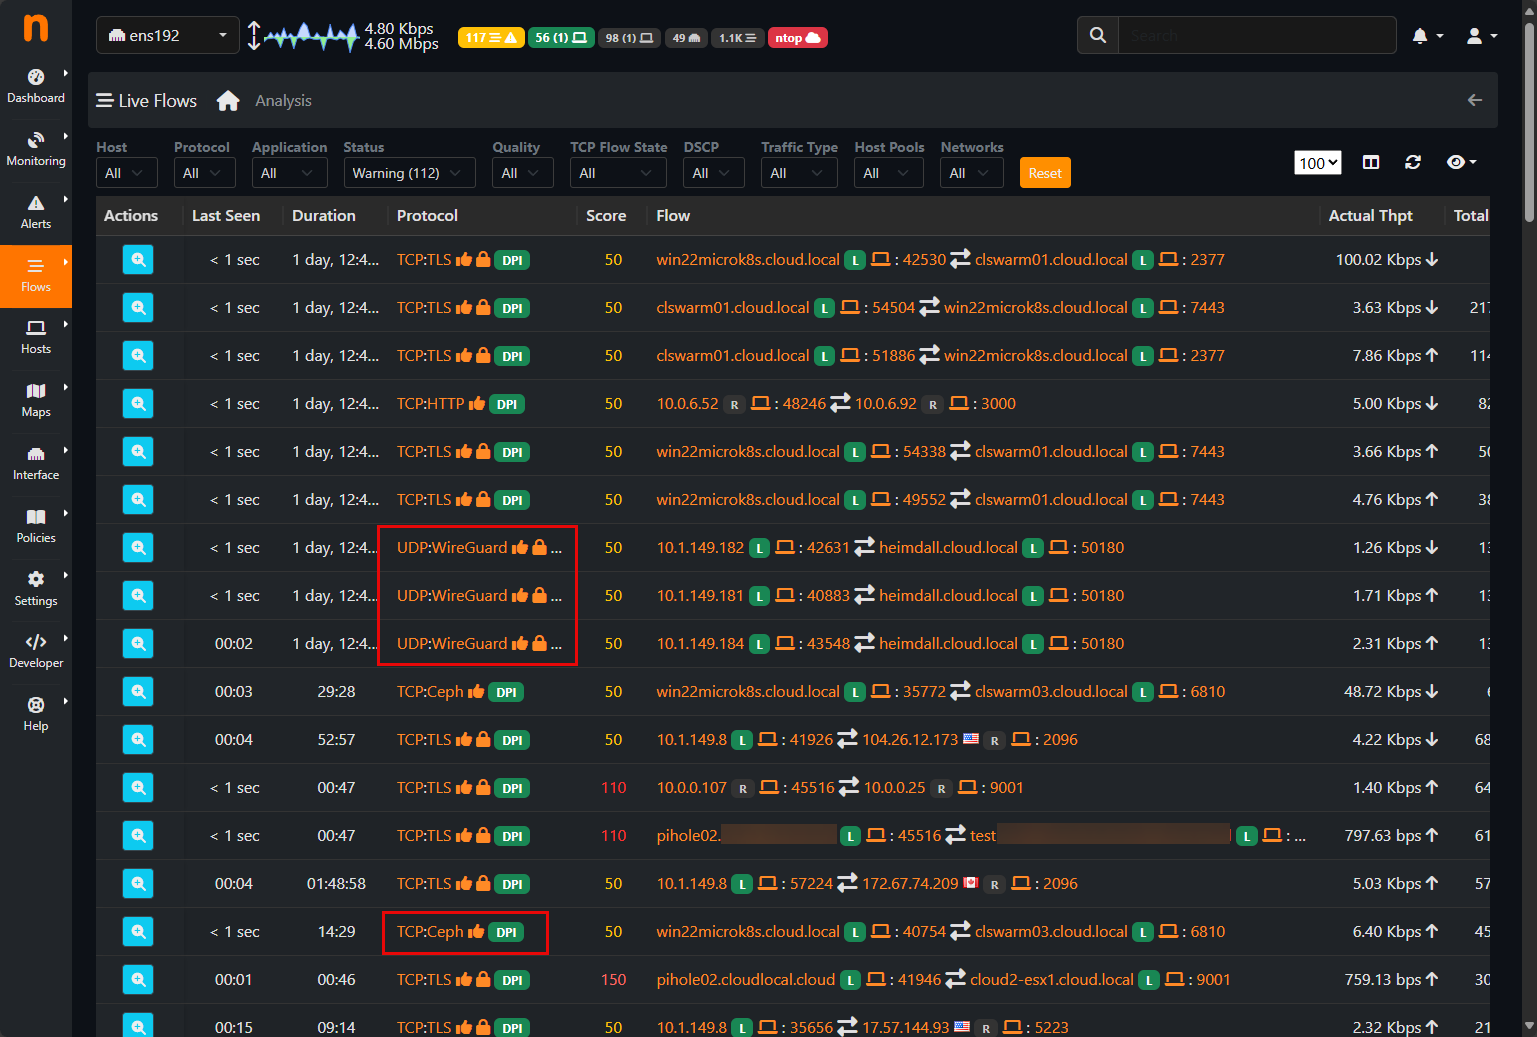
Viewing live traffic flows
You can also view live traffic flows. Here you can see some wireguard traffic and which endpoints have this established, and also Ceph traffic that I have running in the network. The ntopng container gives visibility to all of this, pretty cool!
Community Edition vs. Professional vs Enterprise
For home labs, the Community Edition of ntopng is the variant that you will likely want to work with. I found that it gives great visibility to things going on in the network that you likely don’t have without it. Even better, community edition even includes vulnerability scanning and alerting, allow with network monitoring.
There are a few shortcomings of the Community Edition that are a bit of a bummer, mainly the first one on the list below (notifications).
- Custom traffic thresholds are not included in the CE edition
- Integration with external databases for long-term storage
- Advanced security and behavior detection – there are definitely a lot of insights the CE edition gives you but of course Pro is going to go above and beyond on those features on the security side of things.
For setting up ntopng home lab network monitoring, the community edition still provides what I think is an excellent tool.
Integrating with Other Tools
ntopng plays nicely with a lot of tools you might already be running. You could think about some of the following integrations with other platforms that you may already have up and running in your home lab.
- Send flow data from your UniFi, OPNsense, or MikroTik routers using NetFlow or sFlow
- If you want even more visualizations, you can export flow data to Grafana for visualization
- Combine ntopng with Prometheus exporters for additional metrics
- Use the built-in SNMP integration to monitor interface bandwidth, etc
If you use Docker in your home lab, you can even integrate ntopng with cAdvisor and Prometheus to correlate container network usage with ntopng flow data. This combination gives you deep visibility from the container layer all the way up to the physical network.
Wrapping up
ntopng home lab network monitoring is a great way to actually see everything on your home server network and it is simple and easy to get started. Community Edition of the solution is totally free and it has all the features that I think are more than enough to get started using it to build out your own alerting and cybersecurity visibility into your home network. Let me know in the comments. Have you tried out ntopng in your home lab as of yet? What do you think about it?
More in this topic

Discuss this in the Community
Google is updating how articles are shown. Don’t miss our leading home lab and tech content, written by humans, by setting Virtualization Howto as a preferred source.
About The Author

A video about this would be nice, showcasing all the features in action and maybe a quick example on how to configure things to see the workflow.
@Bard definitely stay tuned on that one. I will have a video on this one coming in the next couple of weeks most likely.