
Monitoring your home lab infrastructure is one of the most important things you can stand up and learn about. Otherwise, yes, you can still have fun in a home lab when everything is going good. However, if you start having issues with performance or other quirks, it can be absolutely frustrating to try and figure out what is going on without some type of visibility. Docker containers are another abstraction layer on top of the existing ones that we commonly run like virtual machines. Zabbix is a free and open-source monitoring solution that is also enterprise-grade. Meaning, you can use this to monitor infrastructure in the enterprise as well as your home lab. Let’s see how to install it and how to get monitoring setup for a Docker container host.
What Zabbix is and why it is perfect for the home lab
Zabbix is a monitoring solution that is fully-featured and it can alert you when things are triggered from a monitoring perspective. It supports agent-based and agentless monitoring. You can monitor things like NSMP, IPMI, HTTP, and it also has native built-in support for Docker container monitoring.
Also, which is important, it gives you a historical view of your data and monitoring along with graphs and dashboards that can help you visualize what the data is telling you. As far as alerting, you can send alerts through email, Telegram, Slack, or other alerting platforms. It has a huge number of alerting platforms to choose from as we will see.
For the home lab, Zabbix is ideal since it can monitor everything in one place. You can monitor your Proxmox hosts, Linux Docker hosts, Docker containers, NAS devices, network flows, and other things. It is also fairly lightweight and easy to deploy using Docker which is nice in itself. There are definitely some great monitoring solutions out there, but some of them take specialized training just to install them. That is typically not what I want in my environments. I like to have something I can hit the ground running with.
Another thing I like it is that it has monitoring templates that let you have preconfigured settings you can apply to hosts that you want to monitor in Zabbix and it automatically gives Zabbix the intelligence to skillyfully monitor whatever platform or stack that you are adding to your Zabbix server. It also has strong integrations meaning you can tie in various other vendor technologies or monitor these with Zabbix.
Installing Zabbix with Docker
The simplest way to get started is to deploy Zabbix using Docker Compose. This method allows you to define all components, including the Zabbix server, web interface, and database, in a single YAML file.
You’ll need Docker and Docker Compose installed on your host. Once that’s in place, create a new directory for your Zabbix setup and add a file named docker-compose.yml with the contents below but modified for your environment. I left my bind mount in place to see how that can be done.
services:
  mysql-server:
    image: mysql:8.0
    container_name: zabbix-mysql
    restart: unless-stopped
    environment:
      MYSQL_DATABASE: zabbix
      MYSQL_USER: zabbix
      MYSQL_PASSWORD: zabbix_password
      MYSQL_ROOT_PASSWORD: root_password
    volumes:
      - /home/linuxadmin/homelabservices/zabbix/mysql:/var/lib/mysql
    command:
      - mysqld
      - --character-set-server=utf8mb4
      - --collation-server=utf8mb4_bin

  zabbix-server:
    image: zabbix/zabbix-server-mysql:latest
    container_name: zabbix-server
    restart: unless-stopped
    environment:
      DB_SERVER_HOST: mysql-server
      MYSQL_DATABASE: zabbix
      MYSQL_USER: zabbix
      MYSQL_PASSWORD: zabbix_password
      MYSQL_ROOT_PASSWORD: root_password
    ports:
      - "10051:10051"
    volumes:
      - /home/linuxadmin/homelabservices/zabbix/server:/var/lib/zabbix
    depends_on:
      - mysql-server

  zabbix-web:
    image: zabbix/zabbix-web-nginx-mysql:latest
    container_name: zabbix-web
    restart: unless-stopped
    environment:
      DB_SERVER_HOST: mysql-server
      MYSQL_DATABASE: zabbix
      MYSQL_USER: zabbix
      MYSQL_PASSWORD: zabbix_password
      ZBX_SERVER_HOST: zabbix-server
      PHP_TZ: America/Chicago
    ports:
      - "8080:8080"
    depends_on:
      - mysql-server
      - zabbix-server
Save the file, then run the following command from the same directory:
docker compose up -d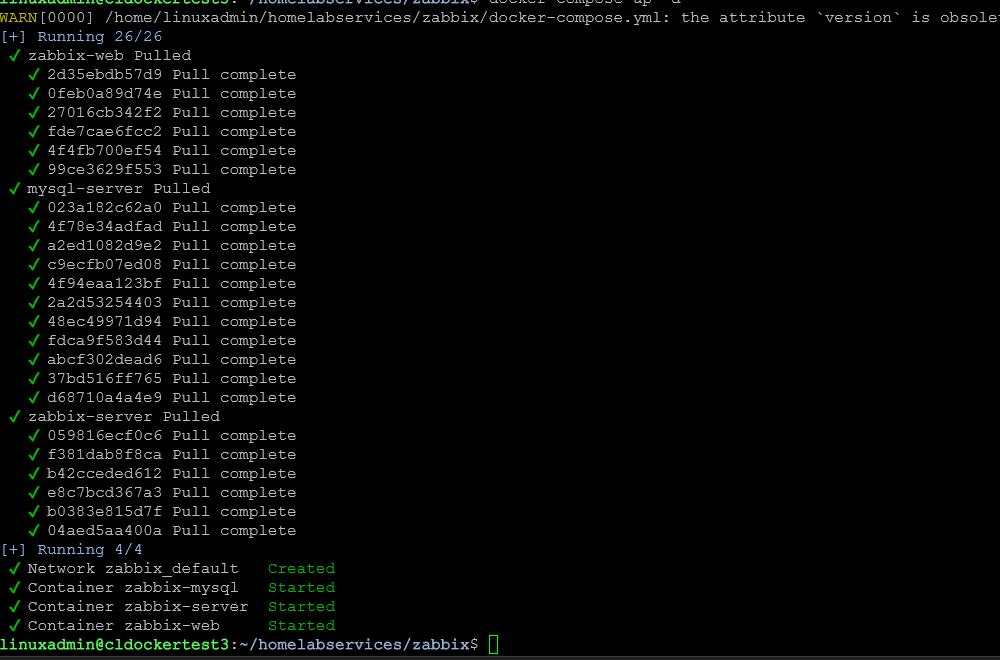
Docker will download the images and create the containers. This will start your Zabbix environment. I like to run a docker compose ps and make sure the services are in a healthy state.

http://<your-server-ip>:8080You should see the Zabbix web interface. The default login credentials are:
- Username: Admin
- Password: zabbix
After you get logged in, you will land at the Zabbix dashboard. There it displays system information and quick overview of the Zabbix environment. At this point you can start adding your monitored hosts and start getting metrics.
My Zabbix configuration overview
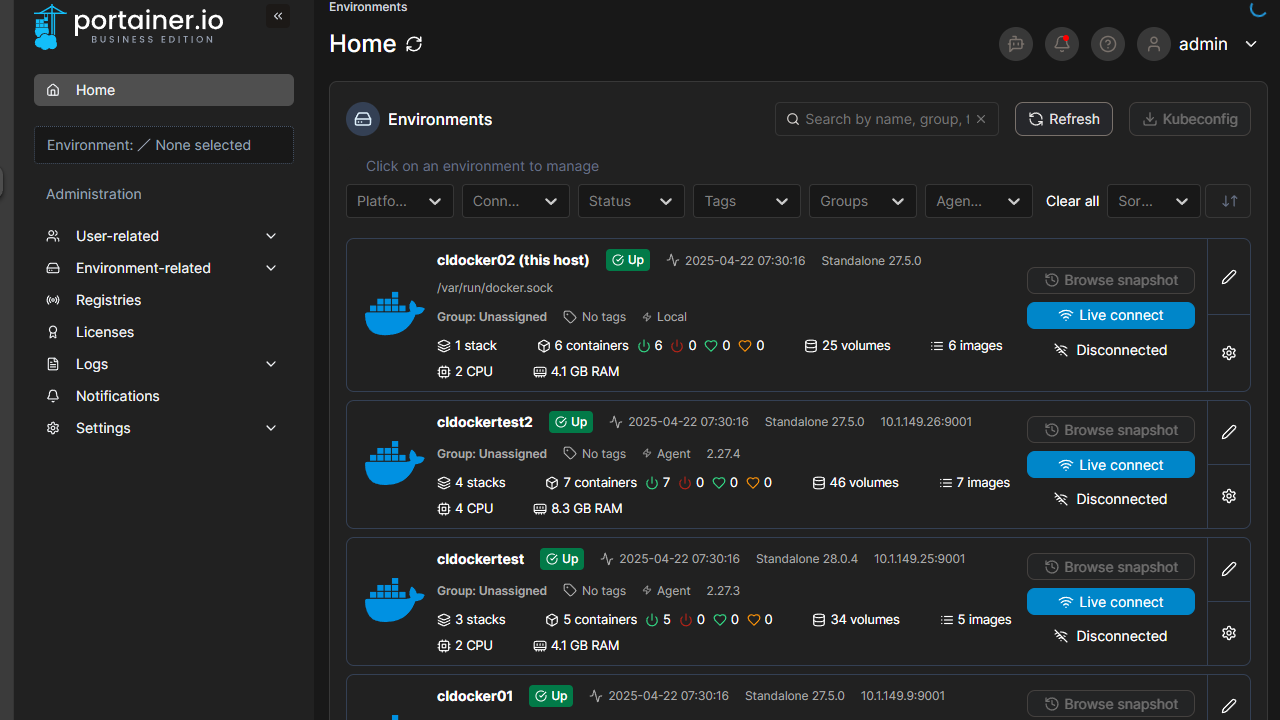
So just for the purposes of this post, let me give you an overview of how I have things configured. First I have an Ubuntu Server that is serving as my Docker host and where I am running the Zabbix Docker containers.
So, even though Zabbix is running on a specific Linux host as a container, it doesn’t just automatically start monitoring the host where it is running. If you run Zabbix as an installed package in Ubuntu, it would work that way, but not as a container.
So, I also installed the Zabbix agent 2 package which I will show in the next section. We will then add the Docker host itself as a monitored host in Zabbix.
How I added my Docker host to Zabbix for monitoring
The easiest way to add your Docker host to Zabbix is to install the Zabbix agent 2 installation on the server.
Zabbix can monitor Docker hosts and containers using its modern Agent2, which supports container metrics natively. To set this up, you’ll deploy a Zabbix Agent2 container on the host that’s running your other containers.
Here’s an example that is directly from the official Zabbix Agent 2 installation documentation for Ubuntu 24.04 which you can look at here: Zabbix Ubuntu 24.04 install instructions. I have added the line below to add the zabbix user to the docker group as well so the Zabbix user has permissions to the Docker socket.
# Install the Zabbix repository
wget https://repo.zabbix.com/zabbix/7.4/release/ubuntu/pool/main/z/zabbix-release/zabbix-release_latest_7.4+ubuntu24.04_all.deb
sudo dpkg -i zabbix-release_latest_7.4+ubuntu24.04_all.deb
sudo apt update

# Now install the agent
sudo apt install zabbix-agent2 -y

# Add zabbix user to docker group
sudo usermod -aG docker zabbix

# Restart agent
sudo systemctl restart zabbix-agent2
sudo systemctl enable zabbix-agent2
The key here is the Docker socket mount. The Zabbix Agent2 container can use /var/run/docker.sock to read container metadata and statistics from the Docker daemon. Once this agent is running, it will automatically send metrics to the Zabbix server container you deployed earlier.
Configure the agent configuration file
# Edit the config file
sudo nano /etc/zabbix/zabbix_agent2.conf
I changed the following values to allow the Zabbix server to interact with the agent configuration. Note the following:
- Server – This is a list of comma delimited IP addresses or DNS names of Zabbix servers
- ServerActive – Zabbix server/proxy address or cluster configuration to get active checks from
- Hostname – List of comma delimited unique case sensitive hostnames (not network hostnames, but Zabbix hostnames)
Server=10.1.149.31,172.19.0.0/16
ServerActive=10.1.149.31
Hostname=cldockertest3
After you have modified the agent configuration, you will need to restart the zabbix agent to pick up the new configuration.
# After edit
sudo systemctl restart zabbix-agent2
sudo systemctl status zabbix-agent2
Add the monitor host in Zabbix dashboard
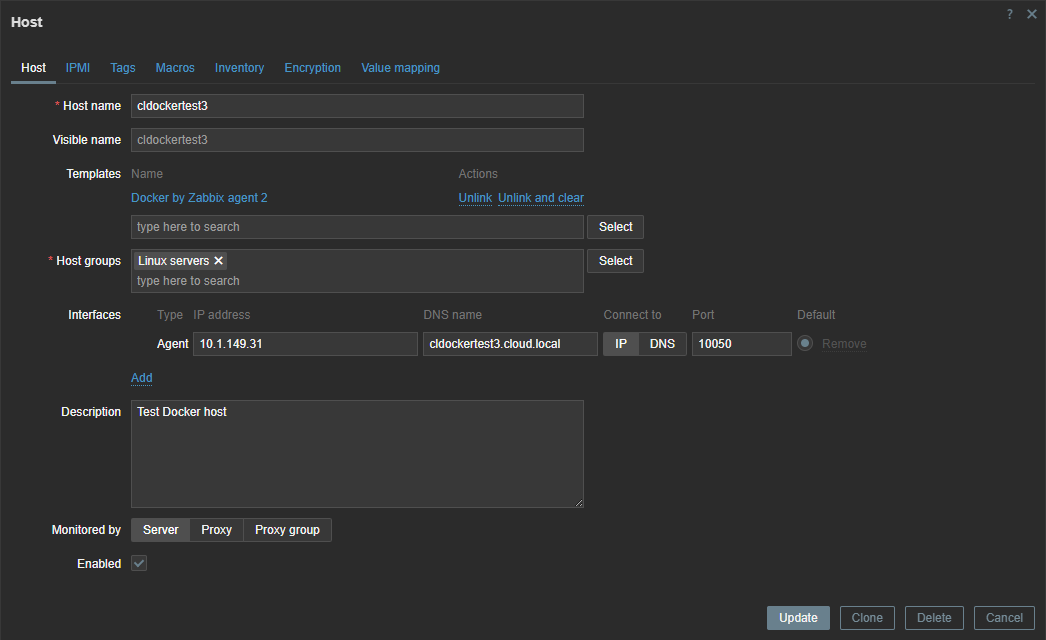
Navigate to Monitoring > hosts > Create host. Here is how I entered in the information in my Zabbix server to monitor the host once it was configuration. Enter the Host name as you have it in the configuration file. Then notice the Template I have added the Docker by Zabbix agent 2 template which is included in the box.
Troubleshooting connectivity between agent and Zabbix server
After you point your agent configuration file to the Zabbix server and restart the agent, it is a good idea to tail the logs for the agent to make sure everything looks good.
sudo tail -30 /var/log/zabbix/zabbix_agent2.logWith this you can see potential issues as you can see in the output from the log below. You can see below, since the Zabbix server was running inside a Docker container on the same host, I needed to add the Docker IP range.
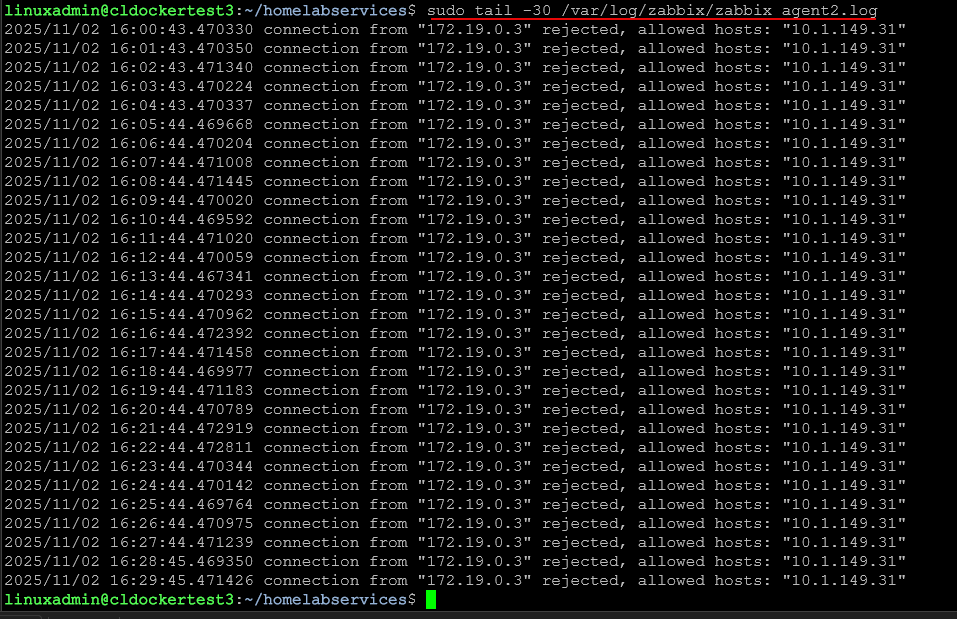
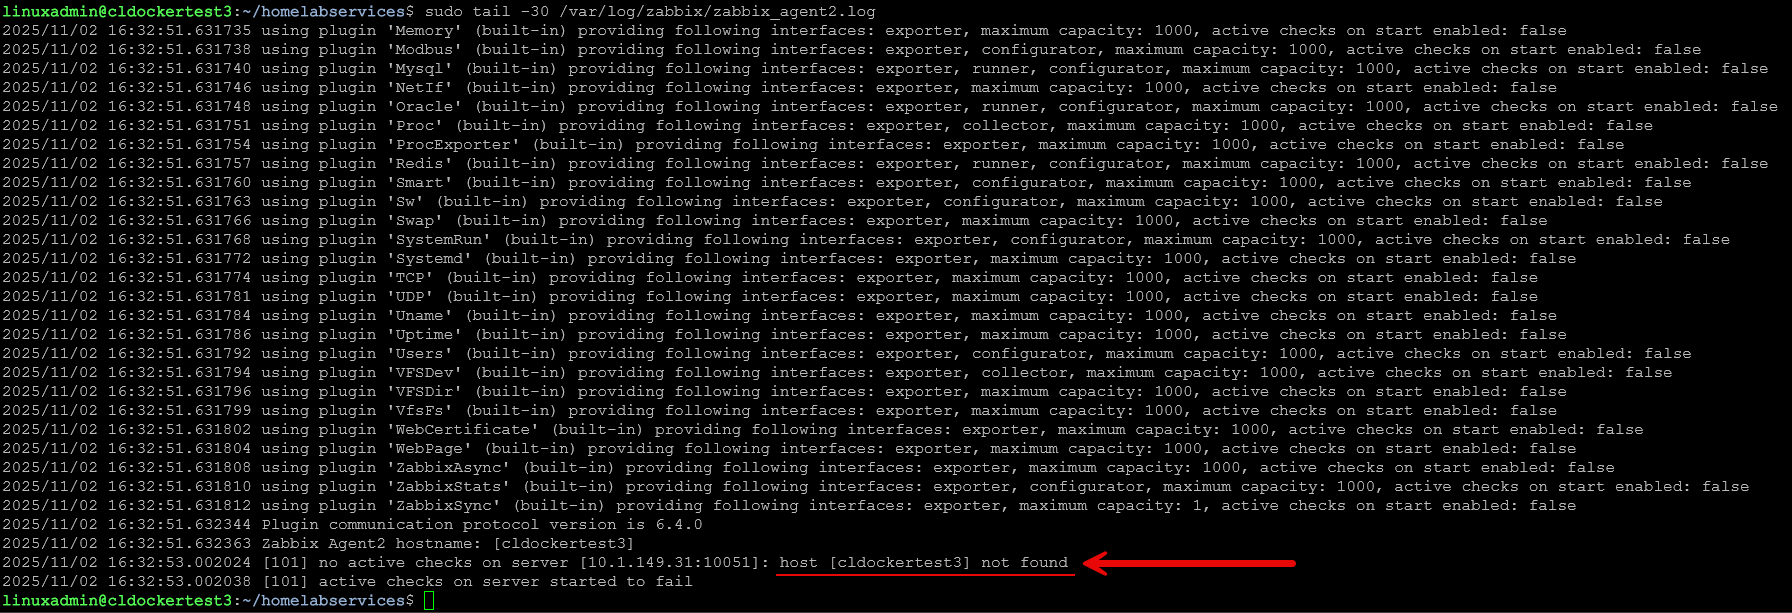
Below is an example of a mismatch between the configuration file and what is configured in the Zabbix host monitoring configuration. These names must match exactly.
Looking at container metrics and graphs
In a few minutes, you should start seeing data populate in the Latest data section. Zabbix will automatically discover containers that are running and start collecting metrics like:
- Container name and image
- CPU usage per container
- Memory and swap utilization
- Container uptime
- Network I/O statistics
- Number of restarts
This built-in Docker template makes the setup of what’s monitored very easy. It uses discovery rules to detect new containers automatically.
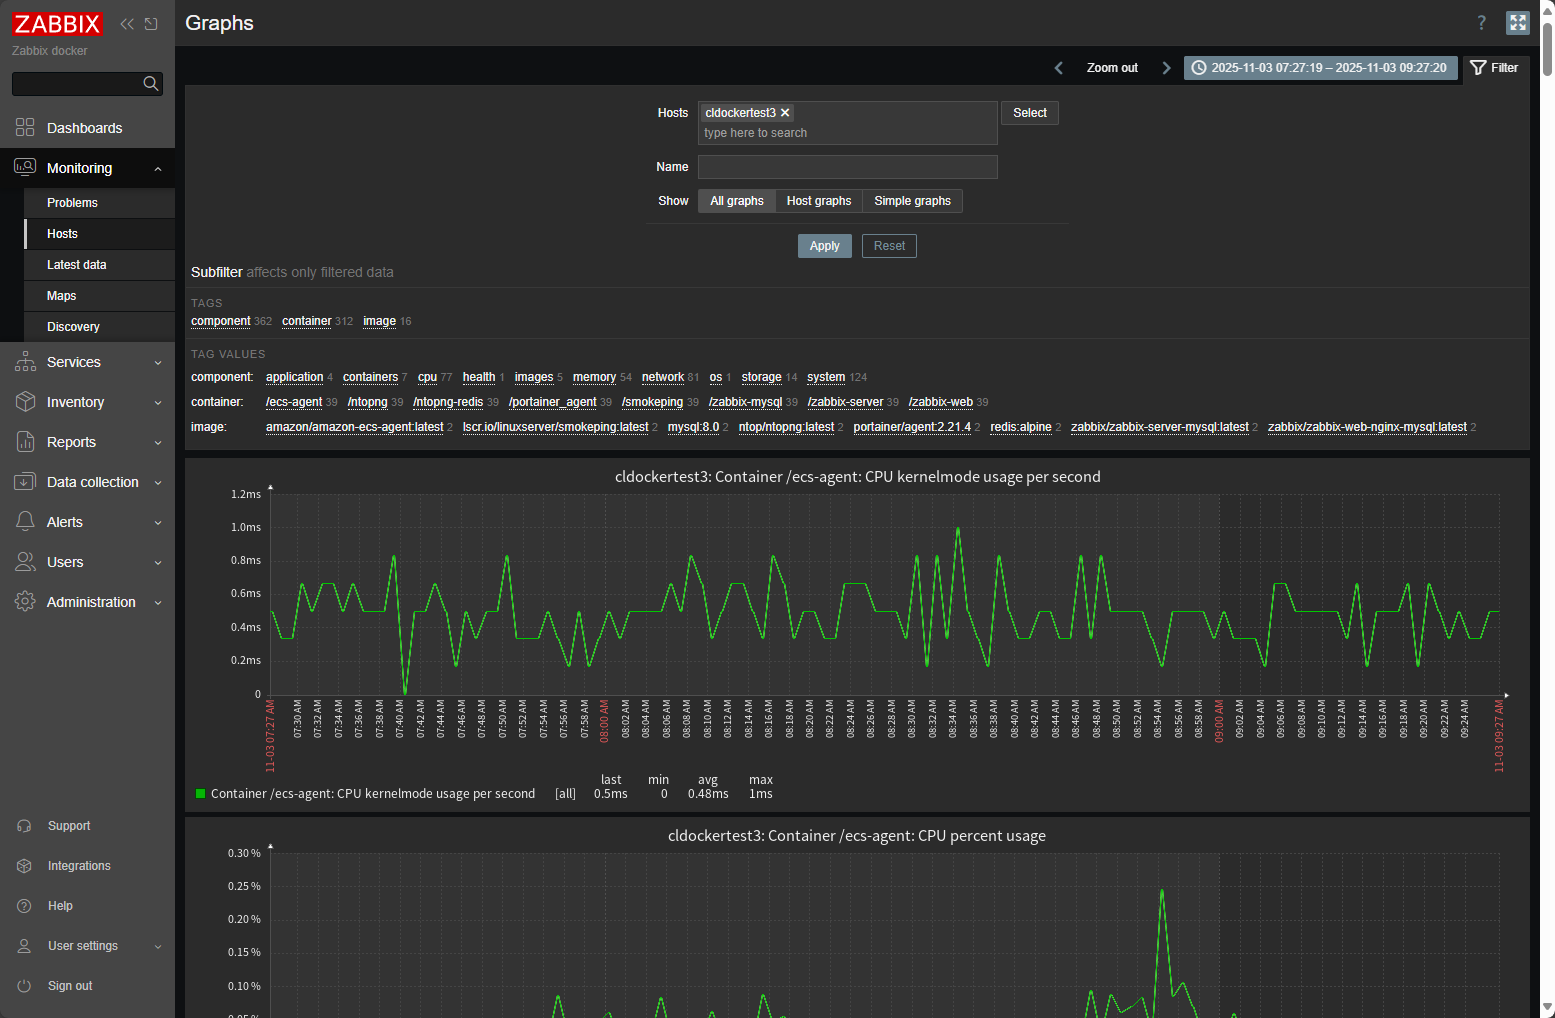
Once data begins flowing in, the fun part starts. Navigate to Monitoring > Hosts and select your Docker host. Under the Graphs tab. Here is where you will find detailed graphs of your containers’ performance data and metrics.
You can track CPU utilization across all containers, see which ones are using the most memory, or analyze network traffic over time. The real power comes when you build custom dashboards.
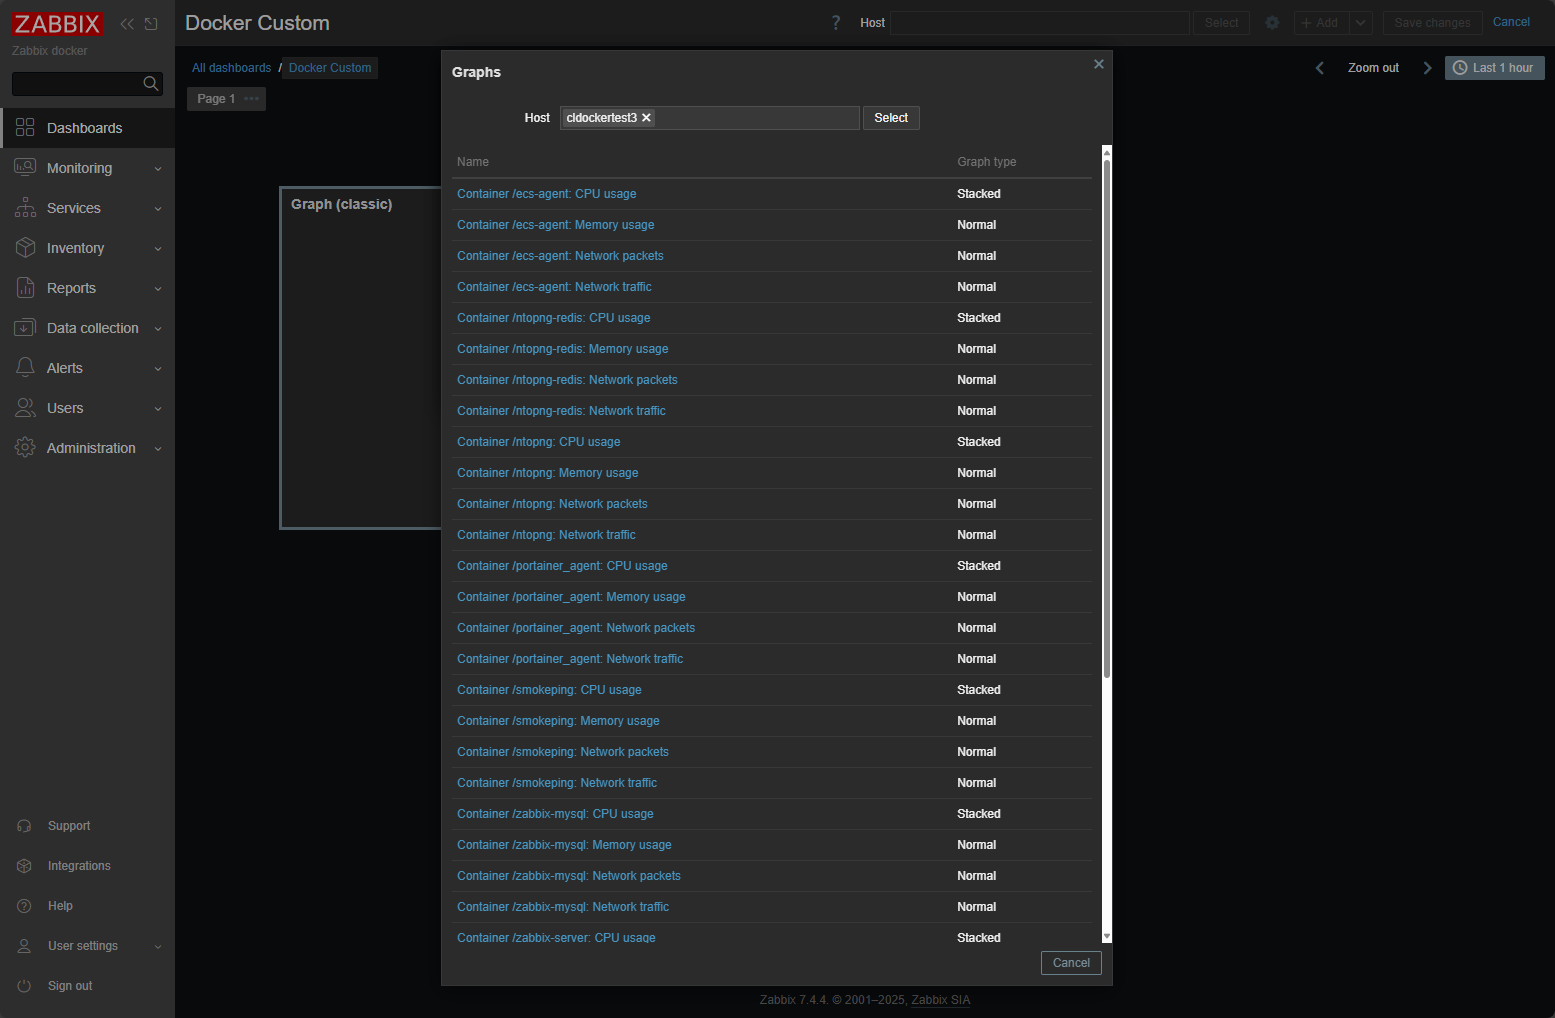
Creating a custom dashboard
You may want to create your own custom dashboard. To create a custom dashboard, take a look at the following steps:
Go to Dashboards > “hamburger menu top right” > and click Create new. Give it the name you want to assign, add widgets that you want to add and save the dashboard.
Configuring alerts and triggers
Monitoring is only useful if it can notify you when something goes wrong. Zabbix uses triggers to define alert conditions. For example, you can set an alert when container memory usage exceeds 80 percent or when a container stops running.
To create a trigger:
- Go to Configuration > Hosts.
- Select your Docker host and click the Triggers tab.
- Click Create trigger and define a name such as “High memory usage.”
- Use an expression like:
{Template App Docker by Zabbix agent 2:docker.memory.usage.max.last()}>80 - Assign a severity level and click Add.
Zabbix can send notifications via email, Telegram, Slack, or webhooks. To configure alerting, go to Alerts > Media types and set up your preferred method. You can then link it to user accounts under Users > Media.
With alerts in place, you’ll know right away if a container is using too much CPU, memory, or stops responding altogether.
Optimizing Zabbix for Small Home Labs
Even though Zabbix can scale to thousands of devices, you’ll want to tune it for smaller home lab setups to save resources.
- Set longer polling intervals (for example, 60 seconds instead of 10) to reduce load.
- Limit historical data retention under Administration > Housekeeping to keep the database small.
- Disable unnecessary discovery rules and templates for services you don’t use.
- Use Docker volumes for persistent data so upgrades or container rebuilds don’t erase your configurations.
These tweaks will help keep Zabbix running smoothly on a low-power system like a NUC, Raspberry Pi, or mini PC.
Wrapping up
The ability to see what’s happening in your environment at a glance is one of the best feelings for any home lab enthusiast. With Zabbix, you can watch every container, host, and service from a single dashboard. You’ll know which services are running hot, which are idle, and when something goes offline.
Zabbix’s flexibility also means you can extend your monitoring beyond Docker. Later, you can add SNMP devices like UniFi switches, virtual machines, or even IoT gear, all within the same interface. It scales effortlessly, giving you full control over your growing lab environment.
Once you get familiar with how Zabbix works, you’ll realize it’s not just another monitoring tool. It’s a complete observability solution that lets you operate your home lab like a professional data center.
If you’ve ever wanted to take your Docker setup to the next level, Zabbix is the way to do it. With just a few containers, you can gain full insight into your systems, prevent downtime, and keep your lab running like a boss.
Google is updating how articles are shown. Don’t miss our leading home lab and tech content, written by humans, by setting Virtualization Howto as a preferred source.
About The Author


Share your Zabbix Docker monitoring dashboards!
Nice write-up! If you want to compare approaches later, Checkmk is also worth a look.
Raw Edition is open-source and the Cloud Edition is free up to 25 hosts.
They have a clean guide for Docker monitoring too
(Full transparency: my company is a partner.)