If you are like me, when you manage networks, whether in the home lab or production environment, you probably use tools like ping, traceroute, netstat, etc. These are great tools and can help you diagnose simple network problems very quickly. However, sooner or later, you will run into problems that a simple command-line utility can explain. Wireshark is a tool that shows exactly how your hosts are talking back and forth and any transient failures or unseen retransmits on the wire. This guide walks you through practical scenarios and workflows with Wireshark for beginners.
What is Wireshark?
Wireshark is a free, open-source network protocol analyzer that captures packets in real time. It displays them in human-readable form and gives you visibility into every network “conversation” between devices on your network.
Wireshark shows the full view of the network traffic, decoding hundreds of protocols, flagging retransmissions, and pinpointing latency spikes or handshake failures. It is super helpful if you are troubleshooting a flaky Wi-Fi link in a home lab or tracking down an intermittent outage in a production data center, or performance issues. This low-level view of traffic is just not possible with other types of tools.
A “slow or broken” network ticket
If you ask any network engineer what the typical help-desk ticket looks like and you’ll hear three words: “It’s slow today”, or the “network doesn’t work” or something very vague like that. In a home lab you phrase it differently, “why is rsync crawling?”. But in general, the troubleshooting call is
- Establish symptoms (latency vs. loss vs. throughput)
- Reproduce and capture with the problem traffic
- Visualize the flow (handshake, negotiations, retransmissions)
- Localize the bottleneck to a link, device, or configuration
- Validate the fix with a second capture
Ping covers step one. Traceroute and iperf help with step two. Step three onward almost always requires packet introspection, and that’s what Wireshark delivers.
Choosing your capture point
This is one of the most important aspects of the Wireshark capture. You need to pick the right place to capture the traffic. If you capture on the wrong interface, this can generate noise and may even lead to you not seeing any of the traffic that you need to see.
Below is the screen that you will see when you open Wireshark, albeit with not as many network interfaces hopefully (I know I am a glutton for punishment). Choose the interface where your traffic is that you want to capture.
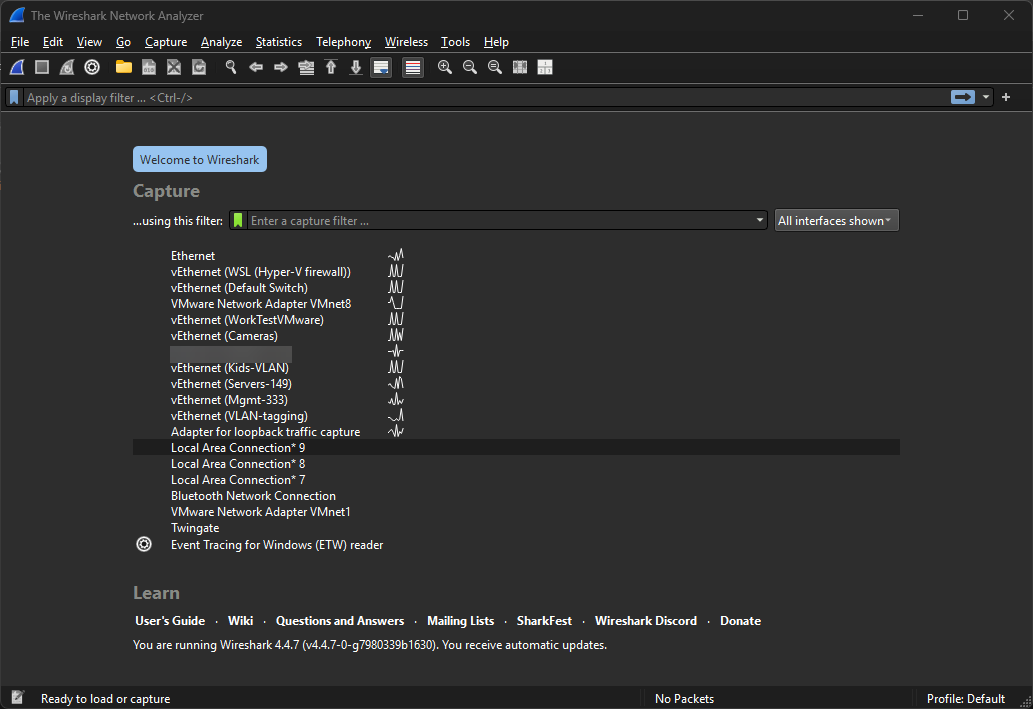
Below are a few ideas for thinking about the interfaces you are capturing on.
Home Lab Scenarios
- Laptop on Wi-Fi: Capture directly on the wireless NIC to see retries, signal issues, or WPA handshake failures.
- Virtual machines on a bridged vNIC: Load Wireshark in the VM and select this interface for your capture
- Raspberry Pi Kubernetes nodes: SSH in and run tcpdump, then copy the pcap to your workstation for analyzing in Wireshark
Production Scenarios
- Core switch span port: Mirror traffic from the suspect VLAN
- Firewall packet monitor: Many NGFWs let you capture after decryption. This is perfect for IPSec or SSL VPN issues
- Inline tap on 10 GbE links: Hardware taps avoid drops at high throughput and preserve timing accuracy, which is important
The rule of thumb is this. You need to capture as close to the affected endpoint as possible while still seeing both directions of the flow.
Capture Filters vs. Display Filters and the difference
Wireshark speaks two different filter languages, and knowing when to use each one is half the battle:
| Task you’re troubleshooting | Capture filter – BPF syntax (set before you click Start) | Display filter – Wireshark syntax (apply after capture) |
|---|---|---|
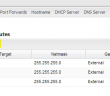
| DHCP packets only | udp port 67 or udp port 68 | bootp |
| All traffic to/from one host | host 10.0.0.42 | ip.addr == 10.0.0.42 |
| Single host + specific TCP port | host 10.0.0.42 and tcp port 8443 | ip.addr == 10.0.0.42 && tcp.port == 8443 |
| Site-to-site IPSec ESP | ip proto 50 | esp |
| Only initial SYN packets | (capture filter impractical—use display filter) | tcp.flags.syn == 1 && tcp.flags.ack == 0 |
| Retransmissions / out-of-order segments | (cannot pre-filter—must capture everything) | tcp.analysis.retransmission |
Building your capture filters
Even a gigabit link can dump gigabytes of traffic in minutes, so filtering at capture time is crucial. Berkeley Packet Filter (BPF) syntax looks complicated but it boils down to a few simple expressions:
| Scenario | Capture Filter |
|---|---|
| Only DNS traffic | udp port 53 |
| One host and any TCP/UDP port | host 10.0.0.42 |
| A single TCP port on one host | host 10.0.0.42 and tcp port 8443 |
| All IPSec ESP packets | ip proto 50 |
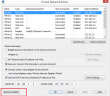
In Wireshark, you can enter these in the Capture Options box before you press Start. In the tcpdump, append -f "filter".
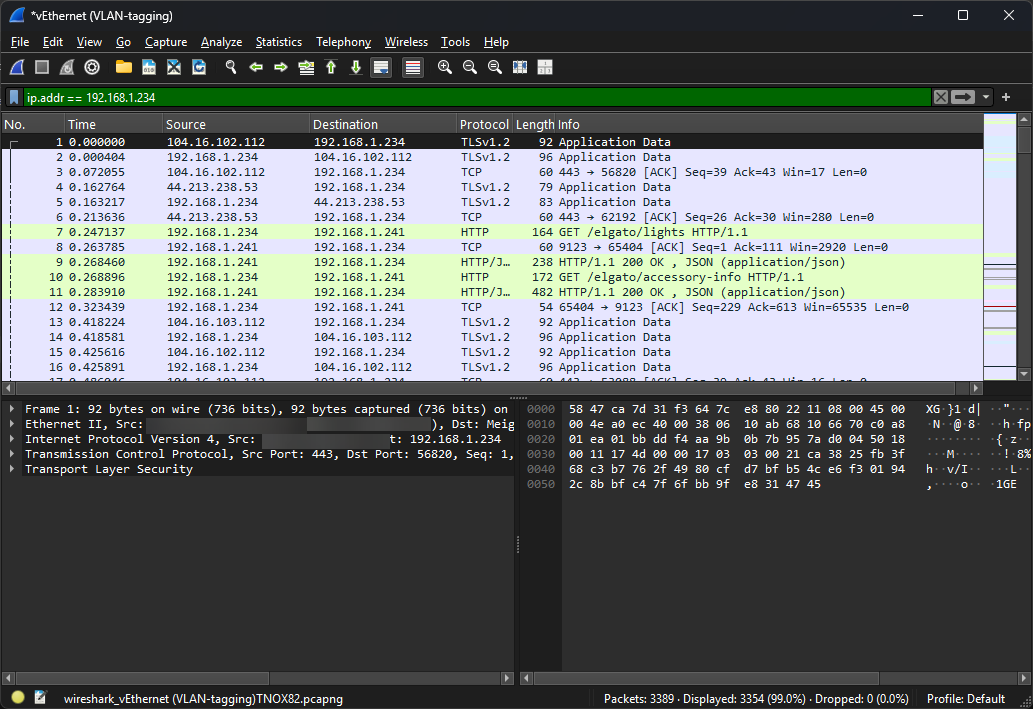
Display Filters that can be helpful in most cases
After you capture traffic, launch Wireshark’s display filter bar (green/red indicator). The following shortcuts flag 90 % of connectivity problems. Note the following:
| Goal | Display Filter |
|---|---|
| Show only retransmissions / out-of-order | tcp.analysis.flags |
| Isolate handshake packets | tcp.flags.syn == 1 |
| Highlight zero-window pauses | tcp.analysis.zero_window |
| Spot Path MTU black-holes | icmp.type == 3 and icmp.code == 4 |
Combine filters with logical AND/OR. For example you can find out-of-order segments from a database host:
ip.addr == 10.0.0.50 && tcp.analysis.out_of_order5. Common patterns you can use
I have compiled a list of a few common troubleshooting scenarios and common issues that Wireshark can help with.
a. DHCP Handshake Fails on a New VLAN
- Capture filter:
udp port 67 or udp port 68 - Display clue: Client broadcasts a DISCOVER; no OFFER returns
- Likely fix: Add the VLAN to your DHCP helper or trunk
b. TLS Handshake Timeout
- Capture filter:
tcp port 443 and host server.mydomain.com - Display clue: Client Hello appears but server never replies
- Likely fix: Blocked port on a path ACL, or mismatched cipher suites
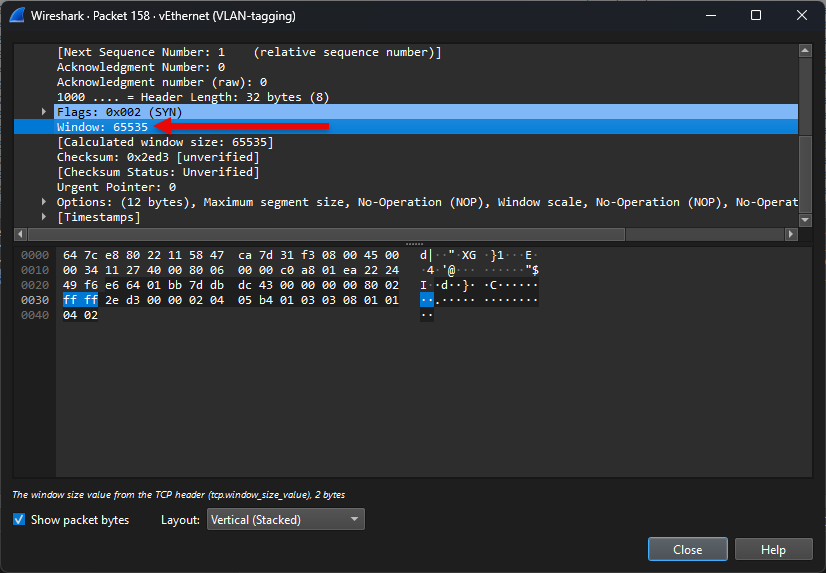
c. SQL Query Takes Minutes
- Capture filter:
host sql.lab.local and tcp - Display clue: SYN-ACK missing Window-Scale; receive window stuck at 65 535 B and there may be periodic keep-alive ACKs
- Likely fix: Firewall stripping TCP options; disable inspection or enable option passthrough
d. File Copy Slow over Wi-Fi but Fast on Cable
- Capture filter:
host nas.home and tcp port 445 - Display clue: Hundreds of Wi-Fi retransmissions and ACK timeouts?
- Likely fix: Poor signal or hidden interference may be in play
Advanced diagnostics with Wireshark
You can use Wireshark with advanced diagnostics to troubleshoot network issues.
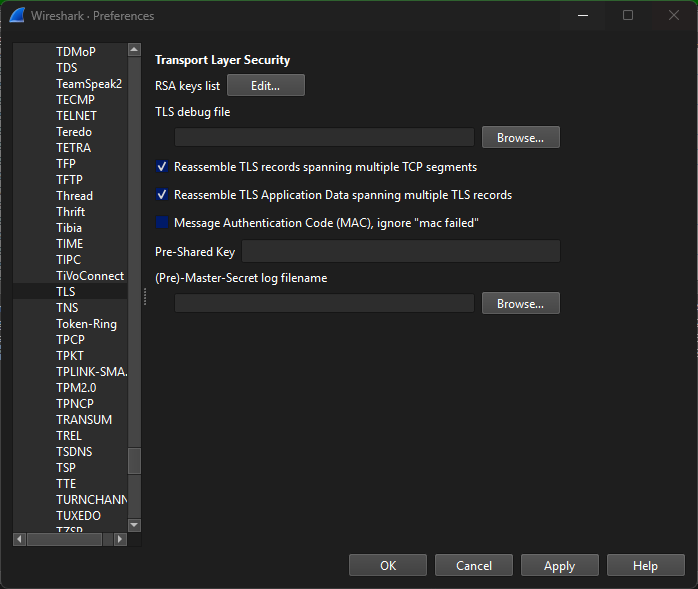
Decrypt TLS
If you control the server, export its private key or use a pre-master secret log with browsers that support SSLKEYLOGFILE. Load the key into Wireshark (Preferences → Protocols → TLS) and suddenly the encrypted HTTP/2 stream becomes readable JSON. This can be absolutely gold for debugging API errors.
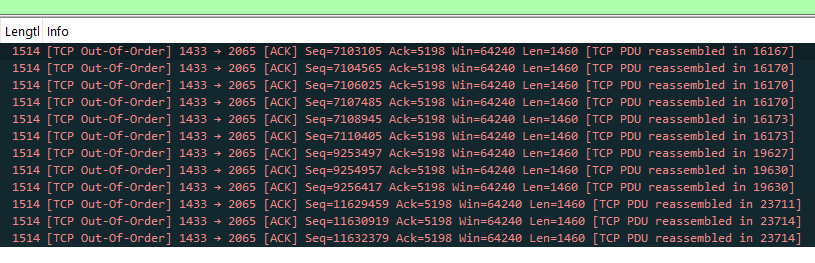
Detect MTU problems or reassembly in site-to-site VPN tunnels
Filter on icmp.code == 4; Wireshark flags “Fragmentation Needed” messages. If those never arrive but you see TCP retransmissions with smaller MSS values, path MTU discovery is probably blocked by a firewall.
To check for reassembly and out of order:
ip.addr == 192.168.1.1 && tcp.analysis.out_of_order
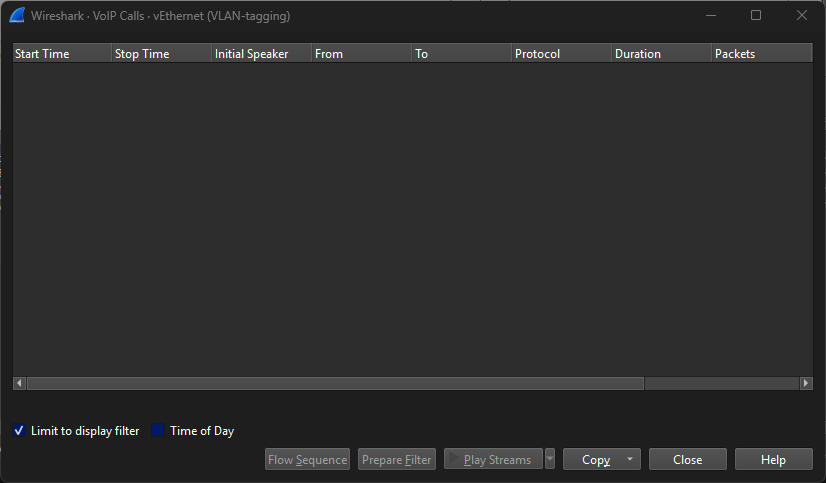
Follow a VoIP call end-to-end
Use Telephony → VoIP Calls; Wireshark identifies SIP dialogs, extracts the RTP streams, and even plays back audio—useful for one-way-audio complaints.
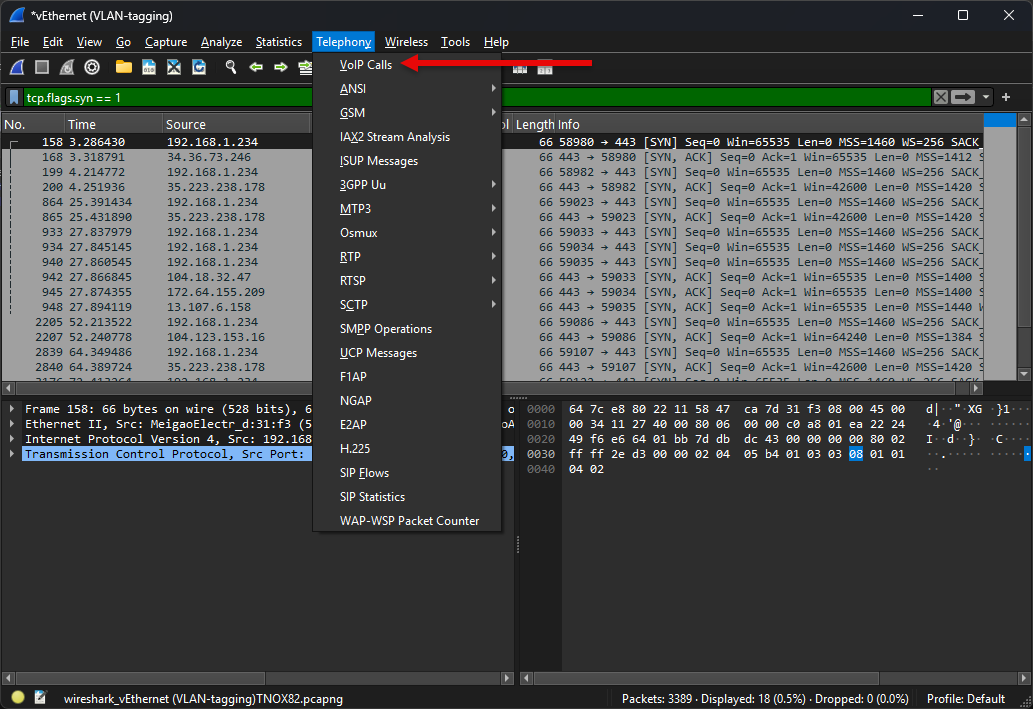
VOIP calls will display in the monitor.
Automation Tips for Repeat Offenders
Automating packet captures is a great way to reduce the heavy lifting. You can initiate rollover captures, only grab headers, and also capture for a specific amount of time at certain intervals.
- Ring Buffers with tshark:
tshark -i eth0 -b filesize:100000 -b files:20 -w /var/captures/voip.pcap
Keeps the last 2 GB of VoIP traffic on disk, rolling over automatically. - Packet Slicing on Busy Links:
tcpdump -s 128grabs only headers, letting you keep legal compliance and performance. - Scheduled Captures for Intermittent Bugs:
Use cron (Linux) or Task Scheduler (Windows) to run tcpdump for 60 s every 10 minutes, generating timestamps in filenames so you can match user reports later.
Wrapping Up
If you truly want to geek out on network traffic and get into the deep weeds of troubleshooting, Wireshark is an absolute blast to work with. It can be intimidating at first. However, with the quick capture and display filters we have covered, you can get meaningful troubleshooting and discovery data in no time.
My tip is this. Keep Wireshark installed on your daily driver at home and on a jump box in production. When “it’s slow” lands in your inbox, you’ll have the means to capture and prove what is going on, within a single session. This can literally save you hours.
Mastering Wireshark takes practice, but even a basic grasp of capture and display filters will lead to an immediate payoff. Start small. Capture things like the DHCP handshake on your home network. Then trace a TLS session. Soon you’ll feel comfortable diving into SYNs, ACKs, and TCP options. Let me know how you are using Wireshark in your home lab or production today.
Google is updating how articles are shown. Don’t miss our leading home lab and tech content, written by humans, by setting Virtualization Howto as a preferred source.
About The Author