I am always on the lookout for great new open-source tools for monitoring and management in the home lab and in production environments. I am a huge fan of Uptime Kuma as a monitoring solution, and other tools like Prometheus and Grafana. However, not tool long ago I heard about a new open-source monitoring solution that is kind of a modern twist on Uptime Kuma and other functionality built-in. Let’s look at Checkmate monitoring for free open source monitoring.
What is Checkmate Monitoring?
What is Checkmate exactly? Checkmate is an open-source monitoring solution developed by BlueWave Labs. You can find their official Github repo here: Checkmate.
Checkmate is developed by BlueWave Labs. It is an uptime and infrastructure monitoring solution. The design of the solution is meant to be straightforward but still provide visibility into your services’ availability.
Also, it is built from the ground up with ease of deployment as one of its foundational characteristics. The solution is fully deployed using Docker containers. Checkmate runs seamlessly across many types of environments, including home labs, data centers, and cloud.
It is a lightweight solution for monitoring that doesn’t overwhelm users with excessive metrics or confusing dashboards. But it doesn’t underwhelm either. You clearly see the important information you need to see about system uptime, response status, and downtime events.
Key Features of Checkmate
Note the following key characteristics of Checkmate:
- Good User Interface – The develpers have built Checkmate with modern technologies in mind. The frontend uses React.js, which gives you a clean, intuitive, and responsive interface. This makes working with the web interface quick and easy.
- REST API: The backend API, built on Node.js and Express, provides comprehensive endpoints for automation, enabling integration with scripts, CI/CD pipelines, or infrastructure automation tools.
- Incident Tracking and Alerts: Checkmate tracks downtime incidents and response issues. It logs these for each time they happen, and it also lets you know when they recover. The historical view helps with post mortems and root cause troubleshooting.
- Webhook-Based Notifications: Checkmate’s webhook notification system integrates with popular messaging platforms like Slack, and Discord. You can even custom-build solutions, which enables immediate alerts whenever services experience issues.
- Docker Architecture: Its built on top of Docker which makes it super easy to spin up and use.
Deploying Checkmate with Docker Compose
Below is an example Docker Compose configuration to deploy Checkmate. Save the configuration into a docker-compose.yml file on your Docker host. You will want to replace the example API base URL below with the URL you want to use in your environment.
version: '3.8'

services:
  client:
    image: bluewaveuptime/uptime_client:latest
    restart: always
    environment:
      UPTIME_APP_API_BASE_URL: "http://cldockertest:5000/api/v1"
    ports:
      - "80:80"
      - "443:443"
    depends_on:
      - server

  server:
    image: bluewaveuptime/uptime_server:latest
    restart: always
    ports:
      - "5000:5000"
    depends_on:
      - redis
      - mongodb
    environment:
      - DB_CONNECTION_STRING=mongodb://mongodb:27017/uptime_db
      - REDIS_HOST=redis
      - PAGESPEED_API_KEY=YOUR_API_KEY

  redis:
    image: bluewaveuptime/uptime_redis:latest
    restart: always
    ports:
      - "6379:6379"
    volumes:
      - ./redis/data:/data
    healthcheck:
      test: ["CMD", "redis-cli", "ping"]
      interval: 30s
      timeout: 10s
      retries: 5
      start_period: 5s

  mongodb:
    image: bluewaveuptime/uptime_database_mongo:latest
    restart: always
    volumes:
      - ./mongo/data:/data/db
    command: ["mongod", "--quiet"]
    ports:
      - "27017:27017"
After creating this file, run the following command in the directory containing your Docker Compose file:
docker compose up -d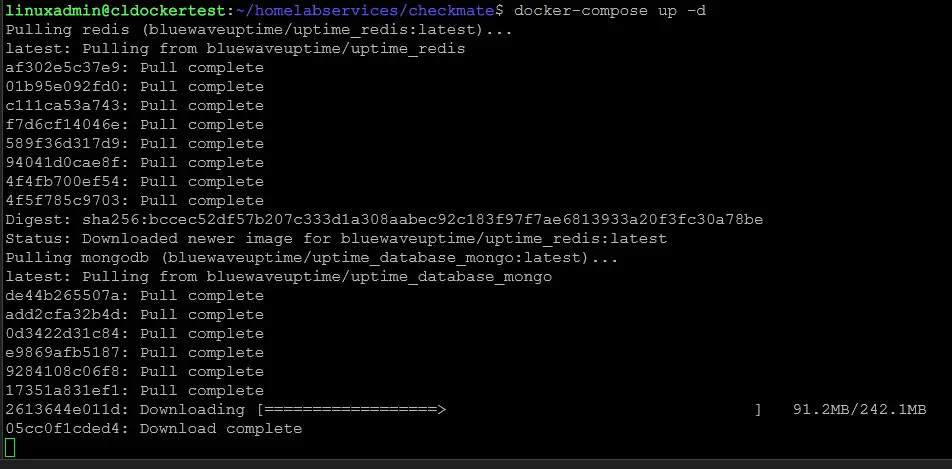
This command will pull all required Docker images, configure the PostgreSQL database, and then it will initialize the backend. It will also set up the Checkmate frontend web interface.
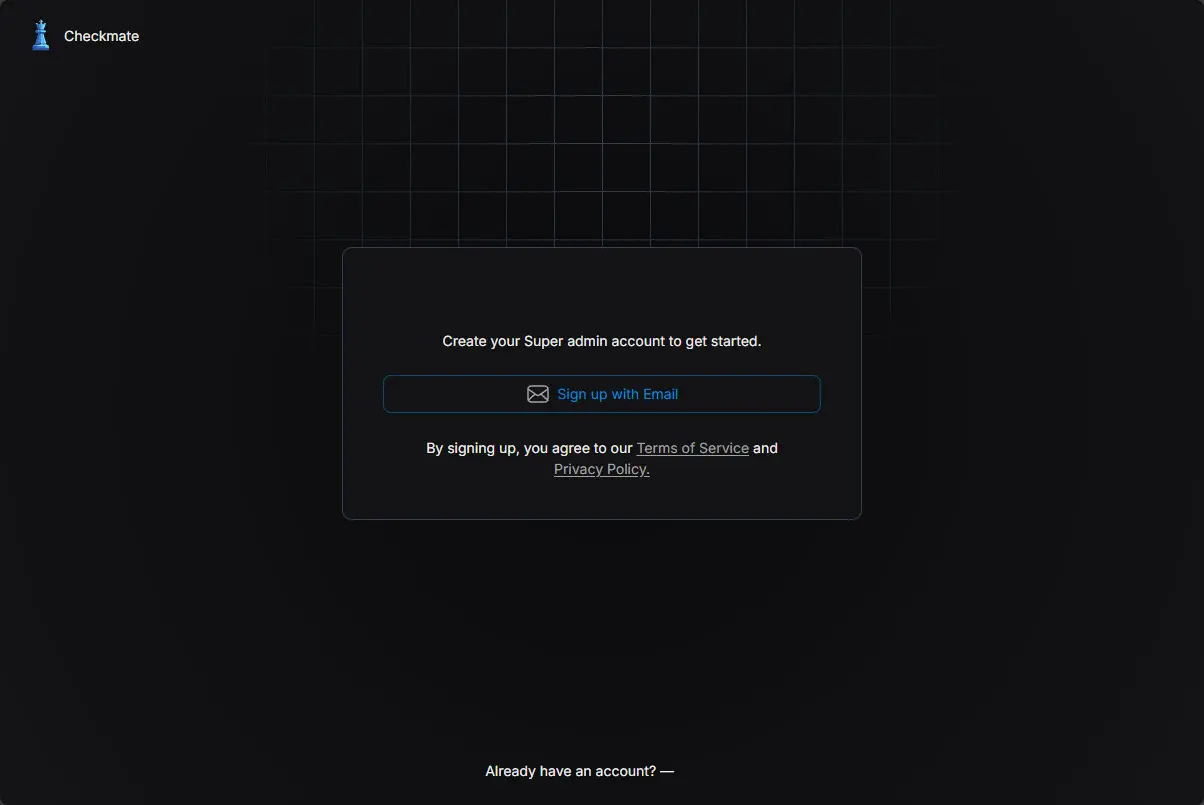
Signing up with your email
Click the Sign up with email button.
Next, enter your real email address. Yes this is required. You can’t put in a dummy email address as it will fail after you sign up. Below is just a placeholder address for getting a screenshot.
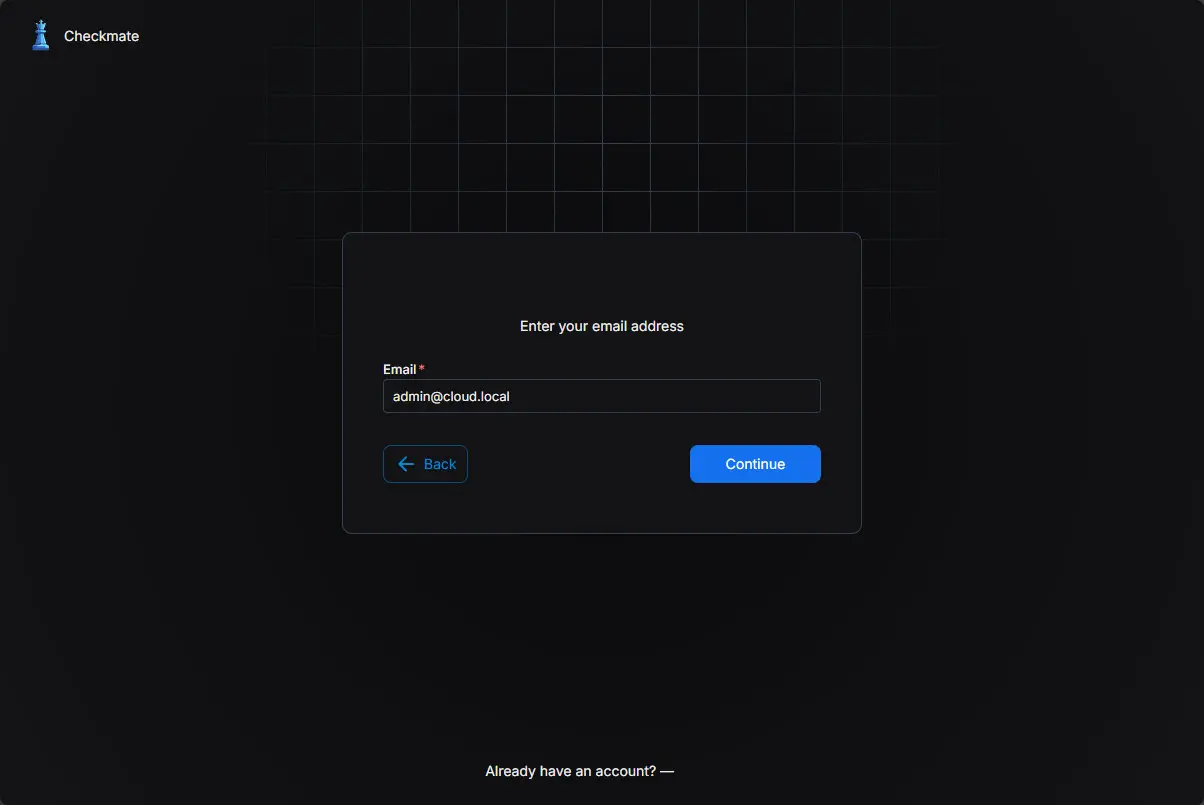
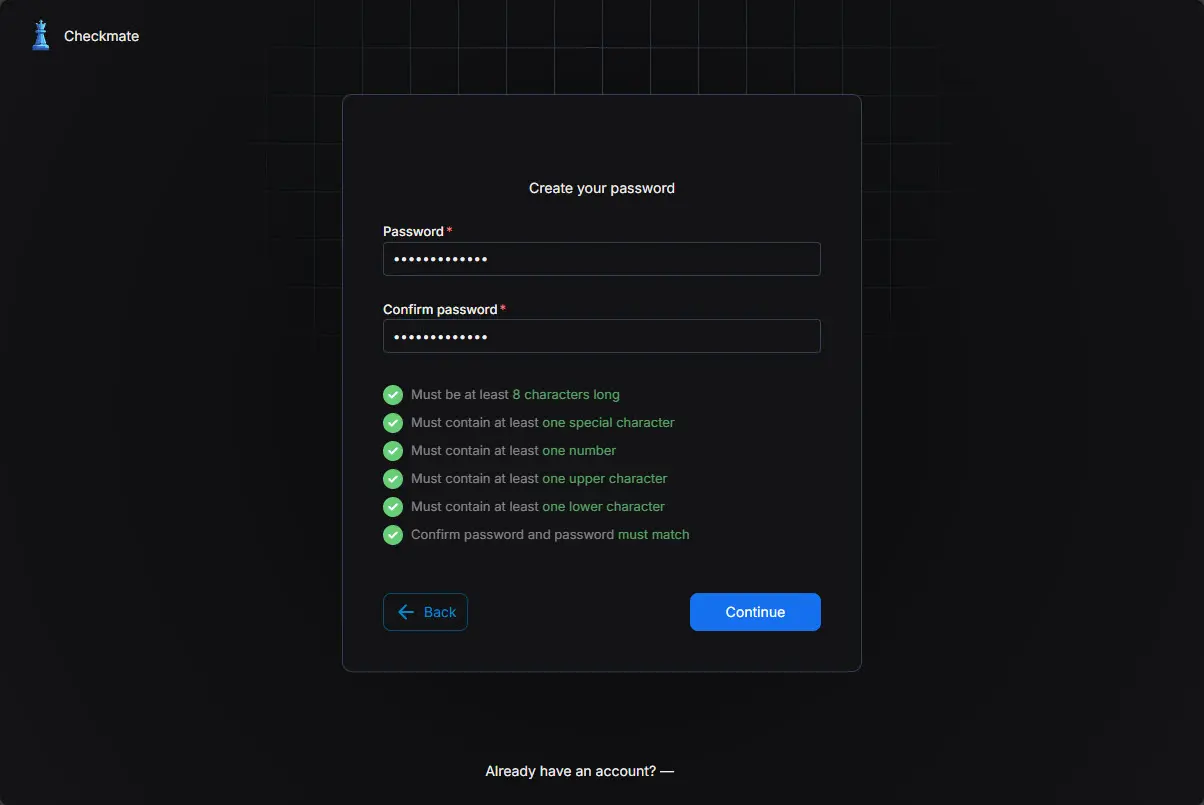
Next, it will allow you to create the password.
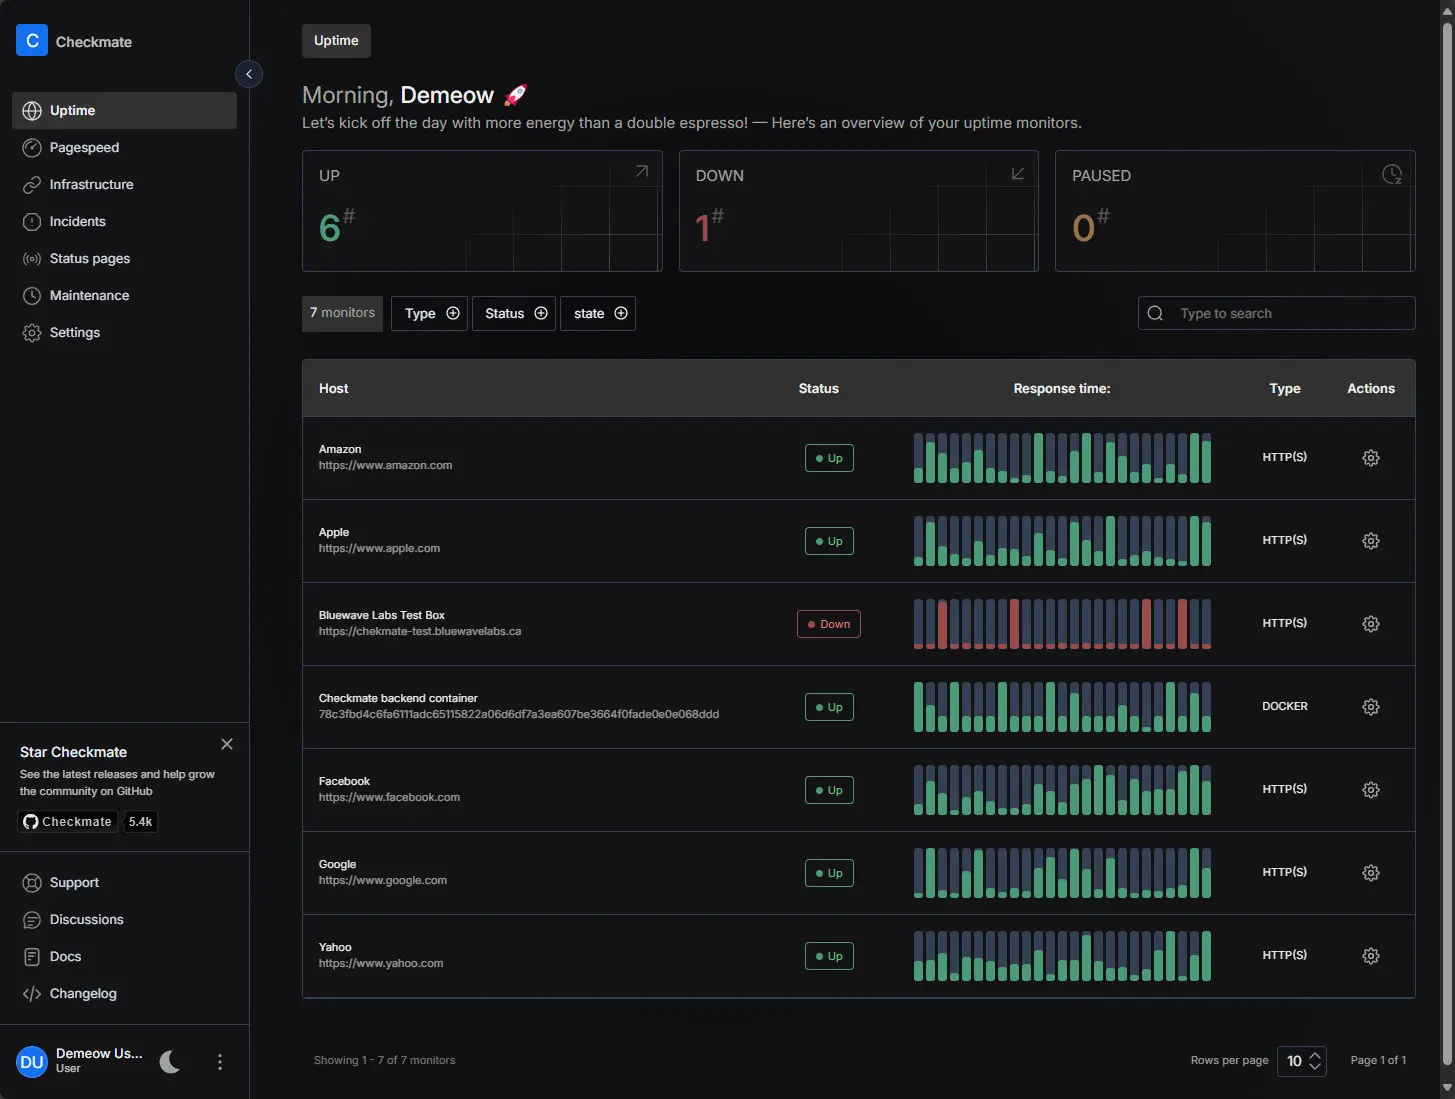
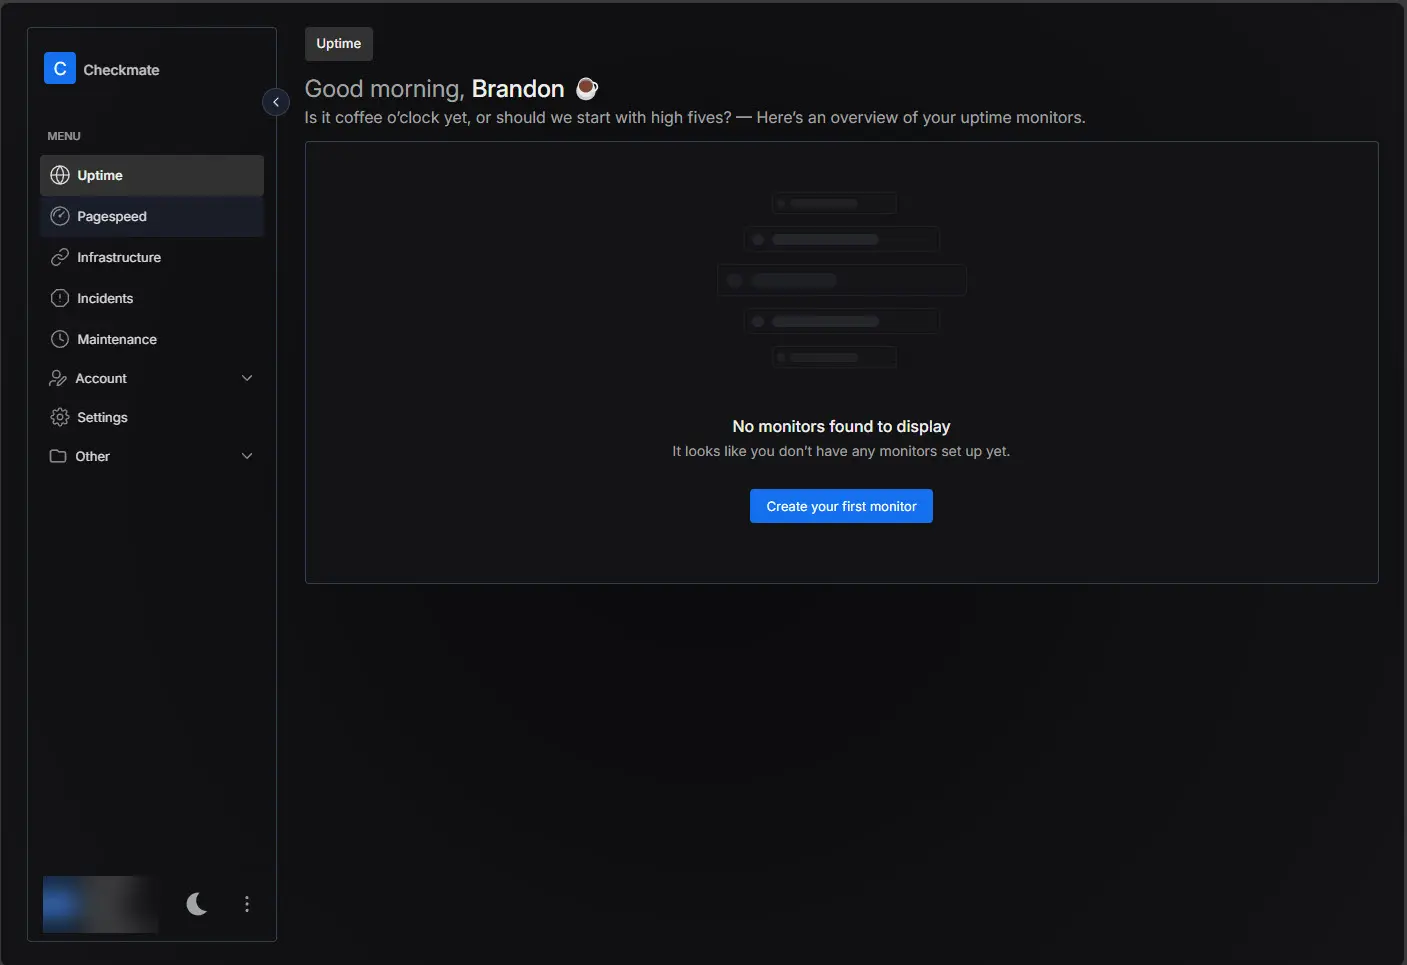
After you login with the newly created credentials, you will see the dashboard that looks like the following.
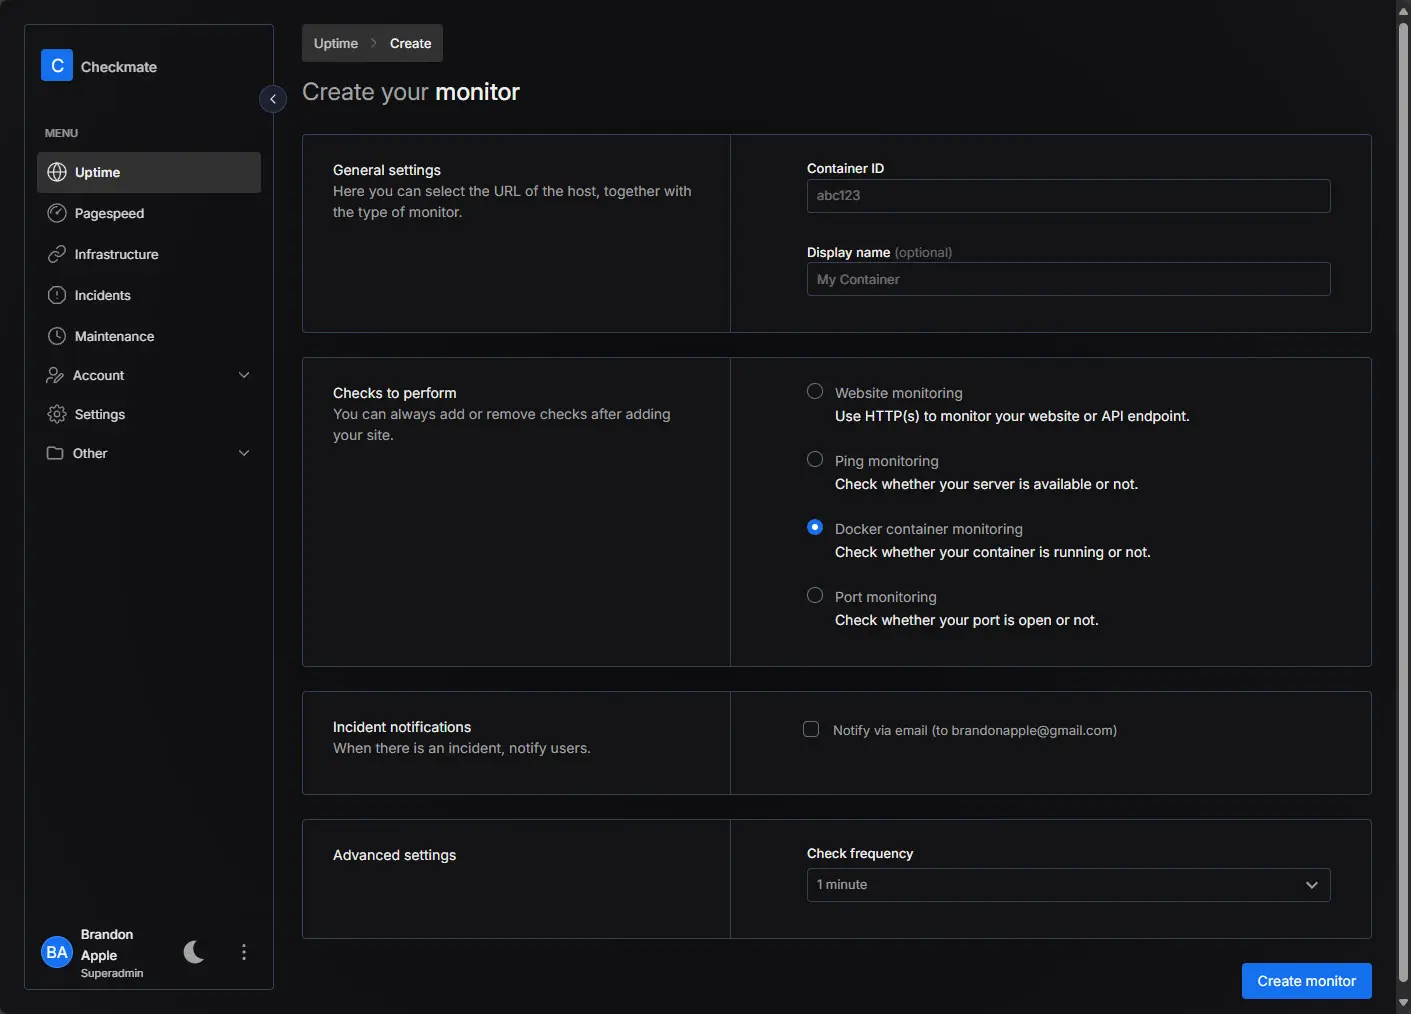
Configuring Checkmate Monitors
You can then create new monitors by choosing:
- Website monitoring
- Ping monitoring
- Docker container monitoring
- Port monitoring
Each monitor provides real-time status updates, historical downtime tracking, and customizable settings.
For example, configuring a monitor for a simple web service includes setting the target URL and the expected HTTP status (usually 200 OK). Checkmate will initiate HTTP checks and logs successes and failures. This will immediately trigger a notification through your configured webhook if you have this setup.
Below is a screenshot of the demo environment that Checkmate has up and running just as an example of what a fully populated dashboard might look like.

Integrating notifications and webhooks
Checkmate leverages webhook technology for notifications, allowing simple integration with numerous messaging and automation platforms. For instance, if you use Slack or Discord, creating a notification webhook is straightforward:
- Create an incoming webhook in your messaging app.
- Copy the webhook URL.
- Configure Checkmate to send alerts to this webhook.
Whenever an issue arises, Checkmate instantly sends a notification, ensuring you’re informed without delay.
Automation and REST API
Checkmate has a REST API endpoint that allows retrieving monitors, and incidents. You can also configure notification settings using the REST API. This is great for automation and provisioning monitors automatically..
You can use automation tools like Terraform, Ansible, or custom scripts to create, modify, or delete monitors automatically based on your infrastructure provisioning workflows.
Maintaining and updating Checkpoint
One thing I love about Docker is the ease of maintenance and updates. Running the following commands fetches the latest container images and applies updates without losing existing configurations or historical data:
docker compose pull
docker compose up -d
Practical Use Cases for Checkmate
Checkmate is versatile, making it an excellent fit for numerous use cases:
- Home Labs: for most reading this, this is one of the most popular use cases
- Small Businesses: small businesses can also benefit with internal APIs, and SaaS integrations.
- Development Teams: Integrate Checkmate with continuous deployment pipelines
- Managed Services: System integrators can centrally monitor client infrastructure and services and configure alerts and notifications.
Wrapping up
I think Checkmate is a great solution for monitoring for those that are already used to Uptime Kuma and similar uptime monitoring solutions. It provides a fresh new look over something like Uptime Kuma and has some neat features compared to that as well. Most with home labs will appreciate what it can do for your environment. Let me know in the comments if you have already stood up Checkmate in your environment.
https://github.com/bluewave-labs/checkmate
Google is updating how articles are shown. Don’t miss our leading home lab and tech content, written by humans, by setting Virtualization Howto as a preferred source.
About The Author


They have some unique features like measuring wep page speed with google api but they have long way to go.
Onur,
Thank you for the comment! I agree. The features are fairly basic at this point, but definitely see the potential of the framework.
Brandon
I agree that it is beautiful and promising, but unfortunately not ready at all. My detailed uptime is plain wrong and every day I lose all my monitors and manually have to log out and back in again. I will continue to check back on them.
Hi Brandon,
Thanks for this ! I give it a try and it’s very interesting.
But I did,not find anything about the webhooks to link with Rocket.Chat per instance… Neither the ability to specify the expected HTTP status like you said.
Bruno