VMware Performance Impact of Meltdown and Spectre Patches
Update 3.20.2018 – VMware has released vSphere 6.5 U1G which has a newly released microcode update
Update 1.17.2018 – Firmware Updates and Initial Performance Data for Data Center Systems
Update 1.13.2018 – Due to recent Intel sighting VMware now recommending NOT to install the latest microcode patch – link below
Update 1.12.2018 – Added benchmark of patching ESXi with the latest microcode update first before guest OS patch
Update 1.11.2018 – Added specs, virtual hardware, and VM hardware version of the test virtual machine
I have been keenly interested in the performance implications of the Meltdown and Spectre patches on hypervisor systems. I dare say all of us cringed when hearing the “workarounds” would impact performance of our performance sensitive production systems. Numbers have been thrown around anywhere from 5-30% impact on performance. With the latest releases and information coming from VMware, I ran a test of OS patches, and then hypervisor patches to gauge VMware performance impact of Meltdown and Spectre patches. Below are the results of my findings that I ran through fairly quickly to determine various impacts.
Configuration for VMware Meltdown and Spectre Performance Tests
Below are the configuration parameters for the test environment used in testing various performance impacts with the patches, both from a guest operating system side and the ESXi hypervisor:
VMware ESXi Server:
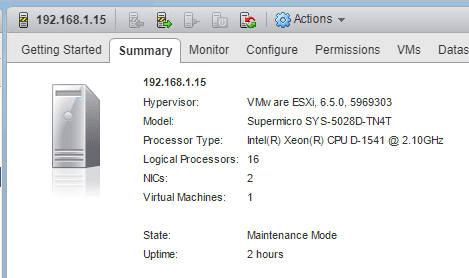
- Supermicro SYS-5028D-TN4T
- Intel(R) Xeon(R) CPU D-1541 @ 2.10GHz
- ESXi 6.5 Update 1 – version 5969303 (beginning test)
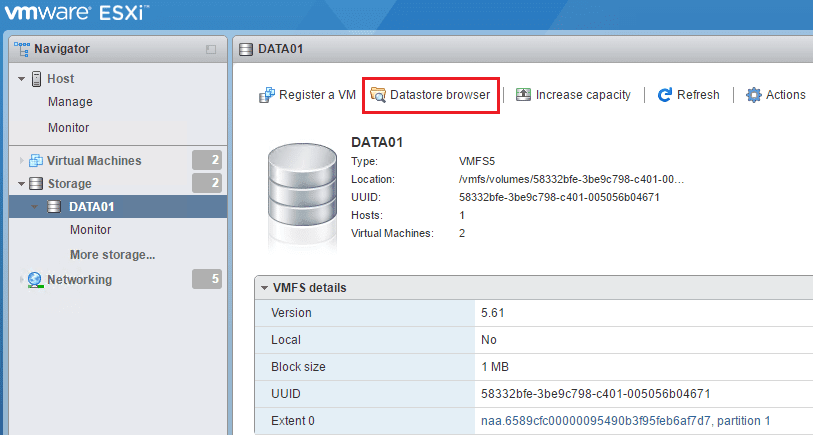
- Samsung 960 1 TB NVMe backed datastore
- No other VMs running
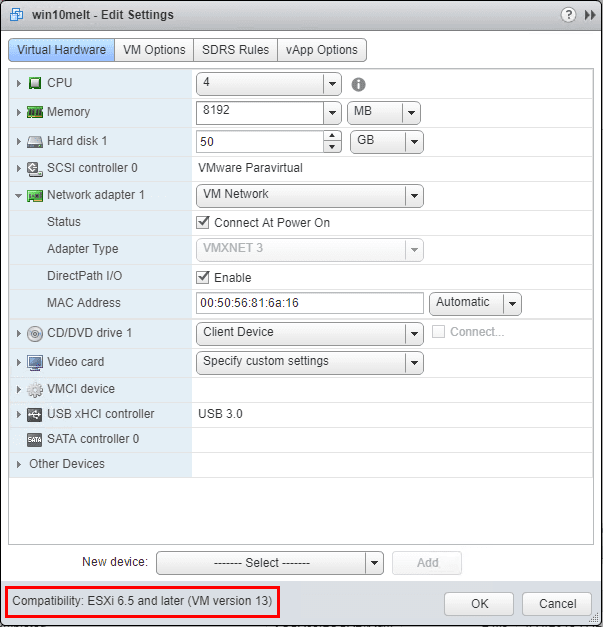
VMware Virtual Machine:
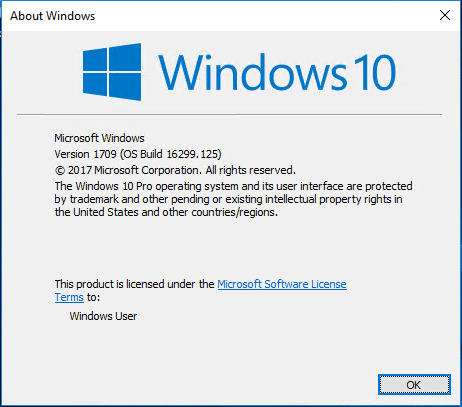
- Windows 10 Pro – 1709 (OS Build 16299.125) – beginning test
- (4) vCPUs assigned, 8 GB of RAM
- (1) single 50 GB hard drive
- Using ParaVirtual Storage controller
- (1) Network adapter (VMXNET3)
- VMware Compatibility version ESXi 6.5 (VM version 13)
The version I installed in the test virtual machine is dated Dec 2017.

VMware Performance Impact of Meltdown and Spectre Patches
Just as a sanity check I looked to make sure there were no patches installed. As you can see below, none are showing installed.

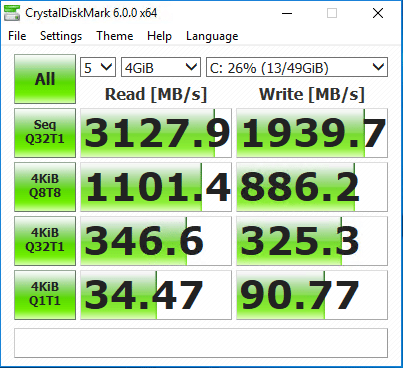
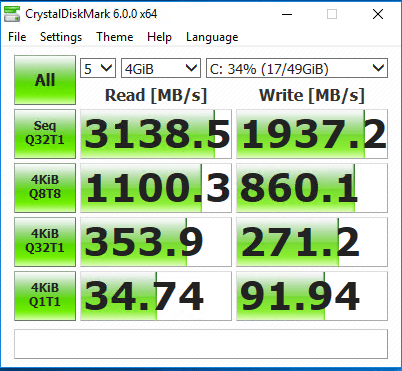
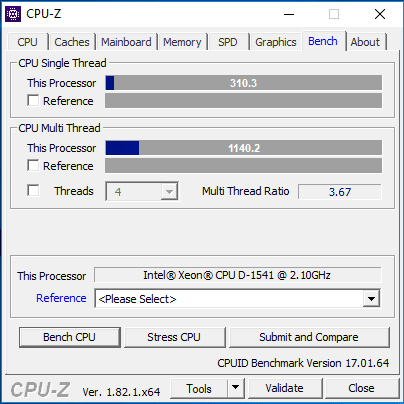
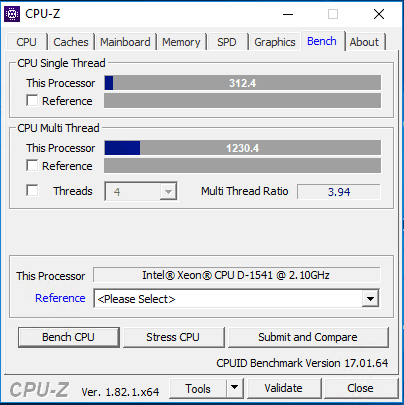
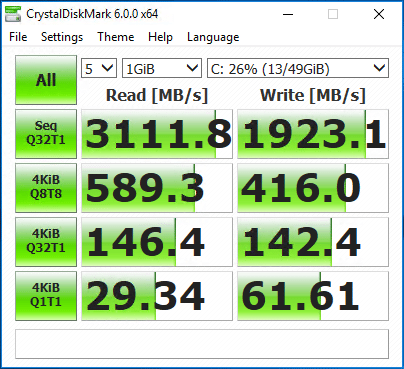
Just as a quick test of CPU and disk performance, I am using CPU-Z for a quick CPU benchmark and Crystal Disk Benchmark for disk benchmark statistics.
Before Applying the Microsoft Guest Operating System Patch
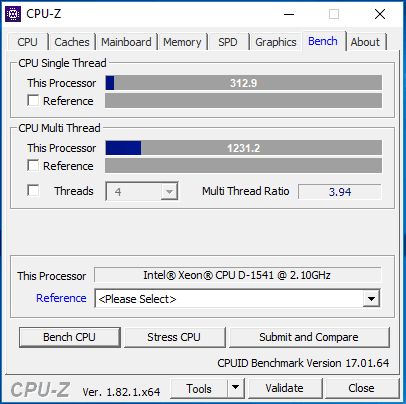
The following benchmarks are before applying the Microsoft 20118-01 Cumulative Update for Windows 10 Version 1709 for x64-based Systems.
After Applying the Microsoft Guest Operating System Patch
Ok so now I have numbers for my Windows 10 virtual machine before running the Microsoft security patch. Let’s apply the operating system patch and see what happens. This is only the guest operating system patch and not the VMware microcode patch.
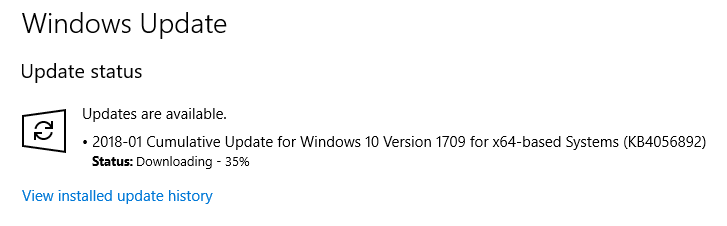
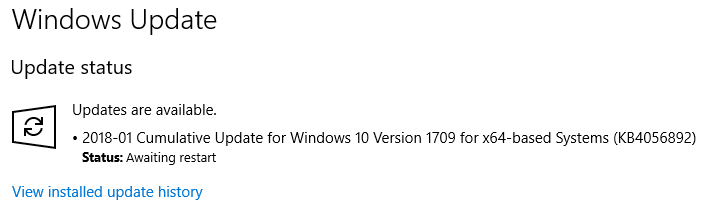
After a restart of the operating system, the following are the benchmark results after applying the guest operating system patch:
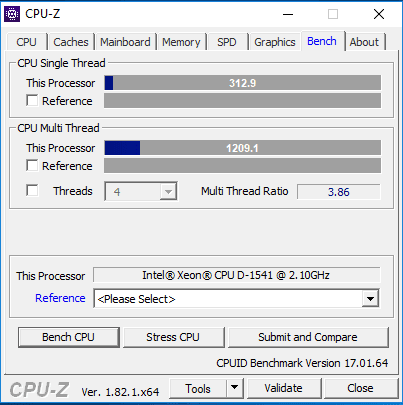
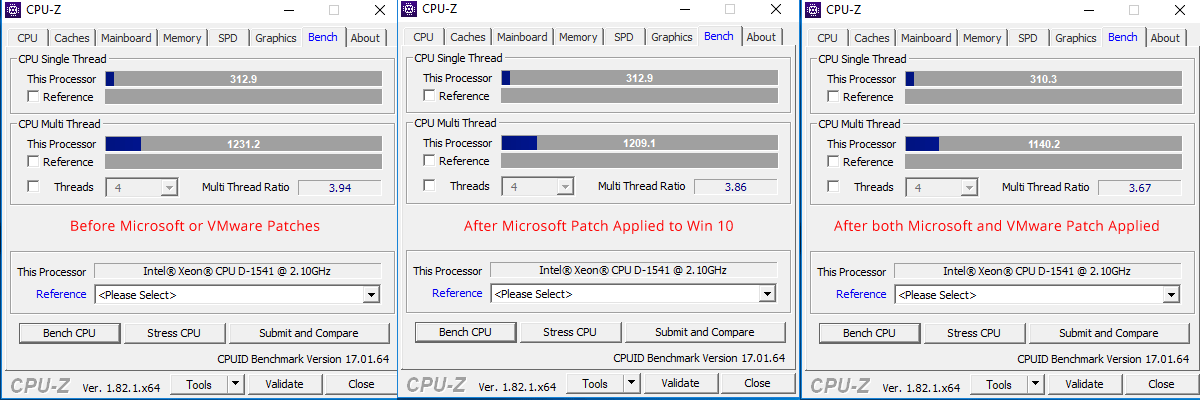
As shown above, the single thread performance was exactly the same. However, the multi thread performance has went down 1.79%.
The numbers above, while not wildly different are lower aside from the Seq Q32T1 bench on the read side. The other numbers are lower especially on the write side.
After Applying the VMware ESXi Meltdown and Spectre Microcode Patch
VMware has a really good KB found here detailing the vulnerabilities and the order of applying various updates. The VMware ESXi microcode updates implement at the hypervisor software layer what the BIOS update does also.
The below information is found here: https://kb.vmware.com/s/article/52085
Apply the Microcode/BIOS updates for CVE-2017-5715 in one of two ways:
- Apply the BIOS/Microcode update from your platform vendor.
OR - Apply one of the following ESXi patches to update the microcode for supported CPUs
- ESXi650-201801402-BG microcode *
- ESXi600-201801402-BG microcode *
- ESXi550-201801401-BG hypervisor and microcode **
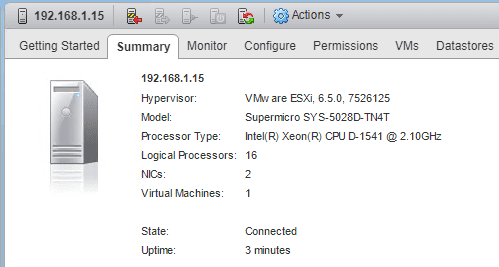
So I have applied the VMware updates per the KB article: https://kb.vmware.com/s/article/52200
Before Updating:
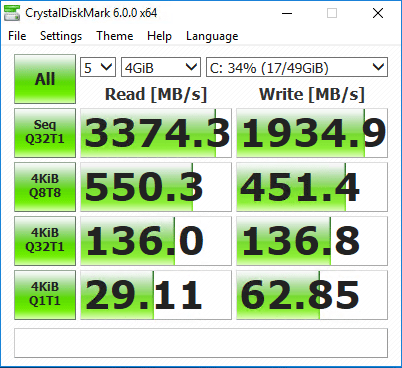
After Updating:
Here we can see a pretty dramatic decrease in the Multi Thread performance as it is a full 7.39% less performance.
Disk benchmarks are hit pretty hard as well when it comes to the Write MB/s performance.
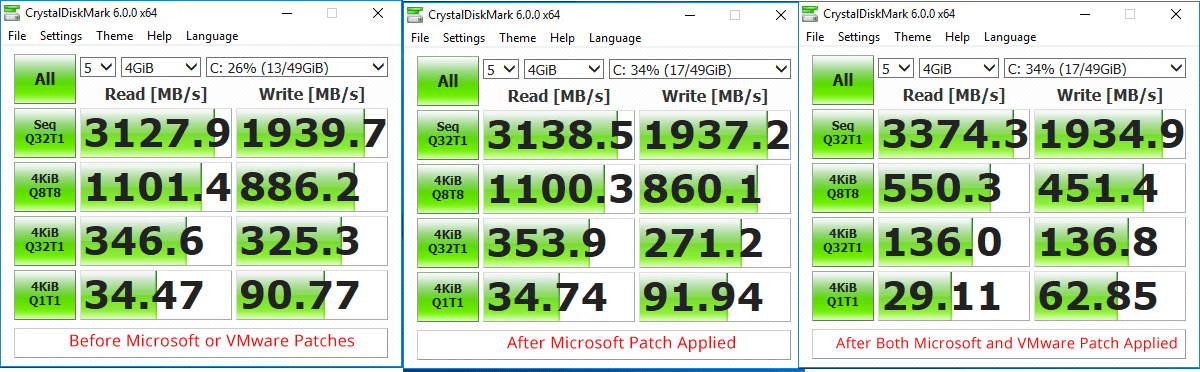
Comparison between CPU and Disk performance between Meltdown and Spectre Patches
Putting it all together, we see the following results in comparing the various Meltdown and Spectre patches and their effect on performance:
Update 1.12.2018 – Added benchmark of patching ESXi with the latest microcode update first before guest OS patch
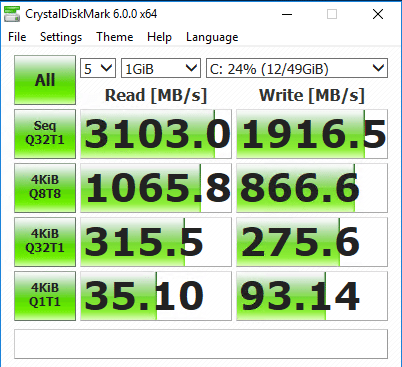
Now let’s run this benchmark test in the reverse order, I did not apply the Windows patch for Meltdown & Spectre. Instead, I simply fully patched the ESXi host up to the latest patch level including the microcode update from VMware and performance was in line with no patches installed.
With only the VMware microcode updates applied (ESXi version 7526125), the benchmark looked really good. Actually not much difference from the above benchmark with nothing applied.
Same with the disk benchmarks.
Now, to take the step further, we now want to apply the Microsoft Patch. Keep in mind, this is on the virtual machine running on an already fully patched ESXi host. In the following tests, it looks like it is the combination of the two patch installs that drastically affects performance. Note the results of both patches being applied, albeit in the opposite order. Below, we see the relative big hit in CPU performance.

Disk performance once again is pretty drastically affected on the write side especially.
The added conclusion here from the additional testing is that it appears it is the combination of the two patches. When each patch is applied individually, performance isn’t impacted too much. However, in either order of patch installation, once both are applied, we see the performance impact come to light.
Update 1.13.2018 – Due to recent Intel sighting VMware now recommending NOT to install the latest microcode patch – link below
Intel has made observations with Haswell and Broadwell CPUs that have led to them recommending VMware pull the current microcode patch. They will release a new microcode patch to replace the current patch released. See the official KB from VMware here: https://kb.vmware.com/s/article/52345
Update 1.17.2018 – Firmware Updates and Initial Performance Data for Data Center Systems
Intel has provided their findings on performance data on data center systems: https://newsroom.intel.com/news/firmware-updates-and-initial-performance-data-for-data-center-systems/
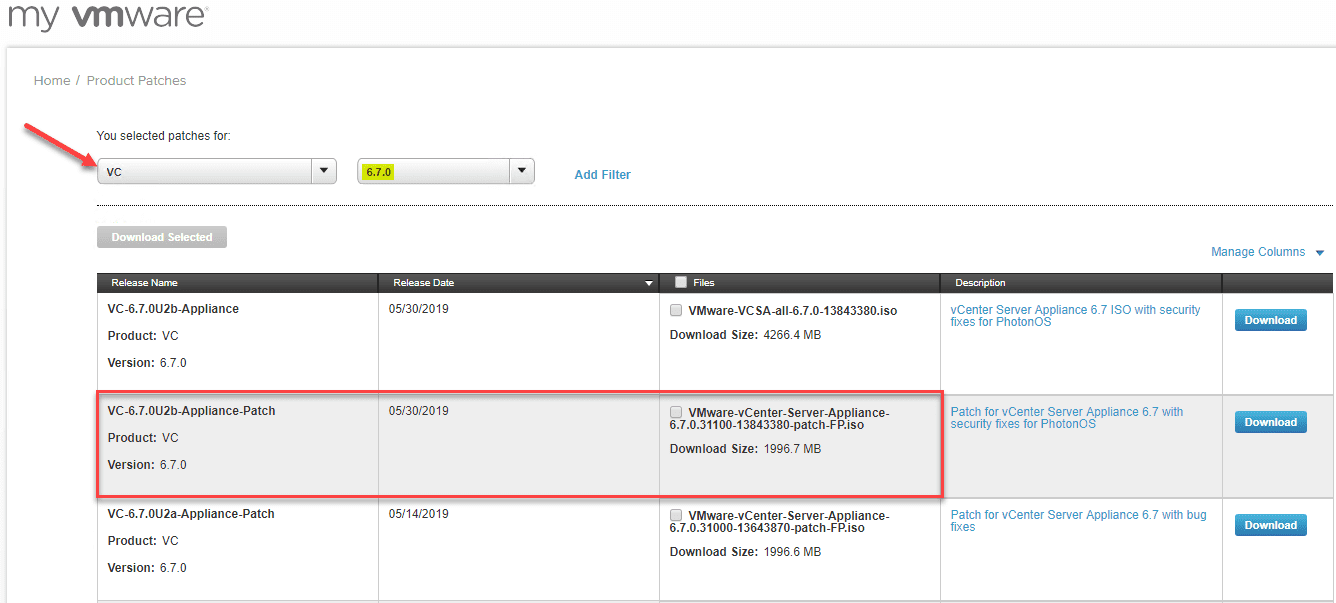
***Update 3.20.2018 – VMware has released vSphere 6.5 U1G which has a newly released microcode update***
VMware has officially released the new microcode update that is compatible with the processors initially found in the Intel sighting. The new release is vSphere 6.5 U1G. Read about the new updates here.
Concluding Thoughts
My testing above of VMware Performance Impact of Meltdown and Spectre Patches is quite telling. With each patch installed, I saw a performance hit. The cumulative impact is fairly dramatic as seen in my home lab testing. We are sure to see more tweaking and fallout from the various patches as has already been seen from the AMD side of things today.