Best Open Source Log Management Tools in 2023
When monitoring, troubleshooting, and auditing in today’s IT infrastructure, logs provide the low-level messaging needed to trace down events happening in the environment. They can be an invaluable source of insights into performance, security events, and errors that may be occurring across on-premises, cloud, and hybrid systems. You don’t have to buy into a commercial solution to get started logging. In fact, even many commercial offerings have a free and open-source variety you can use for logging in your environment. Let’s look at the best open-source log management tools in 2023 and see what tools you can use for log monitoring.
Table of contents
Overview of Open Source Log Management Solutions in 2023
Note the following open-source solutions we will look at for those looking for open-source log management tools for their environment.
Grafana, Loki, and Promtail: An integrated monitoring and visualization tool tailored for time-series data, offering real-time event detection and alerting capabilities.
Logstash: Part of the popular ELK Stack (Elasticsearch, Logstash, Kibana), Logstash is a data collection and log-parsing engine excelling at centralized logging and processing logs from various data sources.
Graylog: Designed for fast and comprehensive log data analysis, Graylog provides centralized log management with an intuitive user interface, built-in security measures, and extensive search capabilities.
Syslog-ng: A stalwart in the logging community, Syslog-ng delivers centralized logging with high compatibility across operating systems, making it a preferred choice for many system administrators.
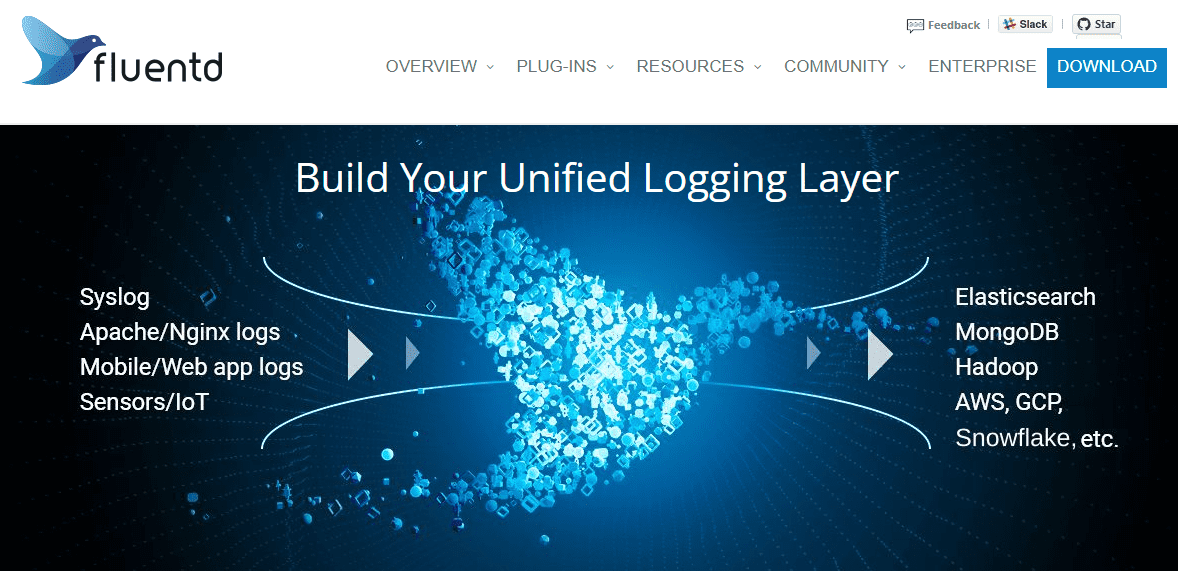
FluentD: Bridging the gap between data sources and desired destinations, FluentD is a universal data collector with a pluggable architecture, allowing integration with a vast ecosystem of plugins.
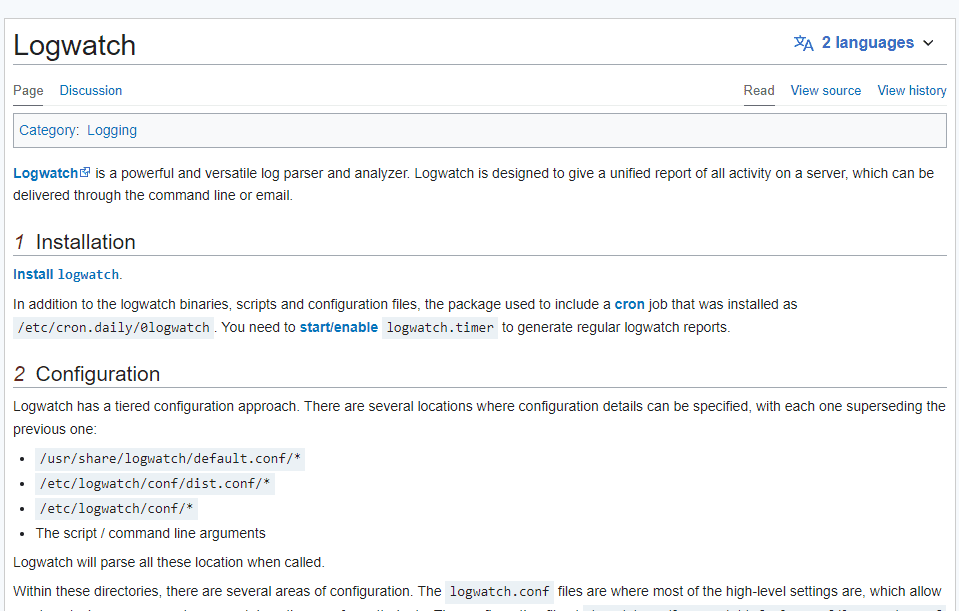
Logwatch: Prioritizing simplicity and efficiency, Logwatch is designed to provide straightforward log analysis, making it suitable for those who prefer a no-fuss approach to managing log data.
Each of these solutions brings its own set of strengths to log management. Depending on the users’ needs and infrastructure environments, one might better fit the others. Let’s consider each of these tools in more detail, including pros and cons of each.
Grafana, Loki, and Promtail
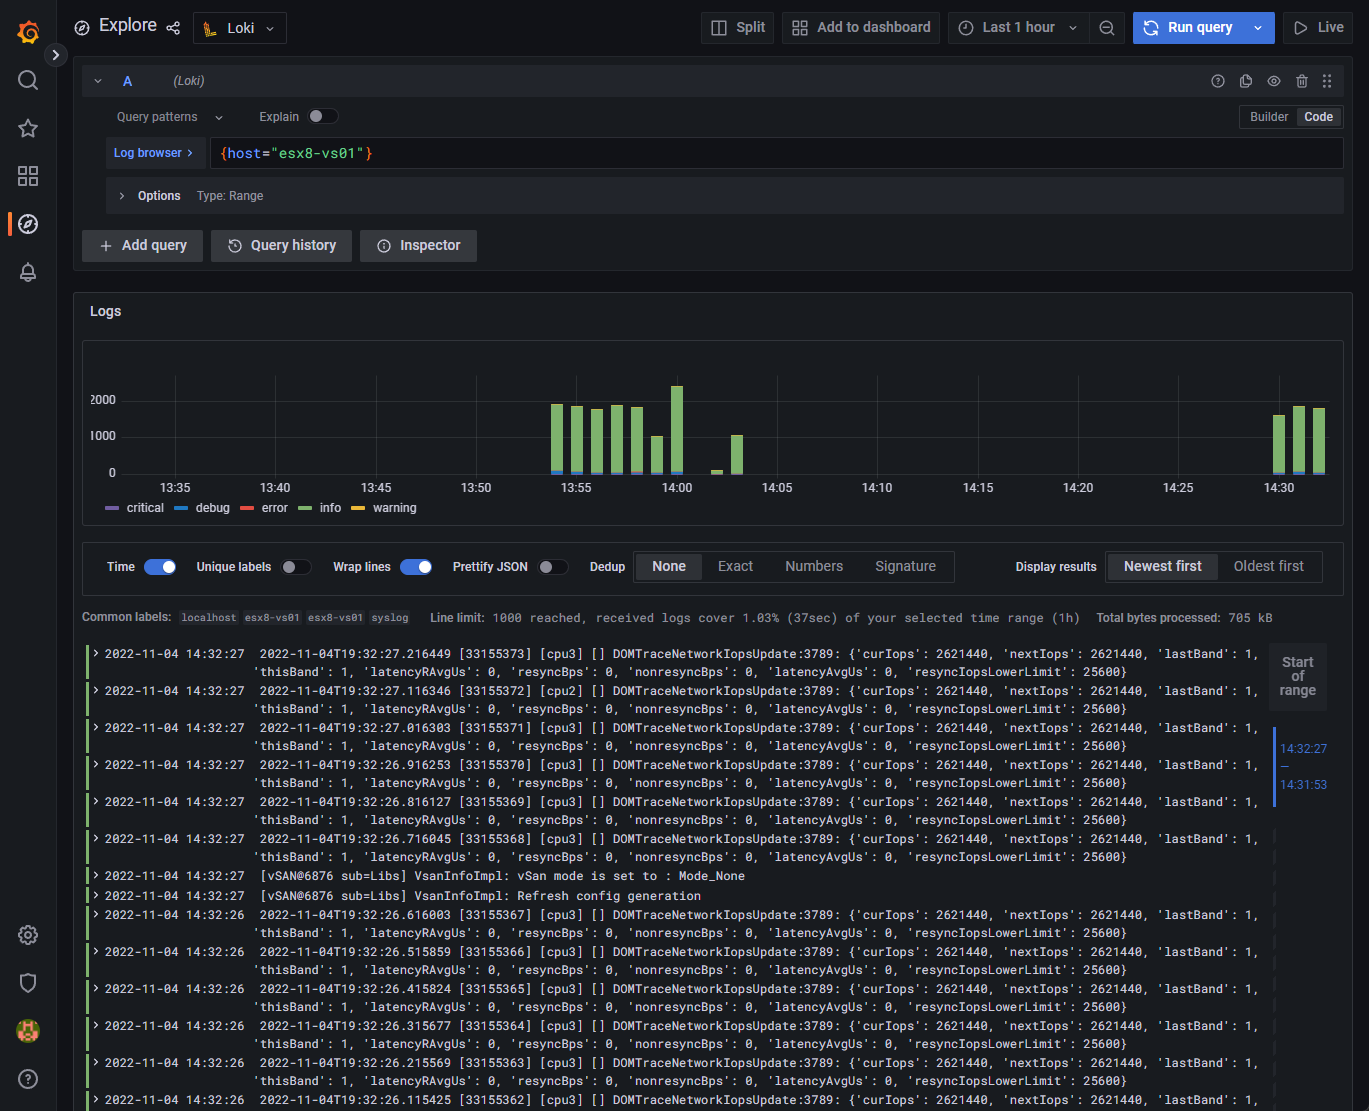
Grafana Loki is an open-source solution that enables sending logs in any format from your log sources and provides an easy and effective way to have logging in your environment. Note the following components:
- Grafana – grafana provides the really great visualizations for your logging solution
- Promtail – It pulls logs from many different sources, including systems journal GCP, AWS Cloudwatch, AWS EC2, EKS, Windows event logs, etc
- Loki – The Loki component processes the log feeds and presents these to Grafana for the visualizations using the Loki API push
Check out my write up on how to configure and setup Grafana Loki logging as a syslog server here: Grafana Loki Configuration Syslog Server for Home Labs.
Key Features:
Intuitive user interface facilitates seamless log data management.
Capable of handling logs from various data sources.
A unified logging layer for your various systems.
Pros:
Offers extensive search capabilities.
Seamless integration with multiple platforms like Linux servers and Windows hosts.
Real-time event detection.
Cons:
Initial setup might be daunting for smaller organizations.
Limited visualization options beyond pie charts and graphs.
GitHub – grafana/loki: Like Prometheus, but for logs.
Download Grafana | Grafana Labs
Releases · grafana/loki (github.com)
Logstash
As part of the ELK stack, Logstash runs alongside Elasticsearch, providing an analysis platform. It can process logs from web applications, operating systems, and even web servers, making it an open-source log collector that gets the job done.
Key Features:
Efficient log server system that centralizes logging from various destinations.
Integration with other tools for enhanced capabilities.
Special emphasis on security, safeguarding data transfers.
Pros:
Handles high volumes of log data without compromising on performance.
A cost-effective solution given its extensive features.
Offers flexibility in output destinations.
Cons:
Requires frequent updates to remain compatible with other systems in the ELK stack.
Can be resource-heavy, especially when dealing with large volumes of data.
Check out Logstash here: Logstash: Collect, Parse, Transform Logs | Elastic.
Graylog
Database administrators and software developers have often used Graylog. It can dive deep into logs with its analytics engine, and pull out the root cause of issues.
Key Features:
Expansive centralized log management system.
Extensive fault tolerance features ensuring high availability.
Supports various formats for comprehensive log analysis.
Pros:
User-friendly, catering to both seasoned users and beginners.
Offers cloud-native applications, enhancing its accessibility.
Advanced log collection capabilities.
Cons:
Requires external components, sometimes making the initial setup a bit cumbersome.
Might necessitate third-party tools for specific monitoring tasks.
Download and learn more about Graylog here: Graylog: Industry Leading Log Management & SIEM.
Syslog-ng
Syslog-ng is another solution that has been around quite a while. An integral part of many system administrators’ toolkits, Syslog-ng provides a framework for capturing logs from network devices, web servers, and other systems.
Key Features:
Centralized logging for multiple data sources.
In-built analytics engine to make sense of vast log data.
Log server capabilities to centralize log messages and system logs.
Pros:
High compatibility across multiple operating systems.
Handles large volumes of log data with ease.
Open-source nature makes it a cost-effective choice.
Cons:
Might seem complex for beginners due to multiple components.
Relatively fewer visualization tools compared to newer competitors.
Learn more about Syslog-ng here: syslog-ng – Log Management Solutions.
FluentD
FluentD is a name that many associate with log data integration. It acts as a bridge between data sources, ensuring logs flow from their origin to destinations, including databases, analytics platforms, and more.
Key Features:
Efficient log collection and data transfer mechanisms.
Integration capabilities with cloud services, ensuring centralized log management.
Facilitates data transfers between various platforms.
Pros:
Provides a unified logging layer for cloud-native applications.
Extensive community support for troubleshooting and additional plugins.
Built-in fault tolerance for uninterrupted data flows.
Cons:
Requires a steeper learning curve, especially for users new to log management.
Might necessitate additional plugins for specific use-cases, leading to increased complexity.
Check out FluentD here: Fluentd | Open Source Data Collector | Unified Logging Layer.
Logwatch
Logwatch is designed with simplicity at its core, providing users with straightforward log analysis tools that pinpoint issues and provide actionable insights. It can be pulled down from most Linux distro repos.
Key Features:
A straightforward interface that prioritizes ease of use.
Efficiently processes log files, including server logs and application logs.
Provides real-time event detection and alerting capabilities.
Pros:
Suitable for smaller organizations due to its straightforward setup.
The lightweight design ensures low resource consumption.
Offers high compatibility from Linux servers to Windows hosts.
Cons:
May lack some advanced features present in comprehensive log management tools.
Limited extensibility due to its focus on simplicity.
Each tool, regardless of its age or the size of its user base, brings something unique to the table. From the expansive capabilities of Syslog-ng to the user-friendly nature of Logwatch, the landscape of open-source log management is as diverse as ever. It provides system administrators, software developers, and database administrators with a comprehensive toolkit to ensure data is collected and utilized effectively.
Wrapping up
Open-source log management tools are a great way to have visibility into your environment and do so using free and open-source tools. You may have used other great solutions other than the tools included on the list. Let me know in the comments if there is a tool you would highly recommend using for log management in the environment.

Bullshit about grafana stack. Prometheus is for metrics. Loki for logs. So this should have been reflected for this topic.
Also it has rich visualization options. It’s just a bit tricky to use them right sometimes