


Every once in a while I come across an open source project that immediately makes me stop what I’m doing and spin up a test container in the home lab. DockScope was one of those projects. This was a project that I stumbled across with my normal Reddit doomscrolling. At first glance I just assumed it was mostly just another dashboard or visualization too with a 3D map. But after digging into it a bit more, there is actually more going on underneath the hood that is actually pretty cool. Let’s take a look at this new project and how it might fit into your home lab.
What is DockScope?
DockScope is an open source Docker dashboard that has as its purpose the ability to help you understand and manage your Docker environment in a visual way. So if you are much more a visual learner and understand things better this way, it can definitely add a LOT to your everyday docker management. DockScope builds an interactive map of your Docker environment and analyzes the running docker containers. But it also shows you a visual representation of the relationships between things like:
- Docker Compose projects
- Containers
- Networks
- Dependencies
- Container health
- Resource utilization
The cool thing is this as well. As your containers start, stop, and restart, the visualization updates in real-time. But also, not only that, if there is a change in the health state, it updates also. I think this 3D visualization is definitely the first thing you will notice. But honestly, it may not be the project’s biggest strength. It has other cool but also helpful features.
Like:
- Anomaly Detection – It can give CPU/memory spike flagging using IQR-based outlier detection. It has a pulsing indicator on graph nodes, toast notification, and dismissible sidebar alert
- Crash Diagnostics – If you have a container that dies, Dockscope analyzes the exit code, OOM status, and last log lines to give you the cause of the crash
- Dependency Impact View – It has an “impact” mode that gives you a view of everything that would break if a specific container goes down
Installing DockScope
The install process is super straight forward. Below is the docker compose code that I used to get this up and running in my environment. Now, similar to other solutions like Portainer and others that require Docker socket access, Dockscope needs this as well to give you visibility to the containers running in the environment. This is a call out of something to note from a security perspective.
You can also run this in a Proxmox LXC container or virtual machine and install it using npm. Check out the GitHub repo for those instructions.
A typical deployment using Docker Compose looks something like this:
services:
  dockscope:
    image: ghcr.io/manuelr-t/dockscope:latest
    container_name: dockscope
    ports:
      - "4681:4681"
    volumes:
      - /var/run/docker.sock:/var/run/docker.sock
    restart: unless-stopped
    pull_policy: always
Once the container starts, you simply open the web interface and DockScope begins discovering your existing Docker environment automatically.
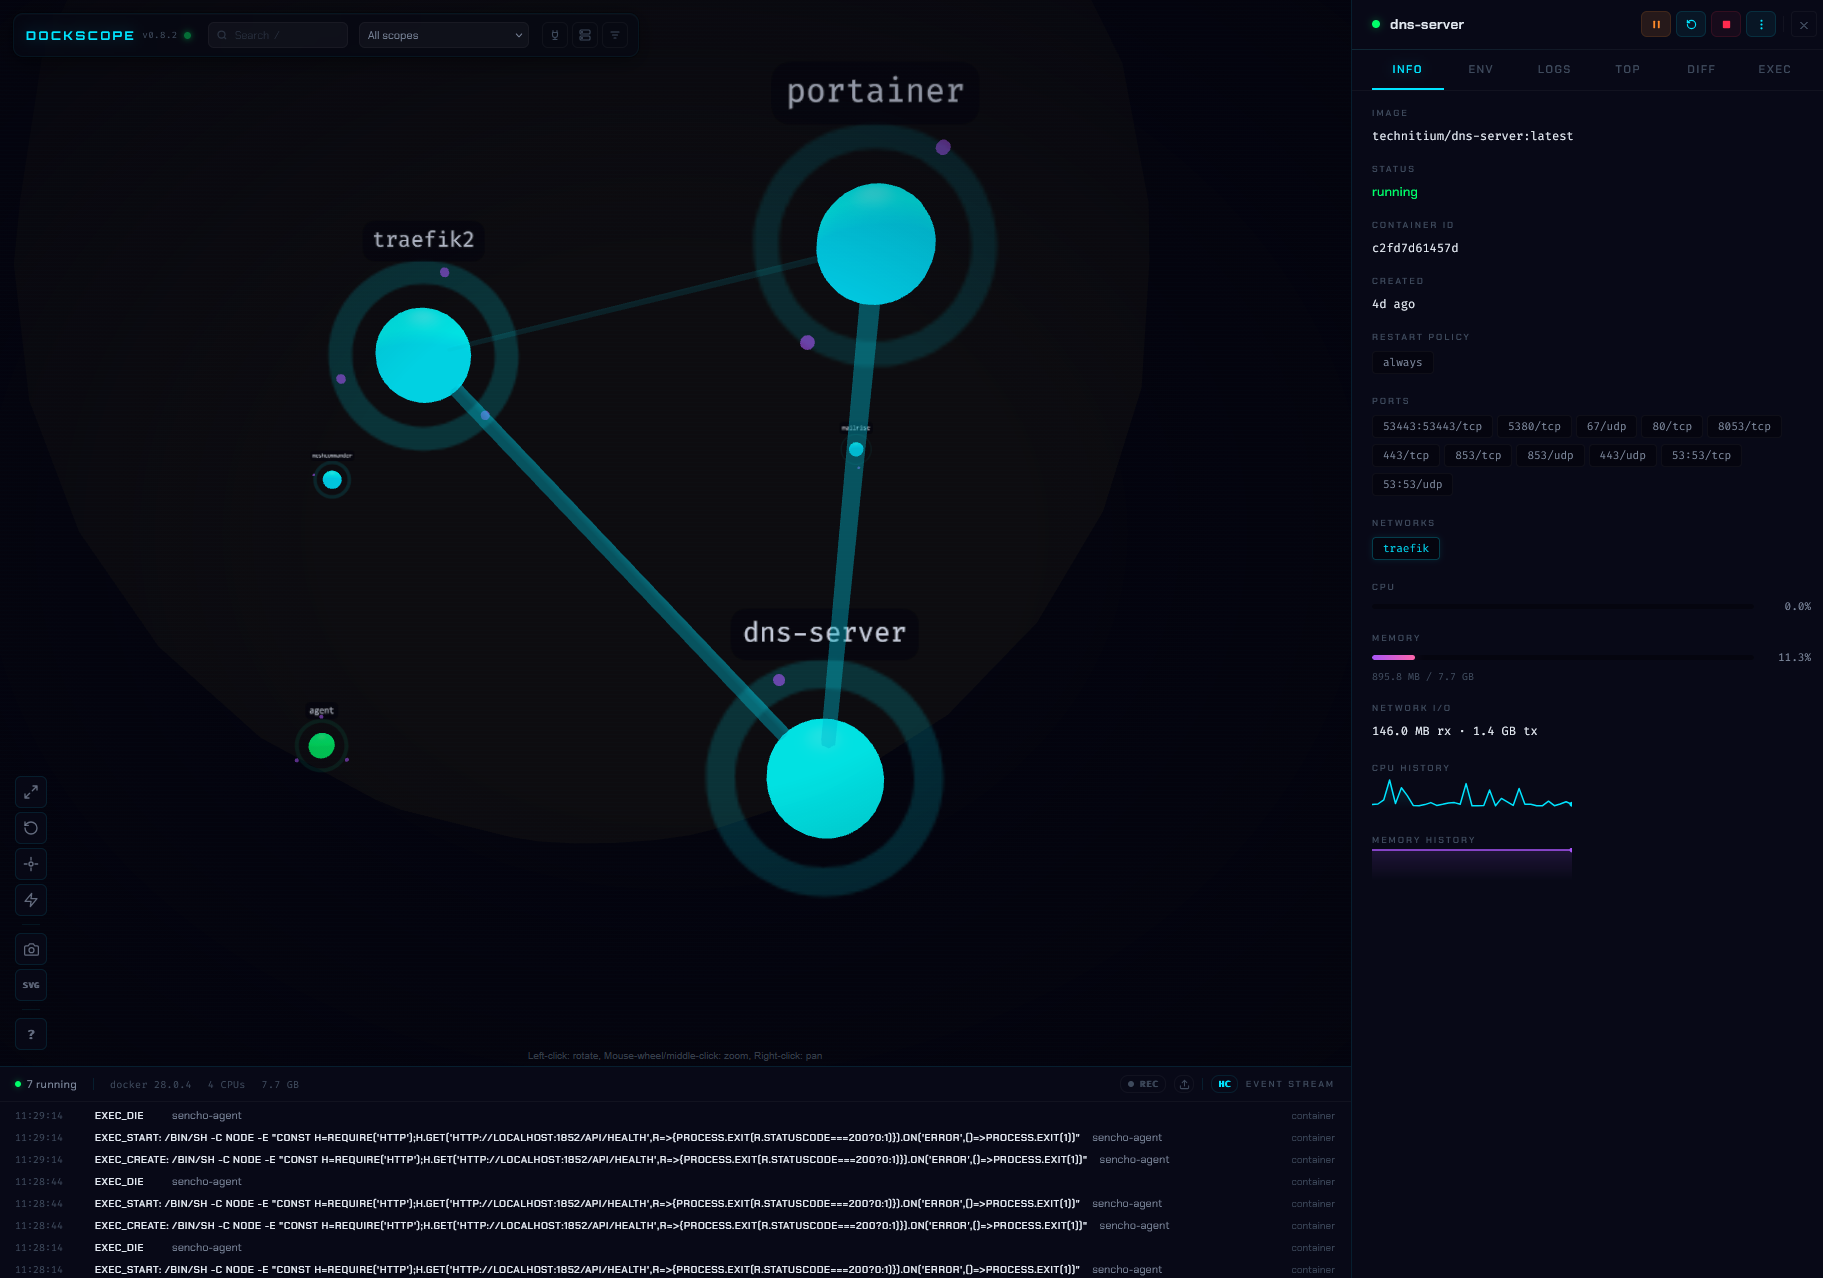
There is no lengthy setup process, no database to configure, just straightforward and simple. It would be nice to see the project adopt some sort of login functionality as there are no credentials required to login, which you definitely would want.
Seeing your entire Docker stack visually
This is one thing that I think Dockscope does really well and that is give you a visual representation of your docker containers, which ones are connected, dependencies, etc. It almost gives you the same feel as a mind map type diagram on how everything is connected.
Below is the “impact view” that shows you how things are connected and which containers are affected by other containers running in the environment.
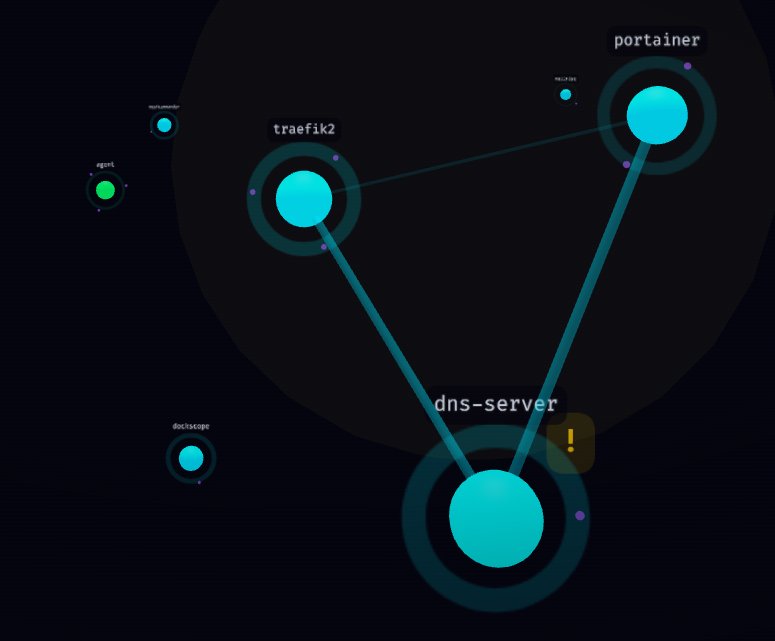
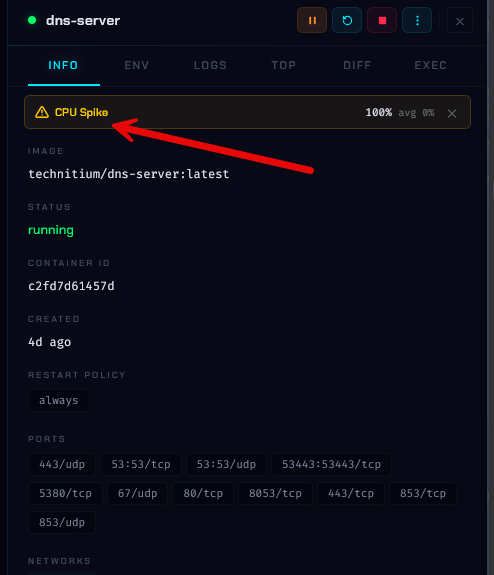
As you can see next to the “dns-server” above in the impact view, we see the exclamation point next to the container. This shows us that something has at least happened that is noteworthy in the container environment with this application.
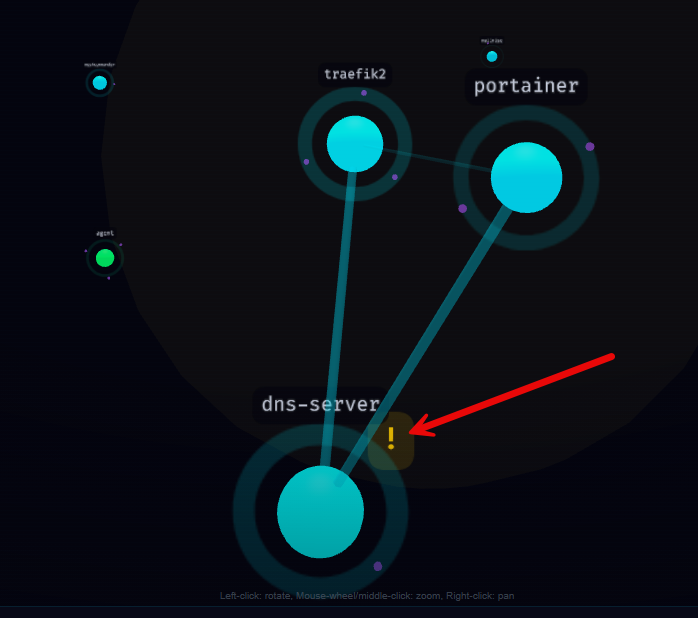
If I click on the dns-server containerized app, I can see in the informational tab there was a CPU spike with the app.
Good tools in addition to the pretty graphs
I think most will see the novelty in the 3D view, but I really do think it has some beneficial features that are aggregated at your fingertips. For instance for a particular container, once you focus on one that you want to work with, you get a variety of tabs.
Info tab
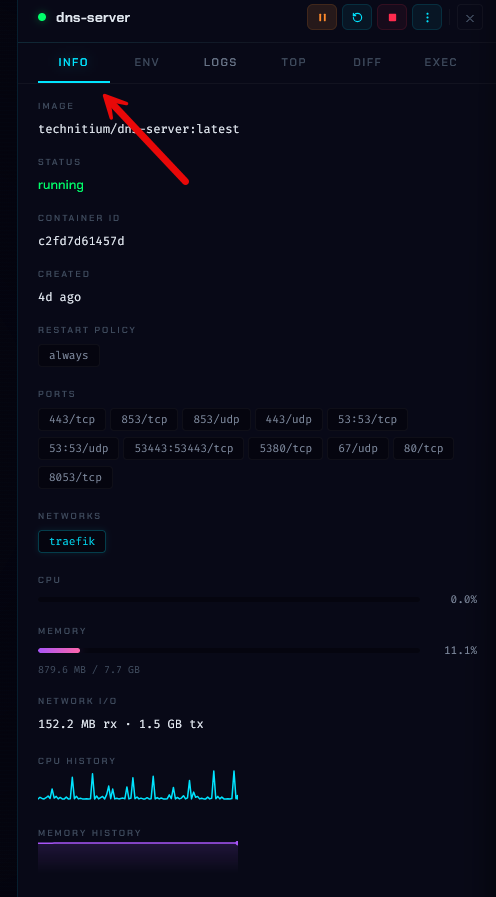
For each container you get an info screen that displays general information on the image you are running, the current status of the container, the container ID, when the container was created, the restart policy and ports exposed for the containerized app.
You can also see which docker network it is connected to and a small graph of performance information for the container.
Env tab
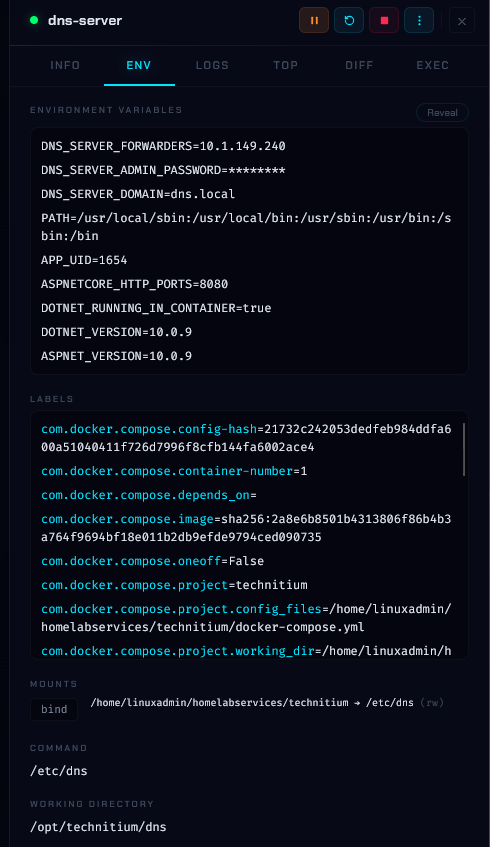
On the env screen you can see the environment variables the container was provisioned with. This is handy as you can see which env variables are set and if there is an incorrect value configured.
Top tab
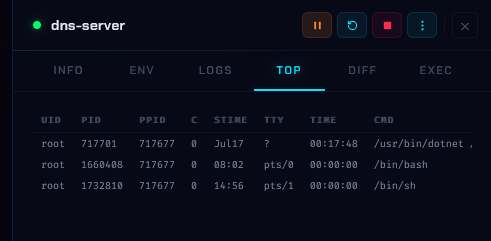
This is another handy tool built into the interface. You can see the top processes on the “top” tab in dockscope.
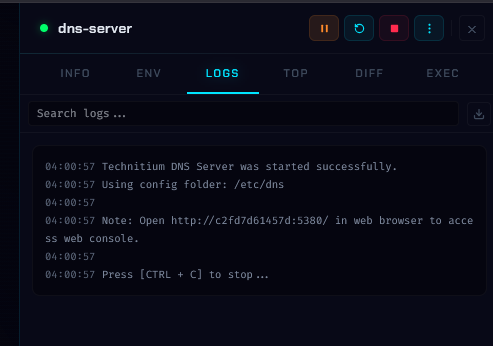
Logs tab
This is also a handy screen to have the recent logs for the container displaying in real-time. The only complaint I have here is the text is very difficult to read as the contrast needs some work.
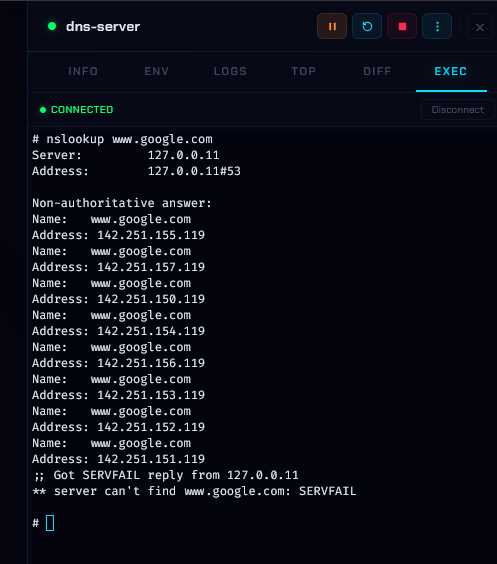
Exec tab
On the exec tab, you can connect to the container and run commands from within the containerized environment. This is handy to be able to troubleshoot various things and to “see” what the container “sees”.
Those are the things I actually spend time looking at when troubleshooting Docker services. So, when you click on a container, instead of running several commands like:
docker ps
docker stats
docker logs -f
docker exec -it
You can see all of this information in the UI by clicking the various tabs for the container.
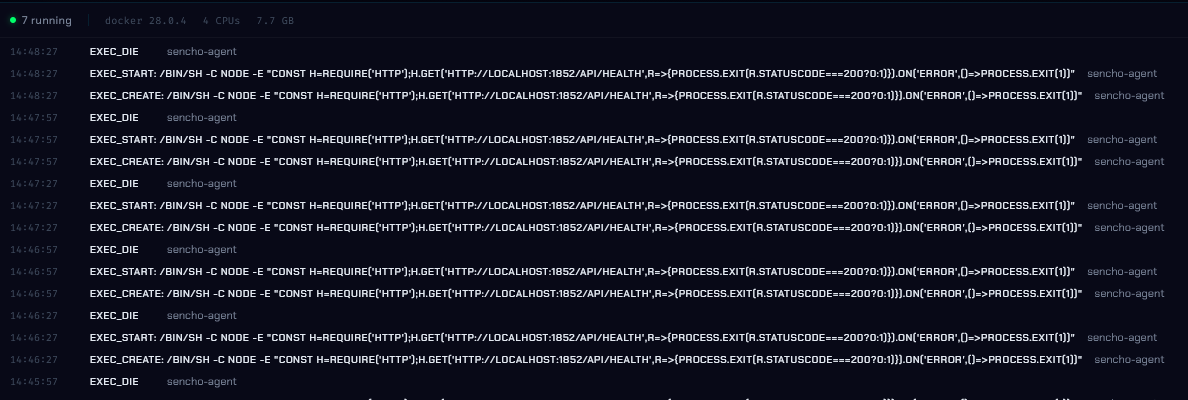
Health check event stream
One of the cool things you can see from the Dockscope interface is a health check events stream that shows you in real-time health check events that can allow you to see what is going on from a Docker health check perspective.
Crash diagnostics are an interesting addition
Another capability that caught my attention is automated crash diagnostics. So, if you have a container that unexpectedly exits, the Dockscope attempts to see what the likely cause is by examining the runtime information that it has available to it.
This includes information like the following:
- Exit codes
- Recent log entries
- Resource exhaustion
- Out of memory events
Anyone who has managed Docker containers long enough has seen containers repeatedly restarting without immediately understanding why.
While experienced administrators will still investigate manually, having an automated first pass could speed up troubleshooting considerably.
I especially like tools that shorten the time between “something is broken” and “I know why.”
Security considerations
I know we mentioned this in the installation section. But security is definitely an important consideration with this tool. Like Portainer and many other Docker management applications, DockScope requires access to the Docker socket.
That means mounting:
/var/run/docker.sockThe Docker socket effectively provides administrative access to the Docker host. In this version of the tool at least, there is no authentication to get into the interface. So just make sure you understand the security implications of the docker socket connection.
My final thoughts
Dockscope is an interesting one and I think if it gets some more polish on the UI and a few more features from a security standpoint, like auth and MFA, this would be a tool that may be considered by more home labbers. I do think the visual representations of the Docker containers is a very cool concept and the addition of tools into the interface such as real-time logs, exec’ing into the container, env variables, top information, etc. I do think the UI needs some work to make things more visible and better contrast for panels. Hopefully this project will continue to grow and develop. Let me know your thoughts. Is Dockscope something you would try out in your home lab?
More in this topic




Google is updating how articles are shown. Don’t miss our leading home lab and tech content, written by humans, by setting Virtualization Howto as a preferred source.
About The Author

Thank you for the write-up.
I’ll definitely give this a go.
Seeing containers that get stuck in a restarting loop would be really handy.
Thanks for the comment. Definitely a cool project to try out in the home lab. Please share what you think about it. Definitely has some rough edges, but cool nonetheless.
Thanks for recommending this! It’s very interesting. The visualization is a nice bit of “gee whiz” & the other info is great to get without digging in Portainer. Agree 100% about log in security, though.
Thanks again. This was an fun way to start a Saturday!