
With all the great GUI platforms and third-party and community tools we have for Proxmox, you might think there would never be a need to visit the command line in Proxmox and instead troubleshoot everything and configure everything from the GUI. In my own lab, I run a multi-node Proxmox cluster that is backed by Ceph storage. Over time, I have found myself relying on a core set of commands that I run on a daily basis. Let’s look at the 7 Proxmox commands I am using daily in my home lab.
pvecm status
This is absolutely one of the most important command line commands you can know if you are running a Proxmox cluster which many get into doing in the home lab if they have multiple Proxmox nodes/mini PCs.
The pvecm status command shows the current health and membership of the Proxmox cluster. I really like to use this command extensively if I have rebooted hosts or about to perform maintenance on one of the hosts in the cluster. I don’t like to do anything if there is already a problem in the cluster. Running this command and noting the output will help you to know the cluster is healthy and in a good place to
pvecm statusBelow is the typical output of a healthy cluster. You can see that it shows the quorum status of the cluster, how many votes are expected, how many are currently given, the number for quorum, etc.
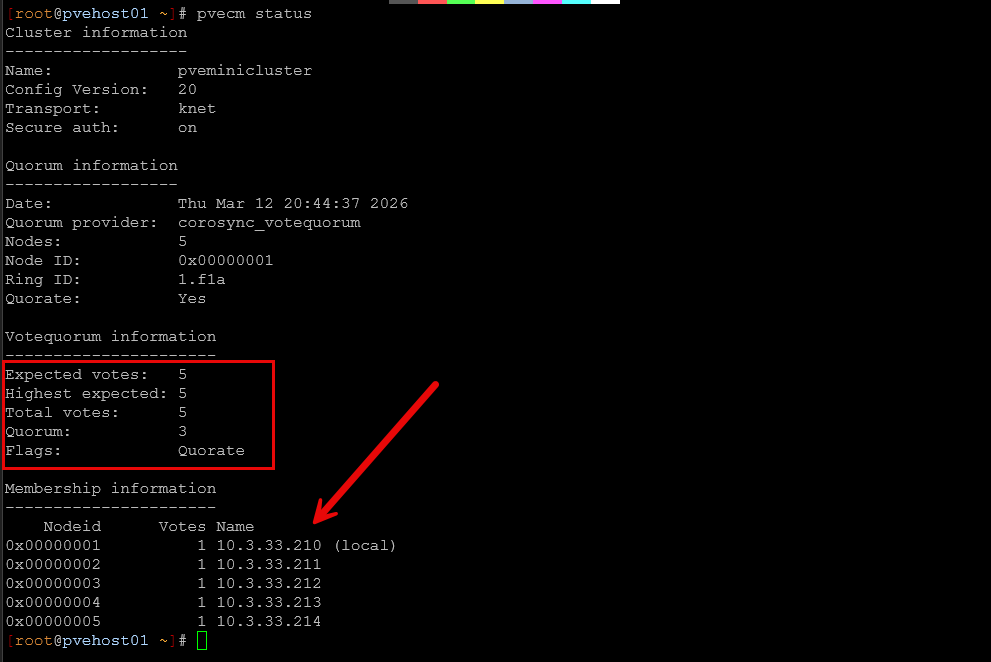
The output provides several important pieces of information, including:
- cluster name
- quorum status
- number of nodes
- vote count
- cluster membership
This command is extremely helpful because it immediately tells you whether the cluster has quorum and which nodes are participating in the cluster. This can be eye opening if there is an issue, etc.
If quorum is lost, many cluster operations stop working correctly. For example, migrations and configuration changes may fail. Running this command is a way to quickly confirm if the cluster is communicating between nodes like it should be.
Another command that is often used alongside it is:
pvecm nodesThis gives you a more simplified view of the cluster nodes and their status.
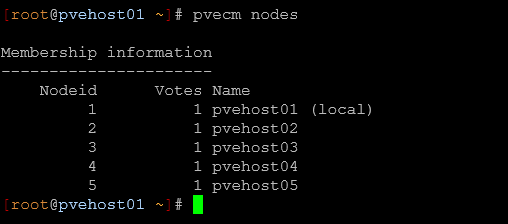
In a multi node home lab this can quickly show you if one of your nodes has dropped out of the cluster.
ceph -s
If you are running Ceph for your shared storage in your Proxmox environment, the ceph -s (short for the ceph status) command is the number one tool that you will want to know to run and check out the health of your distributed storage.
Example command:
ceph -sBelow is a sample output from my Proxmox mini cluster running Ceph storage:
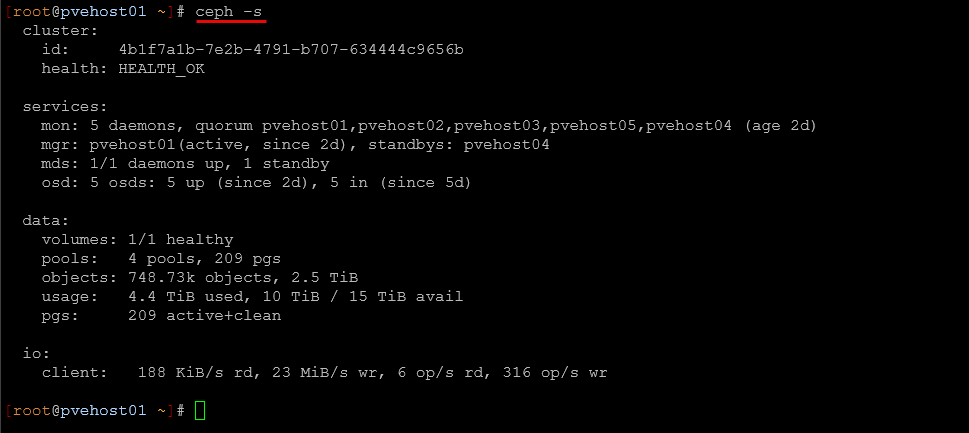
This command gives you a quick overview of the entire Ceph cluster and its current health state.
The output will include:
- cluster health
- monitor status
- number of OSDs
- placement group health
- recovery activity
- data usage
A healthy cluster will typically show:
health: HEALTH_OKIf something needs attention, you may see messages such as:
HEALTH_WARNor
HEALTH_ERRIn those cases the output will usually include details explaining the issue or the event that led to the status being what it is currently.
For anyone running Proxmox with Ceph shared storage, this command is one of the fastest ways to confirm that the storage cluster is functioning like it needs to be. If something doesn’t look right with VM disks or performance, this is often the first place to check if you are running Ceph for your virtual machine storage.
pvesm status
The next command I frequently run is pvesm status. This is the command that shows the status of storage backends configured within Proxmox.
Example command:
pvesm status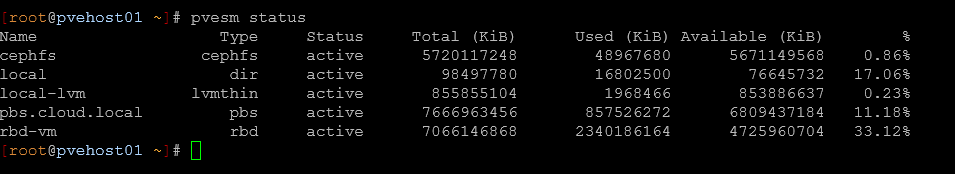
The output provides an overview of all storage resources that Proxmox is aware of.
For example:
Name       Type     Status     Total       Used       Available
local      dir      active     100G        35G        65G
local-lvm  lvmthin  active     500G        200G       300G
ceph-vm    rbd      active     2.0T        1.1T       900G
This command is useful for several different reasons. First, it lets you know that storage backends are active and reachable from the node. If a storage system becomes unavailable, it will often appear here as inactive.
Second, it gives you a quick view of the available capacity across your storage pools. This can help you prevent situations where a datastore fills up unexpectedly.
And lastly, it is a quick troubleshooting step when VM disks appear to be inaccessible or when migrations fail due to storage issues.
qm list
I am constantly doing things with VMs running in Proxmox. The qm command is the primary tool that you use to manage KVM virtual machines from the Proxmox command line. The one command that is super useful in this toolset is the qm list command.
Example command:
qm listThis displays a list of all virtual machines on the node you are connected to along with their current status.
Typical output looks like this:
VMID   NAME         STATUS     MEM(MB)   BOOTDISK(GB)   PID
100    docker01     running    4096      40             21341
101    gitlab01     stopped    8192      80             0
102    k8s-node01   running    4096      60             33212
Below is an output on one of my Proxmox nodes.
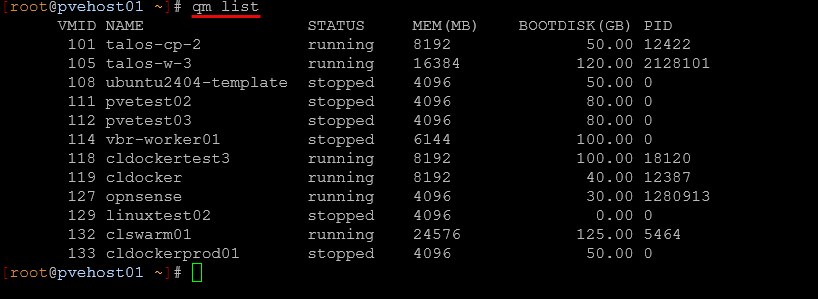
This command is extremely useful because it lets you quickly see which VMs are running and which are stopped. The main thing it gives you is the VM IDs. These are important to get since you need the IDs and these are required for many other commands such as:
qm start 100
qm stop 100
qm config 100
When you have a larger environment where you have multiple nodes that are running many virtual machines, this command becomes very helpful to identify specific workloads. But, I don’t want it to sound like it is only needed in large environments. I use the command when querying virtual machines in things like CI/CD in the home lab and getting IDs programmatically so you can then use that information for another action.
pct list
In the same respect, just like virtual machines, you can get a listing of your LXC containers. LXC containers are extremely popular to run in Proxmox and are basically extremely lightweight operating system containers that are used to run very small services efficiently without the “resource spend” that you would have on a full virtual machine in the home lab.
The command used to manage containers is pct. To see the containers you have running on a node, you can run:
pct list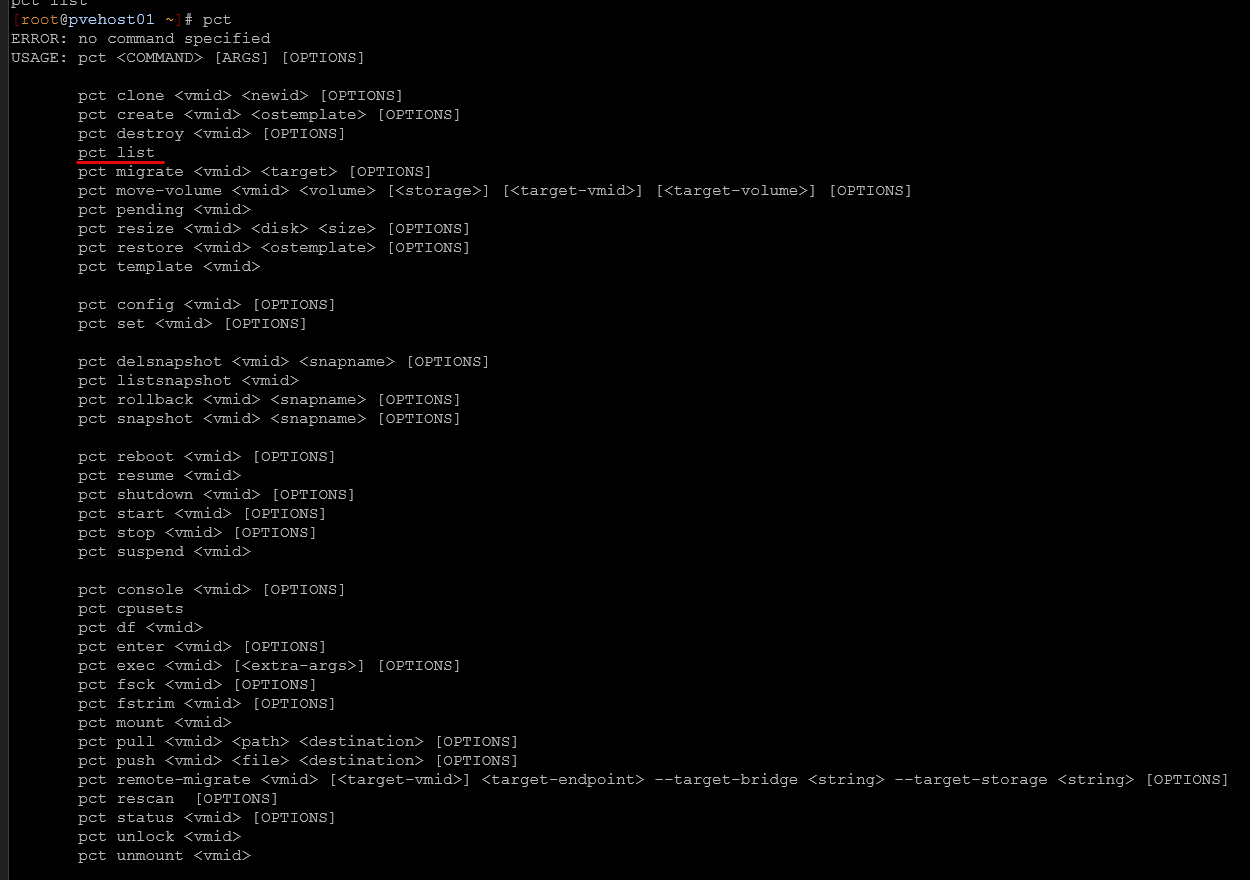
The output will show container IDs and their status.
Example output:
VMID   Status     Name
200    running    nginx
201    stopped    monitoring
202    running    home-assistant
Just like with VMs, the container ID is important for performing operations like starting or stopping your containers.
Here are a few examples:
pct start 200
pct stop 200
pct exec 200 bash
For home labs that run many lightweight services in LXC containers, this is a command that can be a part of your daily workflow.
pveperf
This is another useful command that goes through a quick performance check on your node. It is simple to use and gives you insights into things like CPU and storage performance.
Here is an example command:
pveperfThe output of that command may look like this:
CPU BOGOMIPS:      96000
REGEX/SECOND:      1400000
HD SIZE:           1000.00 GB
BUFFERED READS:    800 MB/sec
AVERAGE SEEK TIME: 0.25 ms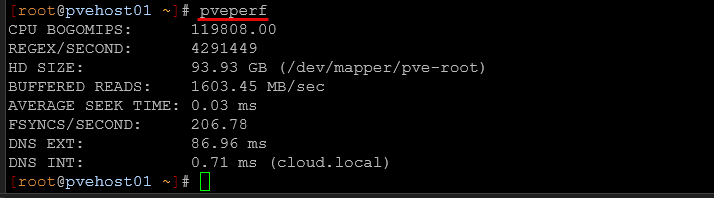
The most important value here is usually the average seek time. This gives you at least a rough idea of disk latency.
Typical things you will see on the output of this command are:
- spinning disks have higher seek times
- SSDs have much lower seek times
- NVMe drives are even faster
This command can be useful when diagnosing slow disk performance or verifying that storage hardware is functioning as expected.
It is also helpful when you need to test new hardware or confirm that your storage performance looks good.
qm unlock
You will have a time every once in a while where a task will get stuck or fail to complete whatever it is trying to do. Whether this is something like a VM migration, backup, or another type of task. If this happens, the VM may get to be in a locked state.
When a VM is locked, operations such as start or stop may fail with messages saying the VM configuration is locked.
The command used to remove a lock is:
qm unlock <vmid>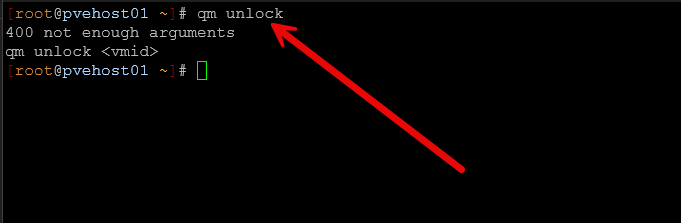
So like the following:
qm unlock 101Where do you get the ID to unlock? You guessed it. By using the qm list command as we mentioned earlier. When you run the unlock command, this clears the lock on the VM configuration and allows operations to then proceed normally.
It is important to only run this command when you are sure that the original task is no longer running. If a task is still active, removing the lock could cause problems. But usually you are going to know if something is hung if it has been stuck for a while on a task that normally tasks only a few seconds. Before unlocking a VM, it can be helpful to check running tasks using:
ps aux | grep qmThis will help you to confirm that no operations are still in progress. But, in my experience in using Proxmox in the home lab, this command can be a lifesaver when dealing with interrupted migrations or failed backup jobs as examples.
Why take the time to learn a few CLI commands in Proxmox?
I think this is a question like anything. To be well-rounded when troubleshooting and having the best set of tools that are needed to get the right information, the CLI is almost always a good idea to know and know well in addition to the GUI interfaces and dashboards. Check out my other post of other 10 Proxmox CLI commands for ultimate control.
One of the strengths of Proxmox VE is that it provides both a powerful web interface and a very capable command line interface with lots of helpful commands. Many administrators rely heavily on the UI, but knowing a handful of CLI commands can make managing your environment much faster and more helpful for quickly diagnosing things.
The commands we have covered here allow you to check the most important parts of your environment:
- cluster health
- storage status
- Ceph health
- virtual machine status
- container status
- node performance
And as I have already alluded to, another advantage is automation. Many of these commands can be integrated into your scripts scripts. Also, these are helpful with monitoring tools, or automation workflows such as you might want to configure in CI/CD pipelines. This makes it easier to build powerful tooling around your Proxmox cluster.
Wrapping up
What do you think about the commands we have mentioned here? Are you using a specific set of Proxmox commands that you find to be helpful that are not on the above list? Please share with us in the comments. In the meantime, these commands are simple and easy and they are basic enough that they are not super hard to remember.
Google is updating how articles are shown. Don’t miss our leading home lab and tech content, written by humans, by setting Virtualization Howto as a preferred source.
About The Author