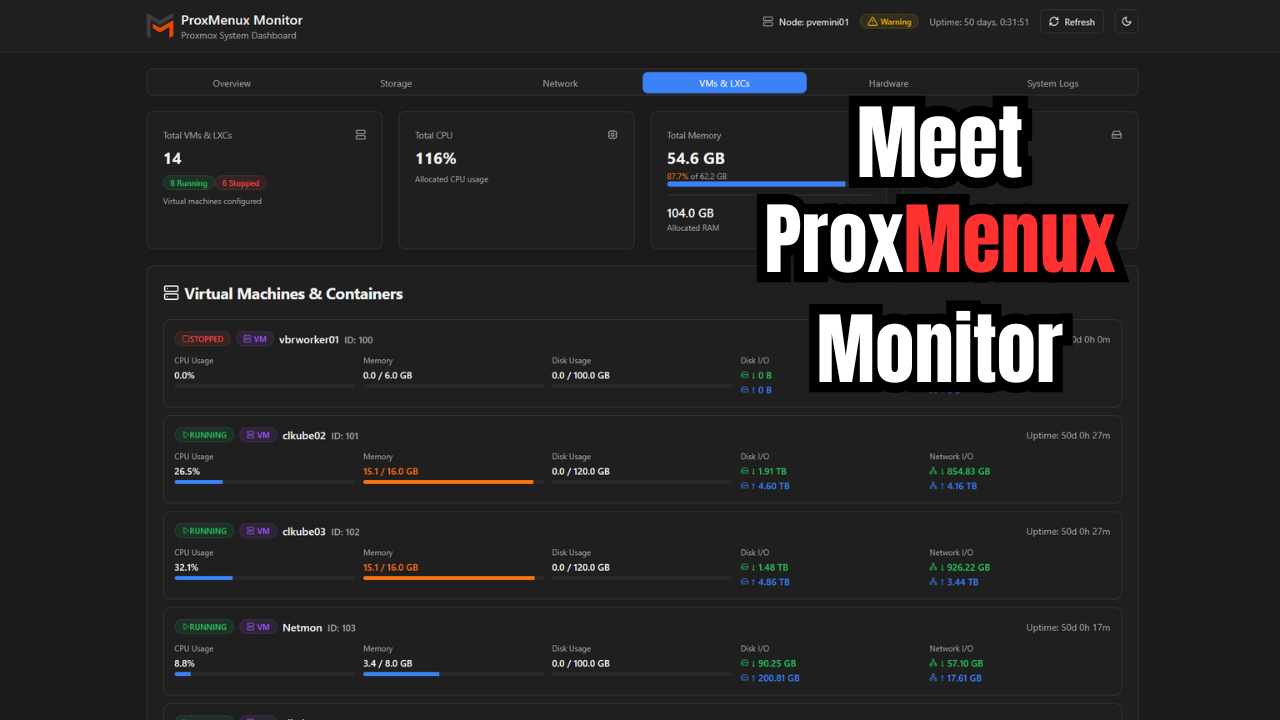
So I had to do a double take when I looked at the ProxMenuX repo and saw that with the latest release there is a new tool that is included with it called ProxMenux Monitor! My curiosity was seriously piqued so I had to install the latest from the repo and try it out. Let’s dive into the new ProxMenux Monitor and see what features and capabilities it offers for those who run ProxMenux on their Proxmox PVE server.
Brief overview of Proxmenux
In case this is the first time you have heard about Proxmenux, it is a solution that provided a text-based menu system that allows doing very cool things easily from the menu-driven system. It allows you to have simple menus to perform rather complex or complicated tasks and you can click through and do things you need to do quickly.
Read my full writeup on this aspect of ProxMenux. here: ProxMenux Might Be the Best Proxmox Management Tool You’re Not Using. I also covered this aspect of the tool in a video that you can watch here:
New ProxMenux Monitor
However, there is a new aspect to the tool now with the latest installation from the repo, called ProxMenux Monitor. This was introduced in version v1.1.7 of the tool. This is straight from the change log on GitHub: Releases · MacRimi/ProxMenux · GitHub.
A brand new interface to monitor your Proxmox infrastructure. It is designed with future updates in mind:
- Prepare for GUI-based actions without needing a terminal
- Designed to work across multiple devices and formats
- Built with modularity and expansion in mind
So, let’s take it for a test spin and see what it is all about.
Detailed features
The new ProxMenux Monitor contains many great features right out of the gate after you install. Take a look at the following:
- System overview – it allows you to monitor your server’s status in real-time. You can see things like CPU memory, temperature, system load and other things
- Storage management – You can visualize the status of all your disks and volumes and get detailed information on cpaacity, suage, SMART health, temperature, and performance of each storage device
- Network metrics – You can monitor your network traffic in real-time. It gives you bandwidth stats, active interfaces, transfer speeds, and historical usage graphs
- Virtual machines & containers – you can manage your VMs and LXC containers from a single location and see their status, resources, currernt usage, and quick controls like start, stop, etc.
- Hardware information – You get details of your server hardware, including the CPU, RAM, GPU, disks, network, UPS, and other metrics like technical information, models, serial numbers, and status
- System logs – show logs in real-time and you can filter by event type, search for errors and keep track of your server activity
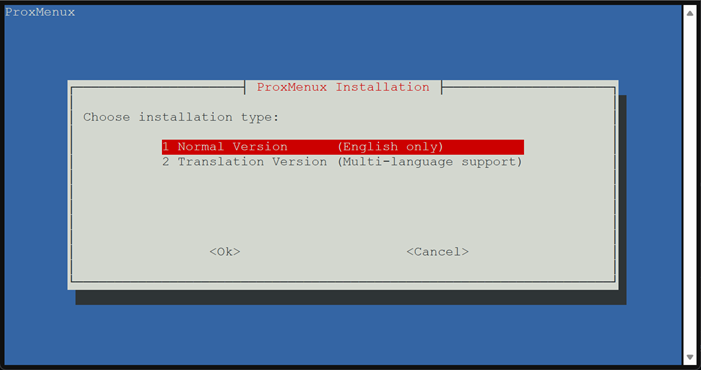
Installing ProxMenux and ProxMenux Monitor
The process to install ProxMenux is the same as it has always been. You still just run the installer from the GitHub repo:
bash -c "$(wget -qLO - https://raw.githubusercontent.com/MacRimi/ProxMenux/main/install_proxmenux.sh)"However, now after the first language screen:
Now on the next screen is where we see the addition of ProxMenux Monitor. As you can see it tells us that it will be installed on port 8008 on the Proxmox VE Server.
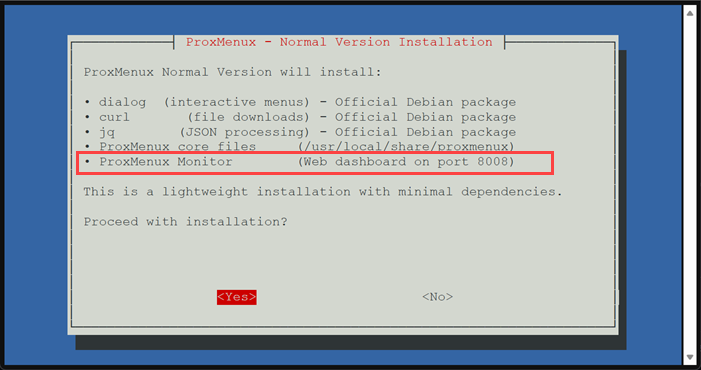
After you select Yes to proceed with the installation, the script will output as various stages of the install are successful. You will then see the ProxMenux Monitor activated at the last part of the installation. So, at this point, you type menu to launch the menu-driven tool of Proxmenux, or in a web browser, navigate out to port 8008.

ProxMenux Monitor interface and dashboards
Once you browse out to port 8008, you will be greeted with a tour from the tool, showcasing its features and functionality. One point to note is that ProxMenux Monitor when you launch it doesn’t ask for a password so it isn’t integrated with your Proxmox VE server credentials outside of the user you use to install the script. So, I can see this as a needed enhancement.
Also, by default it uses no encryption of the web traffic, so this is like navigating to port 80 on a web server. Everything will be sent across the network in plain text. Just a couple of nit picky things there. However, this being a brand new feature, I am sure this will be on the short list of things to shore up in the next release.
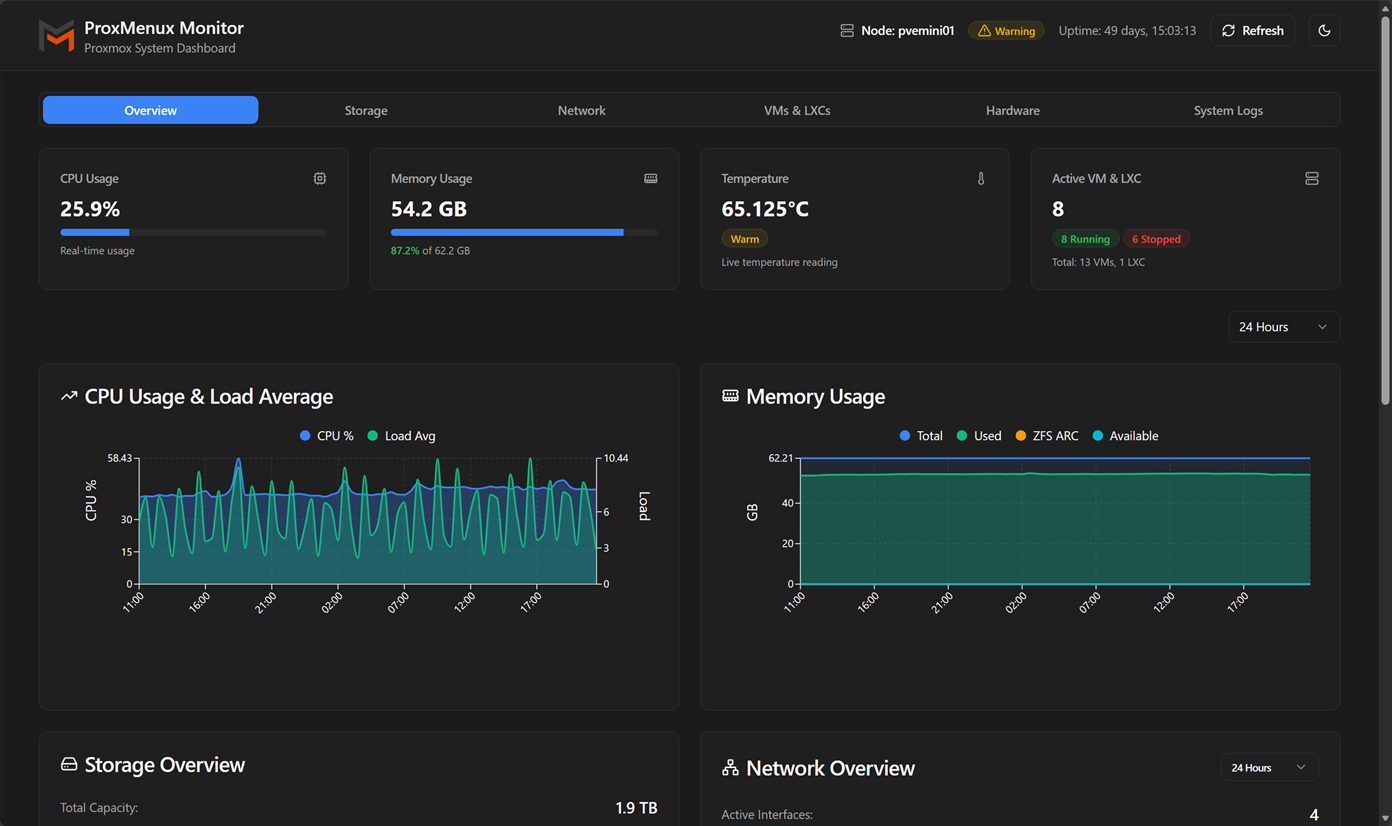
System overview
The system overview screen gives you a great overview of your Proxmox VE Server, including all of the metrics you would expect. I found the look and feel to be excellent and very modern. It makes us wish this is what the official Proxmox interface looked like.
On the overview screen you will see cards or widgets for each of the respective areas: CPU, memory, storage, network, etc.
Storage
Under the storage screen, you get a detailed look at your storage infrastructure in your Proxmox environment. It gives you things like your total storage, used storage, disk health, and disk types. Also, you get a detailed look at how much storage is being used by what.
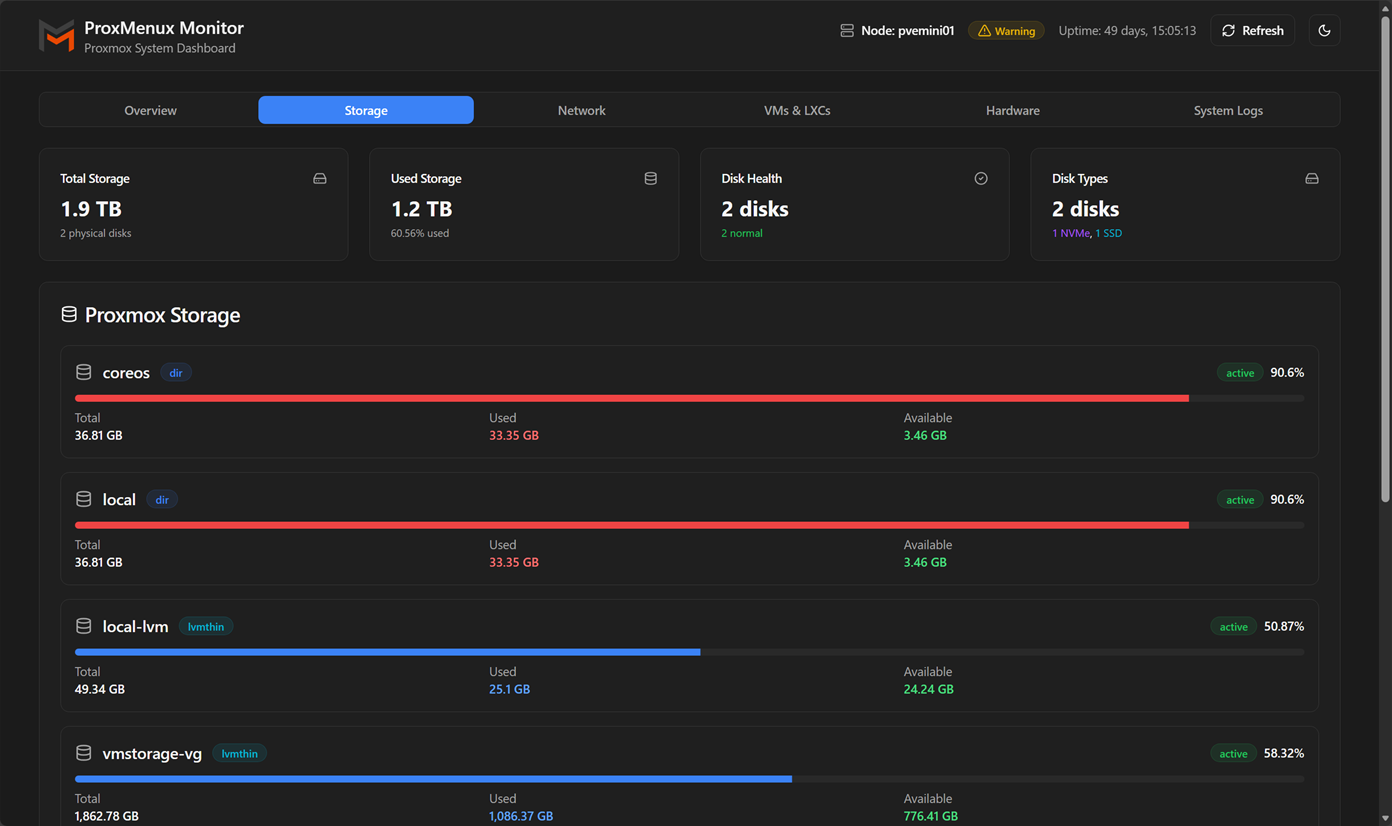
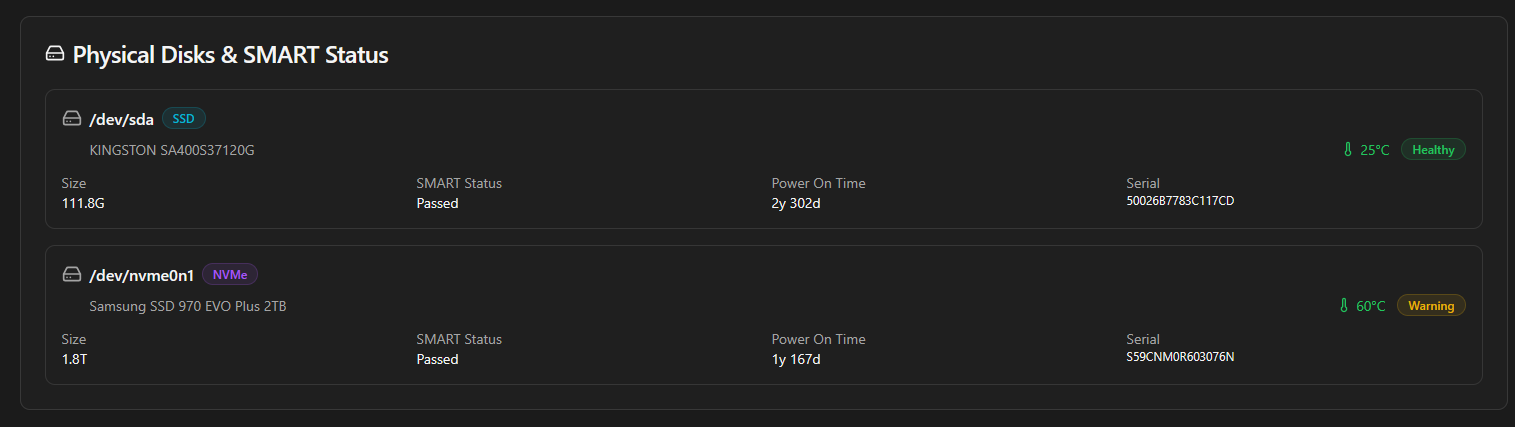
A handy view as well is the SMART status tile that lets you see the hardware status of your devices.
Network
The network dashboard contains great information as well about your network traffic. You can see the traffic received and sent, active interfaces, network configuration, health, and graphs representing your traffic. Also, you see detailed information on your physical interfaces, their speeds, duplex, MTU, etc.

VMs & LXCs
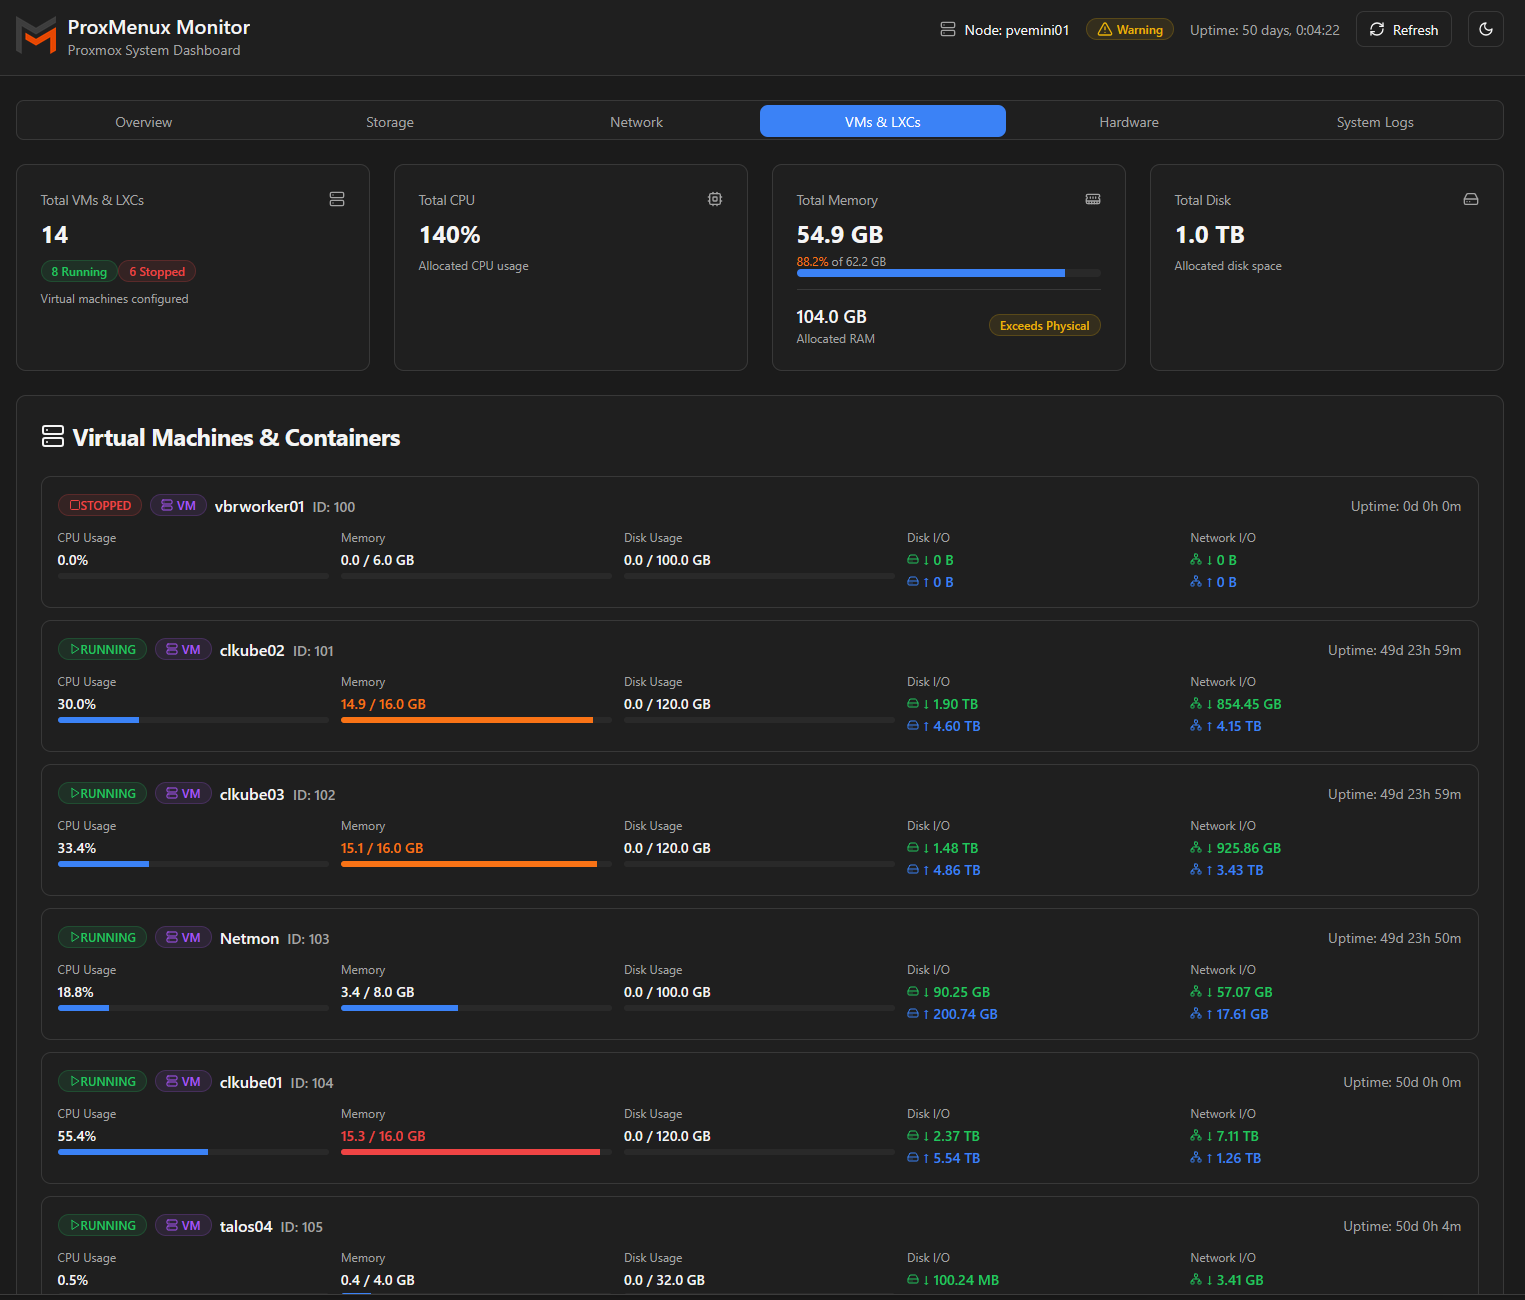
The next dashboard is the VMs & LXCs screen. This screen is beautiful and provides a great overview of your virtual machines and LXC containers you are running in the Proxmox environment. You see a good overview of each virtual machine and LXC container, along with the CPU usage, memory, disk usage, disk I/O, and Network I/O.
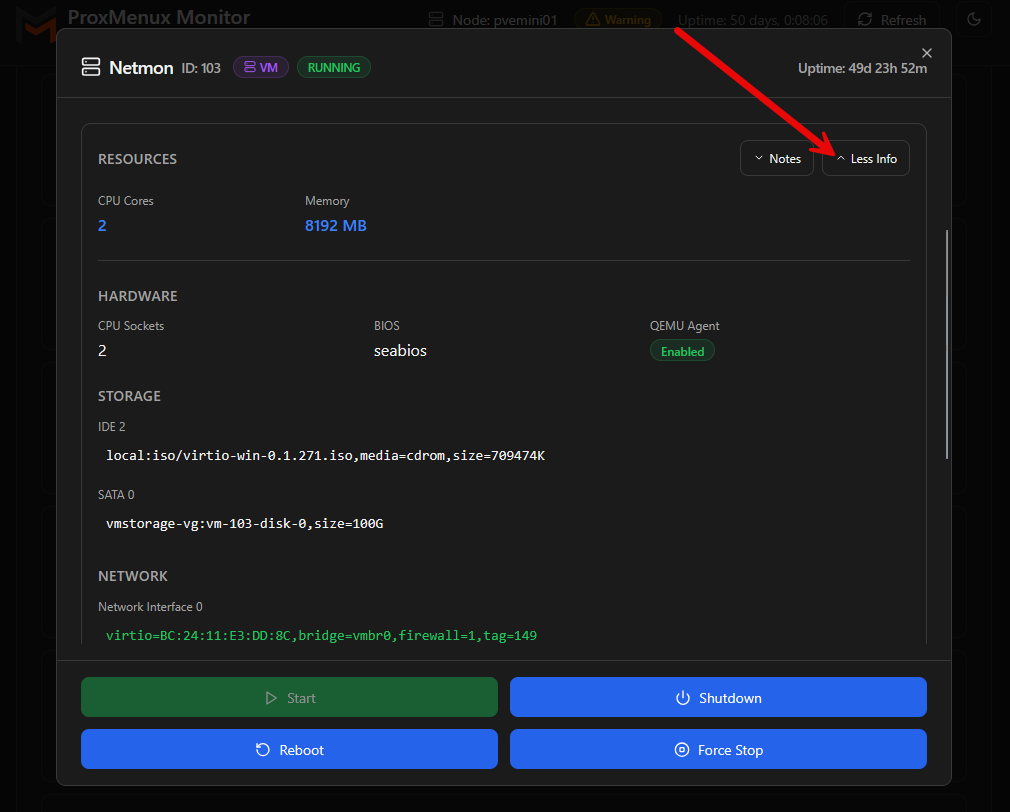
When you click on a specific virtual machine or LXC container, you will see the metrics in more detail. There is also a more info button you can click and when you click there (it changes to “less info”), you will see more detailed information on the virtual machine, including virtual hardware configuration, network config, firewall, VLAN tags, etc. On this screen as well, you have the ability to shutdown, reboot, and force stop if running, or start if it isn’t running.
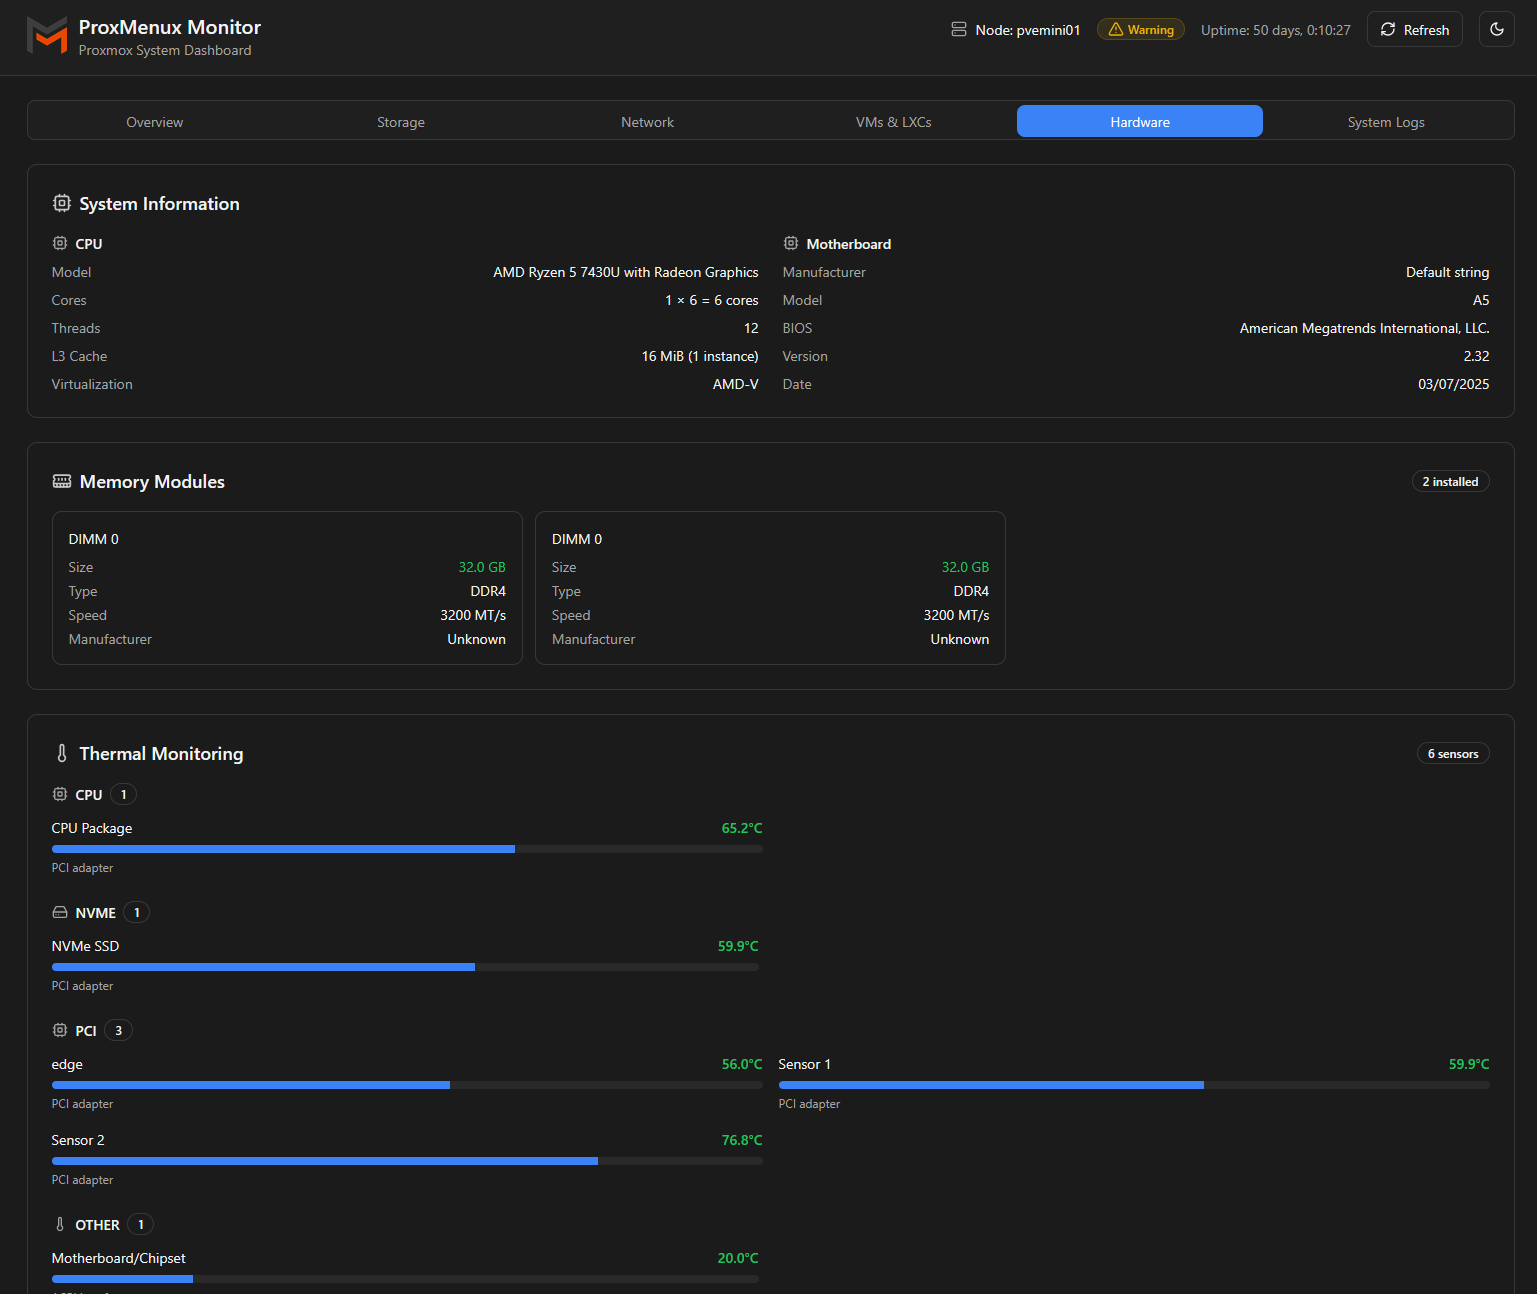
Hardware
On the hardware screen, you get a detailed view of everything hardware. This includes more detailed information on t he System itself, model, cores, threads, L3 cache, virtualization instructions, motherboard, manufacturer, model, BIOS, version, date, memory modules, and thermal monitoring. So, it is like your one stop shop to get a detailed look at the hardware and its health.
System logs
On the system logs screen, you will see a detailed look at your logs. You will see a detail of how many log entries there are, and also a listing by severity, including errors, warnings, backups, etc.

Thoughts on the direction of ProxMenux Monitor
I think it is a great development to see ProxMenux Monitor evolve from the ProxMenux solution. It has a modern design and look that you would expect from a monitoring app in late 2025. Also, for a 1.00 release, it is very fully featured in the information you see and can uncover across the various dashboard.
It has been exciting to see the explosion of really great Proxmox tools over the course of this year. The potential is exciting to see how we can extend the Proxmox ecosystem. And, the best part is, it is not locked behind some type of paywall.
Video
Wrapping up
It is really exciting to see ProxMenux Monitor come from the still very new ProxMenux tool. And it allows you to configure and manage your Proxmox VE Server in an easy way. The Monitor aspect of the tool is going to be a great complement to the functionality that we already see as part of the tool. There are a few things again that are less than ideal about it. These include the lack of authentication to the tool and also that it currently is exposed over port 8080 clear text. Regardless for a 1.00 release, it holds a lot of potential and gets me excited for what is to come with the solution. Have you tried it out yet? Let me know in the comments.
Google is updating how articles are shown. Don’t miss our leading home lab and tech content, written by humans, by setting Virtualization Howto as a preferred source.
About The Author


Way cool…I have to check this out!
This looks awesome! But I have a question, how well does it perform with clustered nodes? Do we need to install it separately on each node or can we view the stats for each from a single node?
Christopher,
This is a really good question and one I haven’t tested as of yet. Just installed on a standalone node for the blog post. However, will be testing this soon, so stay tuned 👍
I just tested this, and you have to install it on every node in your cluster, since this tool is not cluster-aware and will not show anything related to clustering.
Worth mentioning, I like it even though making it cluster-aware will be more appealing.
@Mahmoud Yossif very nice thank you for testing this and sharing. Hopefully something on the road map in a future release.
Brandon
Great Post.
Want to add that if you use https and dns to enter your proxmox that will not work with this monitor tool.
It doesnt work with https nor dns. and it was already mentioned that it is not cluster aware.
Awesome tool either way.
David,
Great points here and good to know some of the limitations. I think it is definitely rough around the edges in this version. Hoping that it will evolve very quickly to include some of the things the community is noting here after using. All in all, a great tool to add to the list and one to watch for sure.
Brandon
In that case, rathe explore Proxmox Pulse, which supports clusters and provides even more insights. See https://github.com/rcourtman/Pulse
A great tool for managing and monitoring Proxmox servers. Easy to use and very useful for administrators.
IOOkkle,
Thanks so much for the comment and feedback on the tool. I agree, definitely incredibly useful for managing and monitoring Proxmox. It has been great to see so many new tools appear for Proxmox. It just shows the momentum behind it.
Thanks again,
Brandon
I can’t wait to have a ProxMox Cluster Monitor editiion of this.
I’m still running VE 8.4.16 on three N100 nodes. Something must be a bit off with the ACEPC minis ProxMenux shows the thermal monitoring on only one of the nodes. Interestingly, it’s the one that has critical status on the SSD with 780 reallocated sectors and is the node that keeps dying every few months.
Also ProxMenux shows the SSD’s SMART values. ProxMox’s Disks section shows No SMART values and the CLI command is necessary to get those stats. This is quite nice of ProxMenux to help here.