I think all of us are looking for very cool tools that can add modern dashboards to Proxmox and to help monitor what is going on with your Proxmox host, cluster hosts, VMs, and LXC containers. There is a new open source project that can do just that. It is called Pulse. Pulse is a new and exciting community tool that is available for monitoring Proxmox. Let’s take a look at the features and capabilities that Pulse brings to the table.
What is Pulse?
So, Pulse is an open-source monitoring platform that you can run for free for monitoring. It was built specifically for Proxmox VE Server. It has hooks built-in that talk directly to the Promxox API and gives you a clean dashboard where you can see metrics from your nodes and virtual machines. But it doesn’t stop there.
You can also add and monitor Docker hosts as well along with your Docker containers using Pulse. I love this as I think it covers exactly what a lot of home labbers and self-hosters are looking to monitor in the home lab. Most are probalby running Proxmox VE Server these days and also running Docker containers to self-host apps.
What Pulse does and features
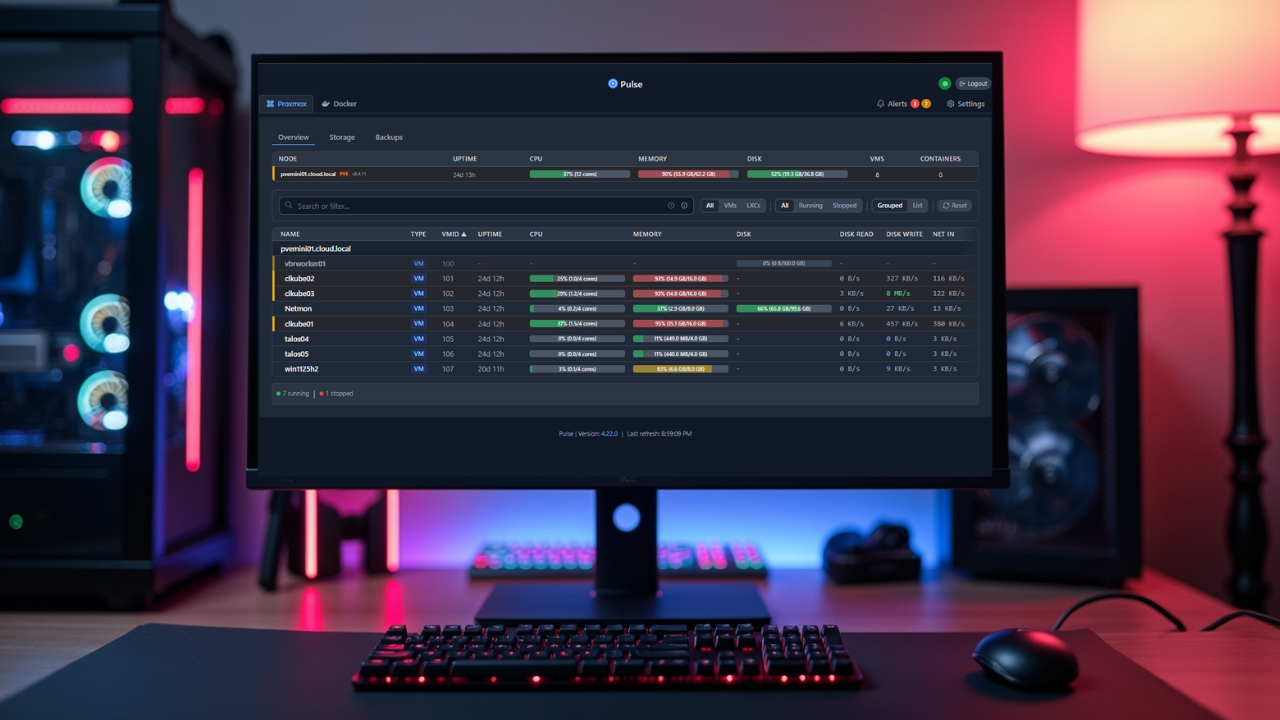
The idea with Pulse is pretty simple. It lets you take the detailed data from the Proxmox backend that exists there and display this in a single web interface. The interface is very streamlined and easy to read. Once you connect Pulse to your cluster, it will start to automatically gather data and visualize the live metrics in the dashboard.
You will see things like system resource usage, health of VMs and containers, and other metrics. The other neat thing about Pulse is that it is super lightweight. It doesn’t need an external database or other services. Everything is found in a single deployment. So, you can deploy it in a small VM or even run it in an LXC or Docker container.
Note the following highlights of the features list:
- Auto-discovery – Finds Proxmox nodes automatically with one-line installation scripts
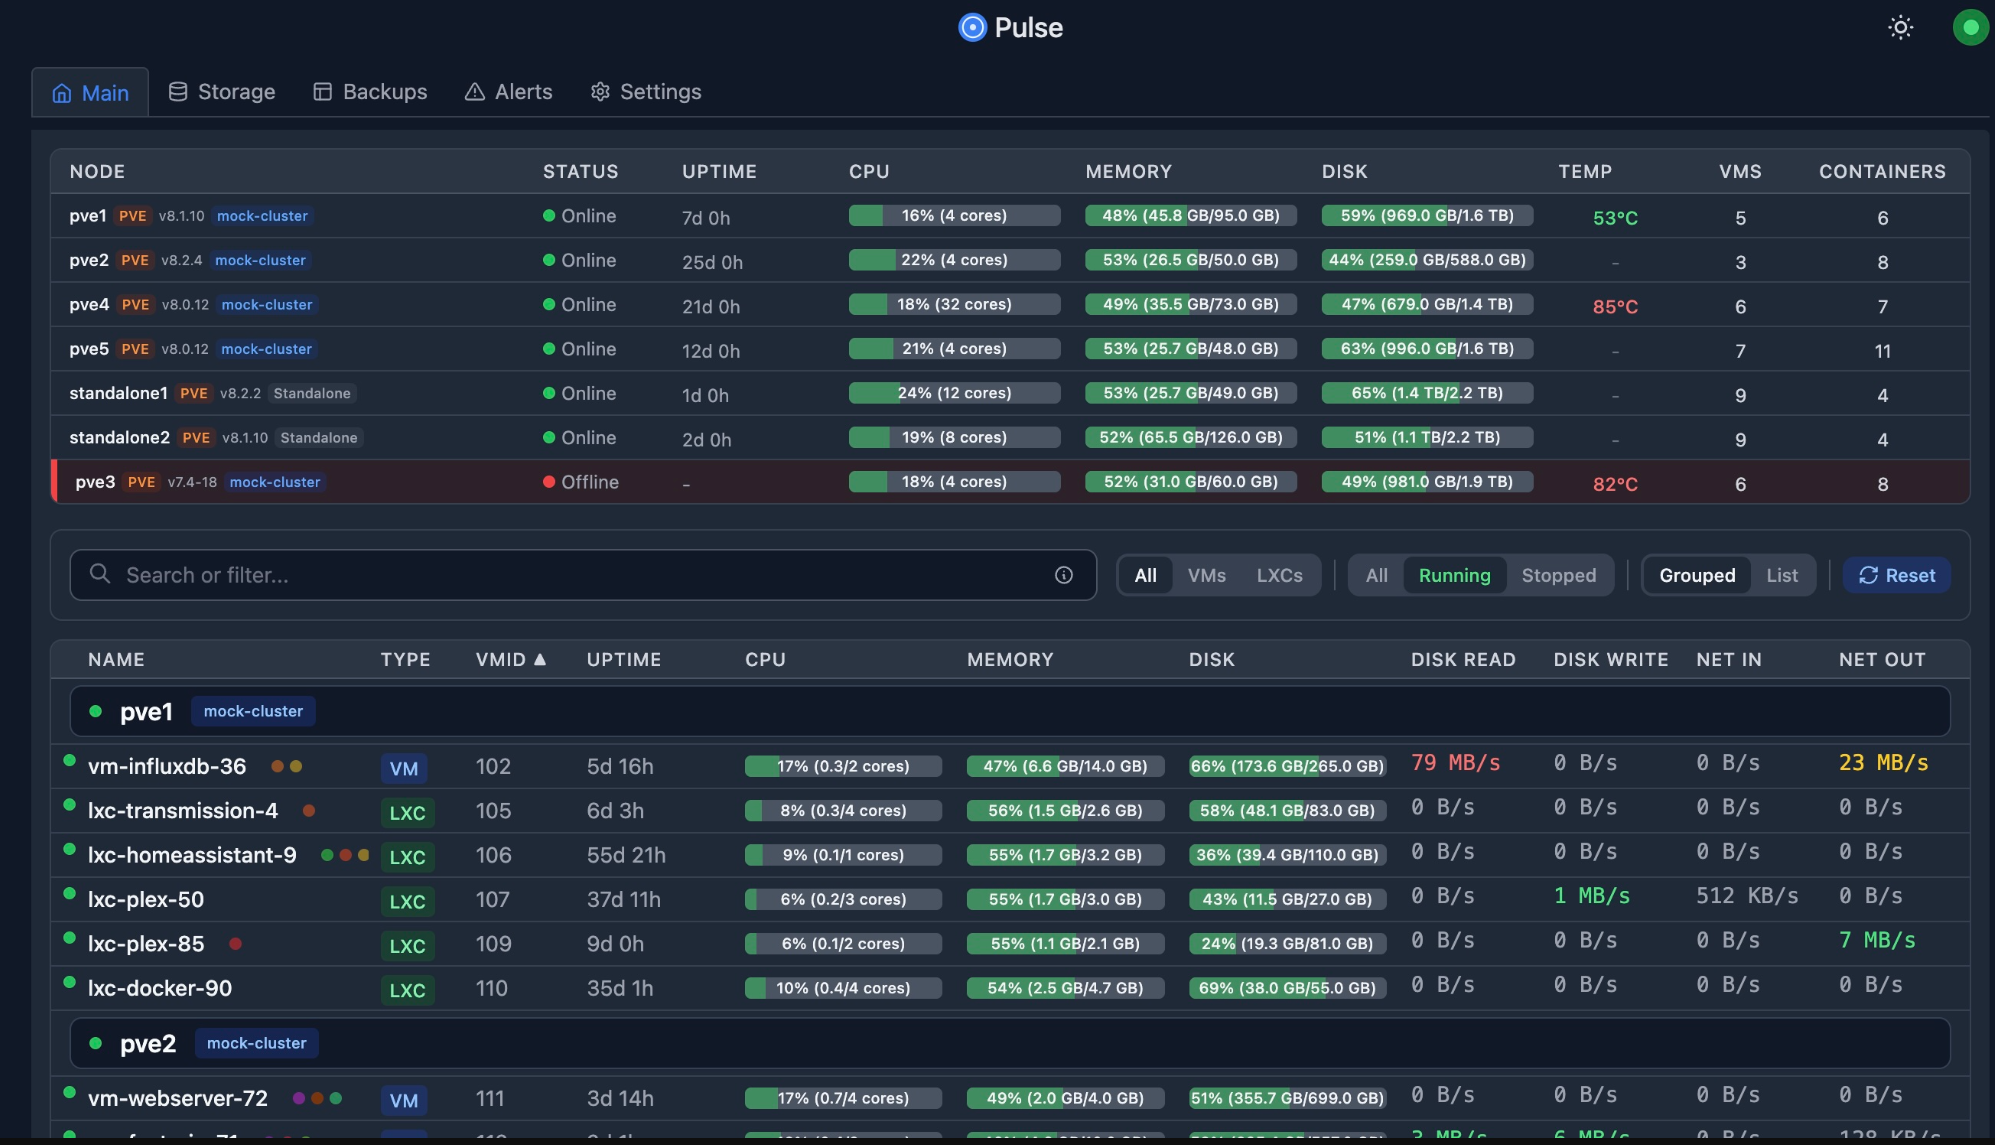
- Cluster monitoring – You can monitor Proxmox clusters
- Enterprise security – It has good security, including encrypted credentials, CSRF protection, rate limiting, secure sessions, and bcrypt password hashing
- Detailed audit logging – It tracks logins, configuration changes, and alert history
- Live monitoring – You can view real-time performance for VMs, containers, storage, and nodes
- Alerts to modern services – Get notifications using email or webhooks (Discord, Slack, Telegram, Teams, ntfy.sh, Gotify)
- Adaptive thresholds – You can set dynamic alert levels with customizable triggers and resets
- Alert timeline and analytics – It has an alert history, shows trends, and acknowledgment states
- Ceph integration – Ceph health, including pool utilization, and daemon status automatically
- Backup visibility – Get visibility of PBS backups, snapshots, and Proxmox backups with analytics
- Mail gateway insights – You can monitor mail volume, spam trends, and quarantine health for PMG
- Optional Docker monitoring – Lightweight agent support for container metrics
- Configuration management – Export and import encrypted configs with authentication
- Automatic updates – Safe, stable updates with rollback option
- Modern UI – Dark and light themes, responsive, built with Go for minimal resource usage
Installing Pulse monitoring in a Docker container
Installation is fairly simple. However, I ran into a bit of an issue with the Docker monitoring side that I will detail below. You can check out the official documentation for the project here: https://github.com/rcourtman/Pulse
Below is an example Docker compose file that I used in my home lab. I set the initial auth_user and auth_pass in the file like you see below. Also, I pre-generated an API token for agents/webhooks and this seemed to work as an initial seed of the API token.
# docker-compose.yml
services:
  pulse:
    image: rcourtman/pulse:latest
    container_name: pulse
    restart: unless-stopped
    ports:
      - "7655:7655"
    environment:
      # First-boot admin (plain text; Pulse will bcrypt-hash it internally)
      PULSE_AUTH_USER: admin
      PULSE_AUTH_PASS: Letmein1$

      # Pre-generated API token for agents/webhooks
      API_TOKEN: 1bd764fae4c664d7f6158a814f8bf718f9e32e0c88b85fadb3ae2980eeea05f8

      # Optional: limit network discovery scope (example)
      # DISCOVERY_SUBNET: "192.168.50.0/24"
    volumes:
      - /home/linuxadmin/homelabservices/pulse/data:/data
Now, just run the command:
docker compose up -d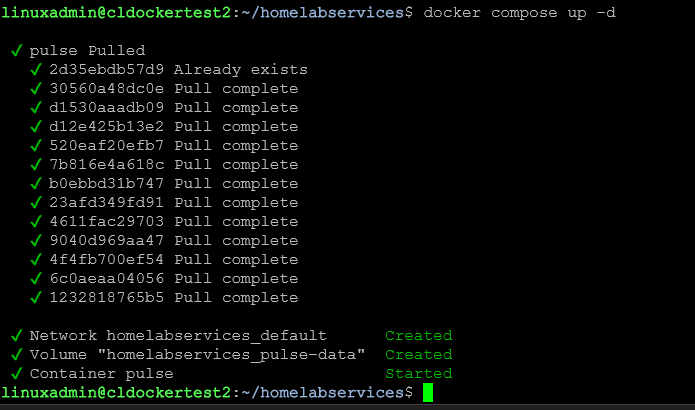
After the container spins up, you should be able to browse to port 7655 on your Docker host where you spun up the container.
This works just file to get Pulse up and running in Docker.
Adding a Proxmox node to Pulse monitoring
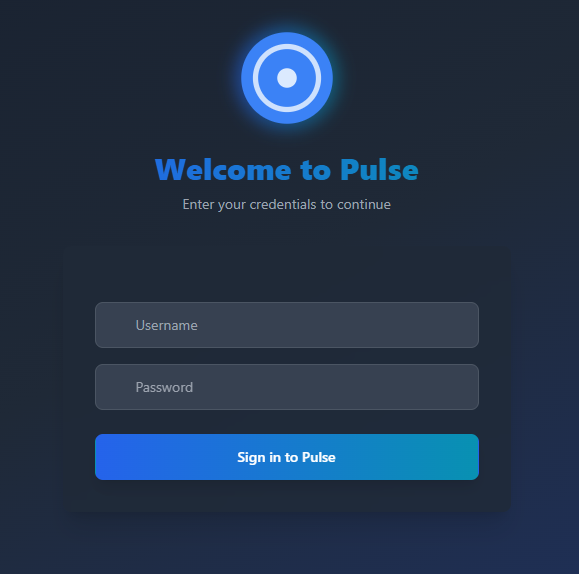
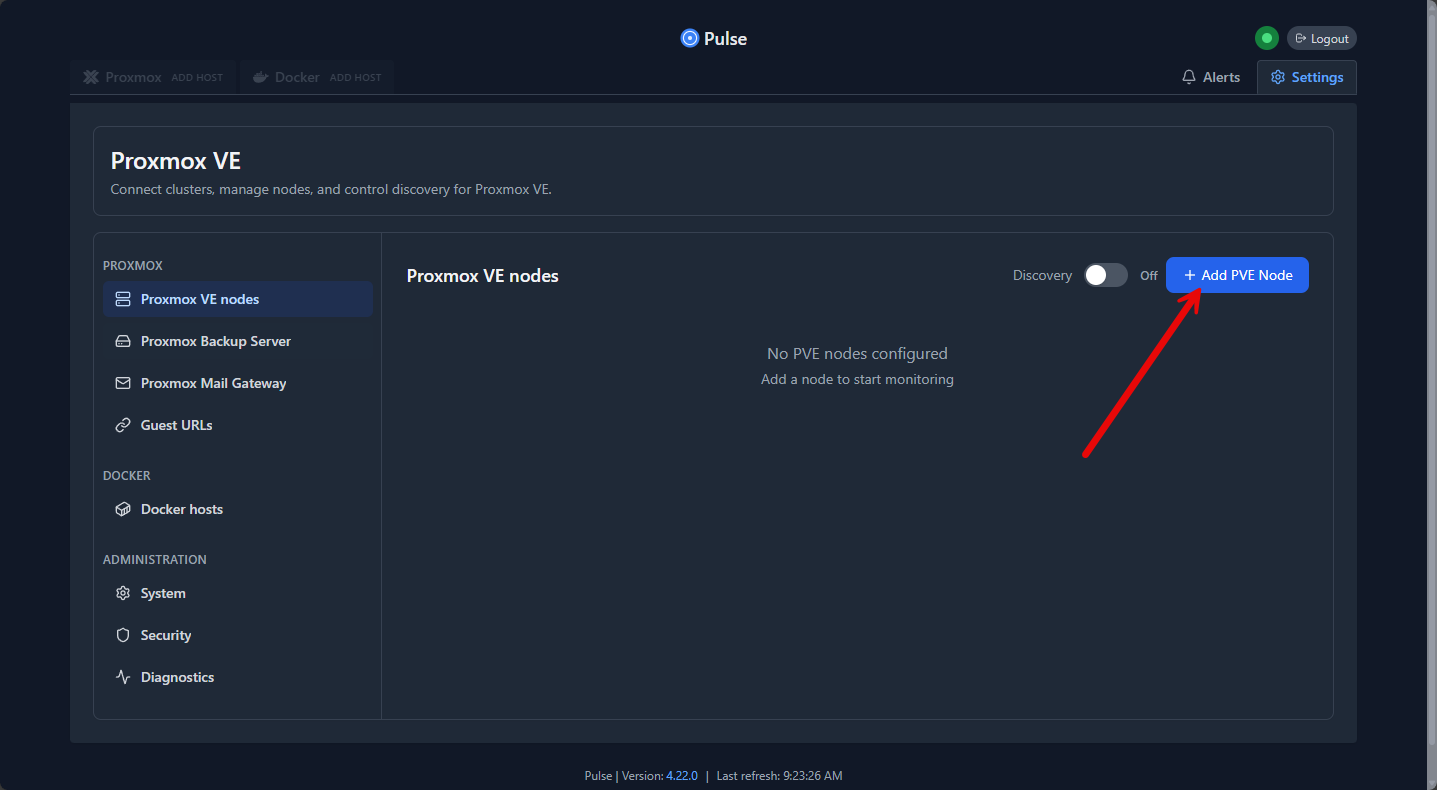
Now that we have Pulse up and running, we can add our first Proxmox node to the solution. Go to Settings.
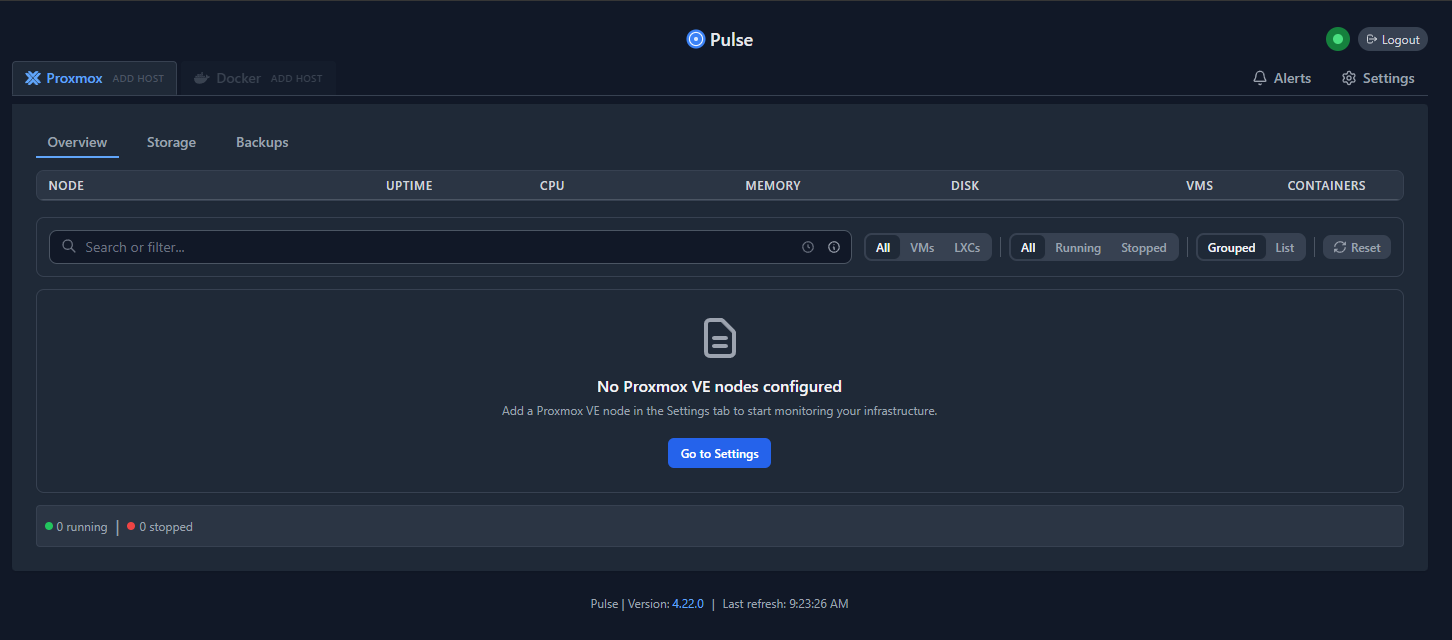
On Proxmox VE nodes we click the +Add PVE Node to begin the process to add a new PVE node.
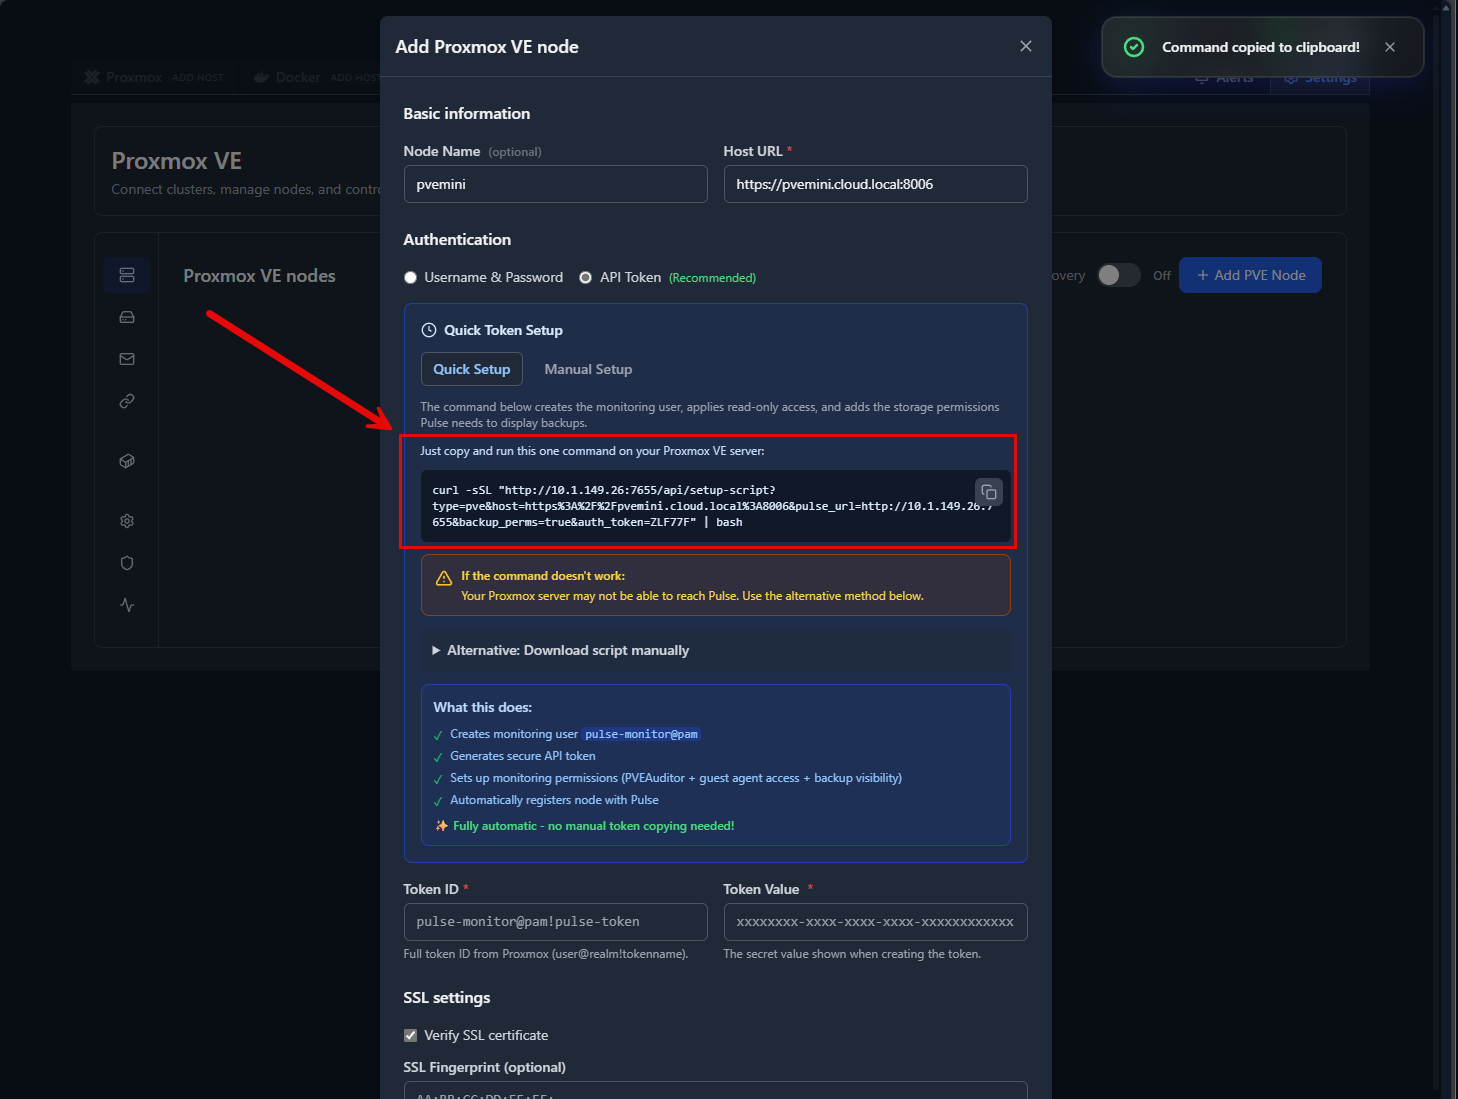
On the Add Proxmox VE node dialog box, we enter the Node Name and Host URL. You won’t see the command to copy unless you click the Copy button on the right of the box. Then the command will appear.
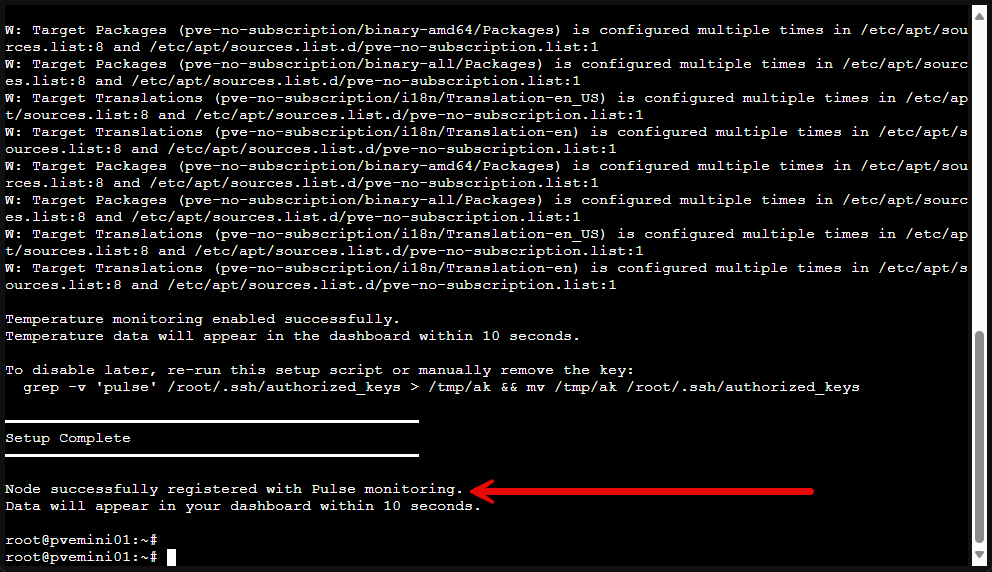
Now, I have copied the command and logged into the PVE host node, opened the shell prompt and pasted in the command. Run the command. You will see the script stop and prompt you if you want to Enable hardware temperature monitoring for this node? Enter Yes.
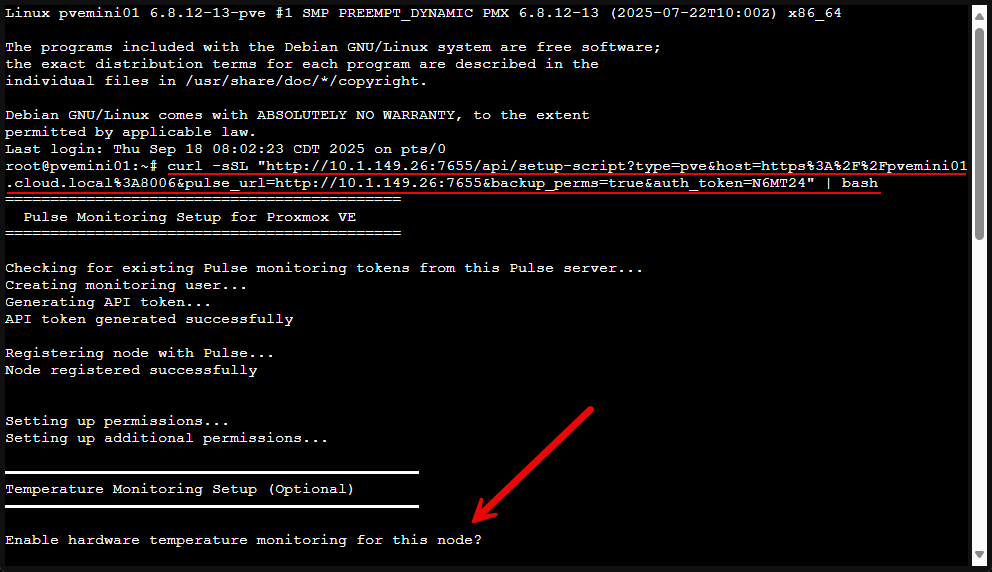
It will install the modules needed. Finally, we see the Node successfully registered with Pulse monitoring.
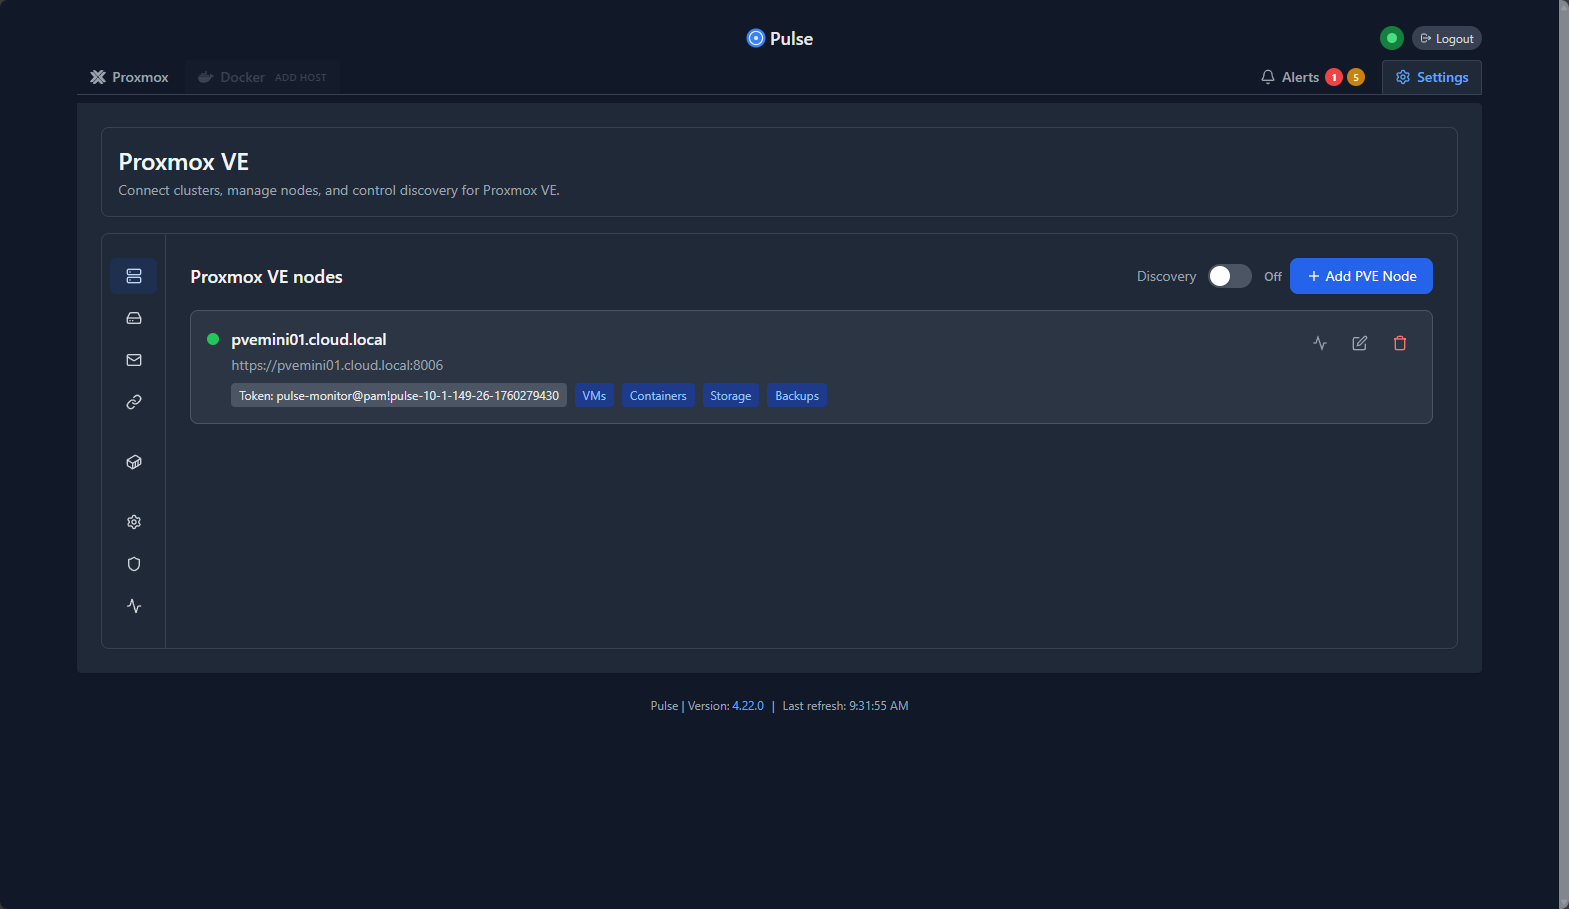
Now, we see the node listed in our PVE nodes.
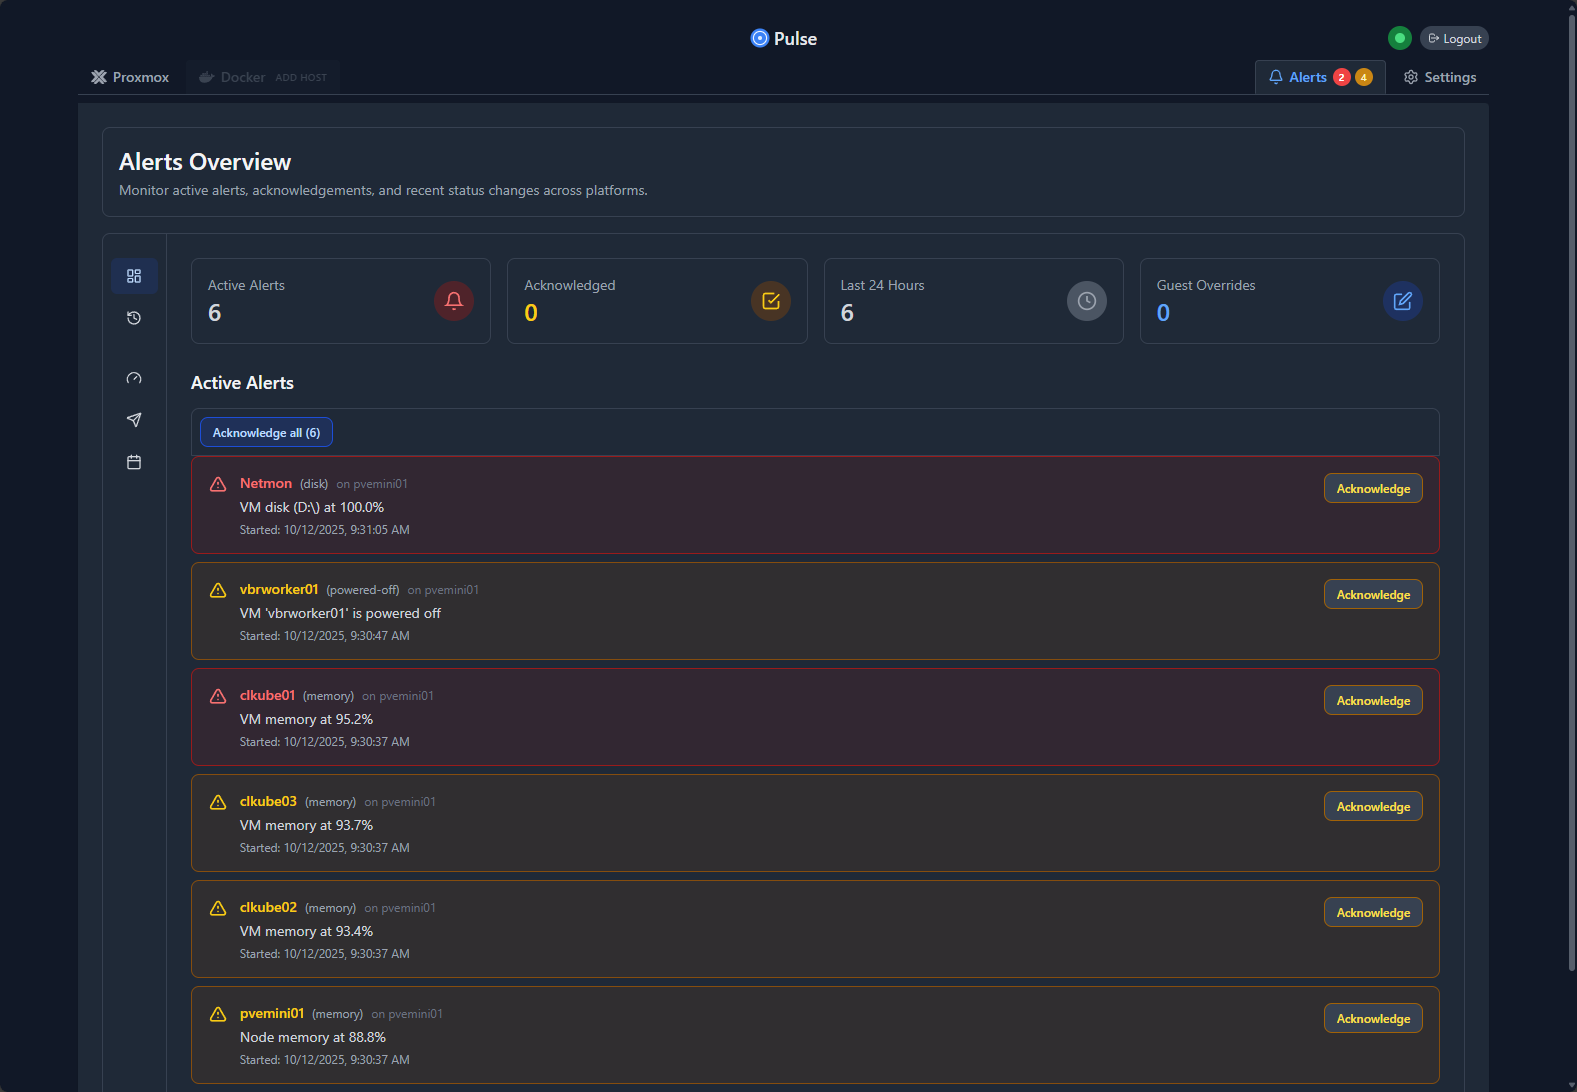
Right after adding the node to monitoring, we start seeing alerts that are triggered come through. Very good information like disk space alerts, memory pressure alerts, etc.
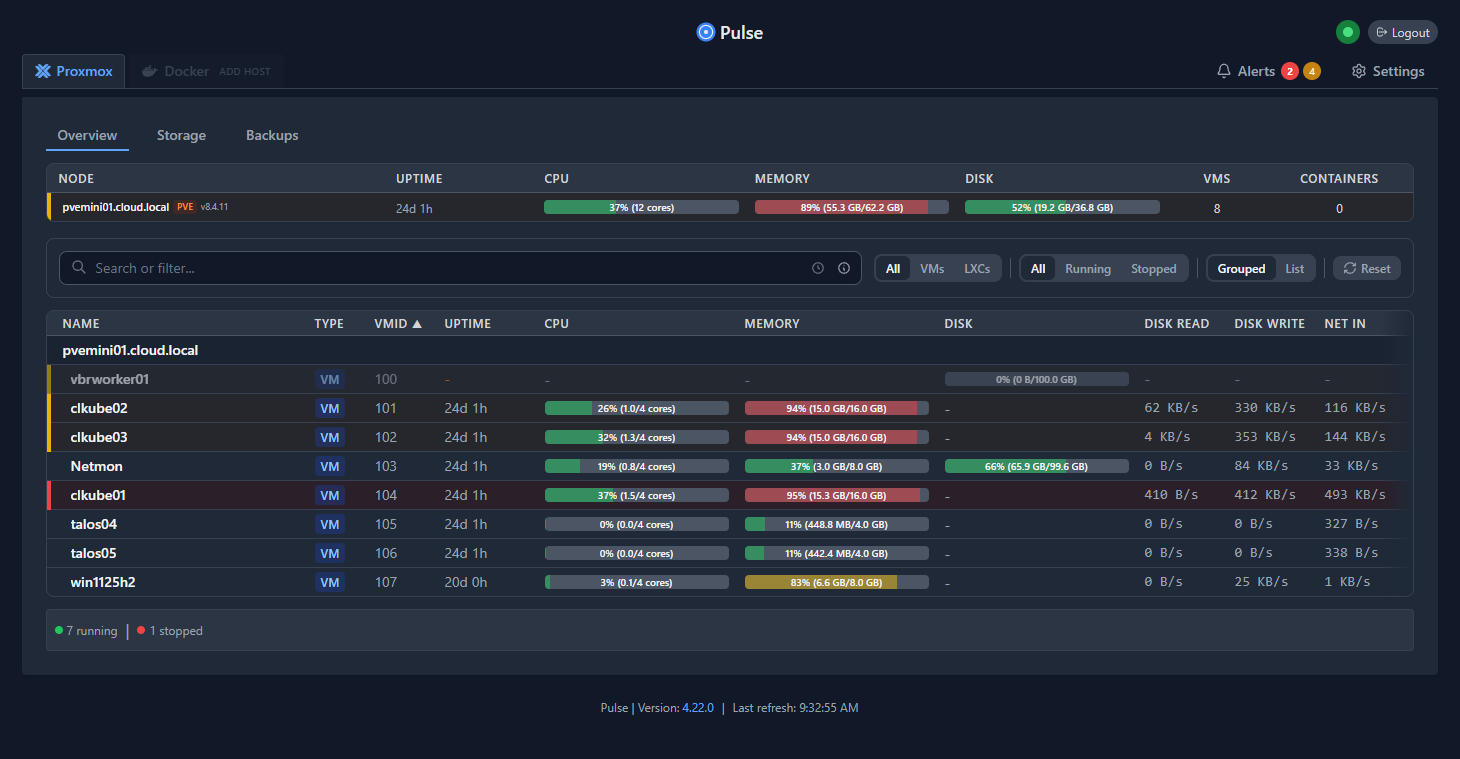
In the Overview page of the Pulse monitoring dashboard, we see the node and VMs listed. I think this view is really great. One downside to mention is you can’t really click on any of the VMs to “drill” into them. These are just non clickable stats, but they update in real-time. It would be great to see a future enhancement add this capability to drill into the virtual machines and node itself to get more granular details.
You also have a Storage view.
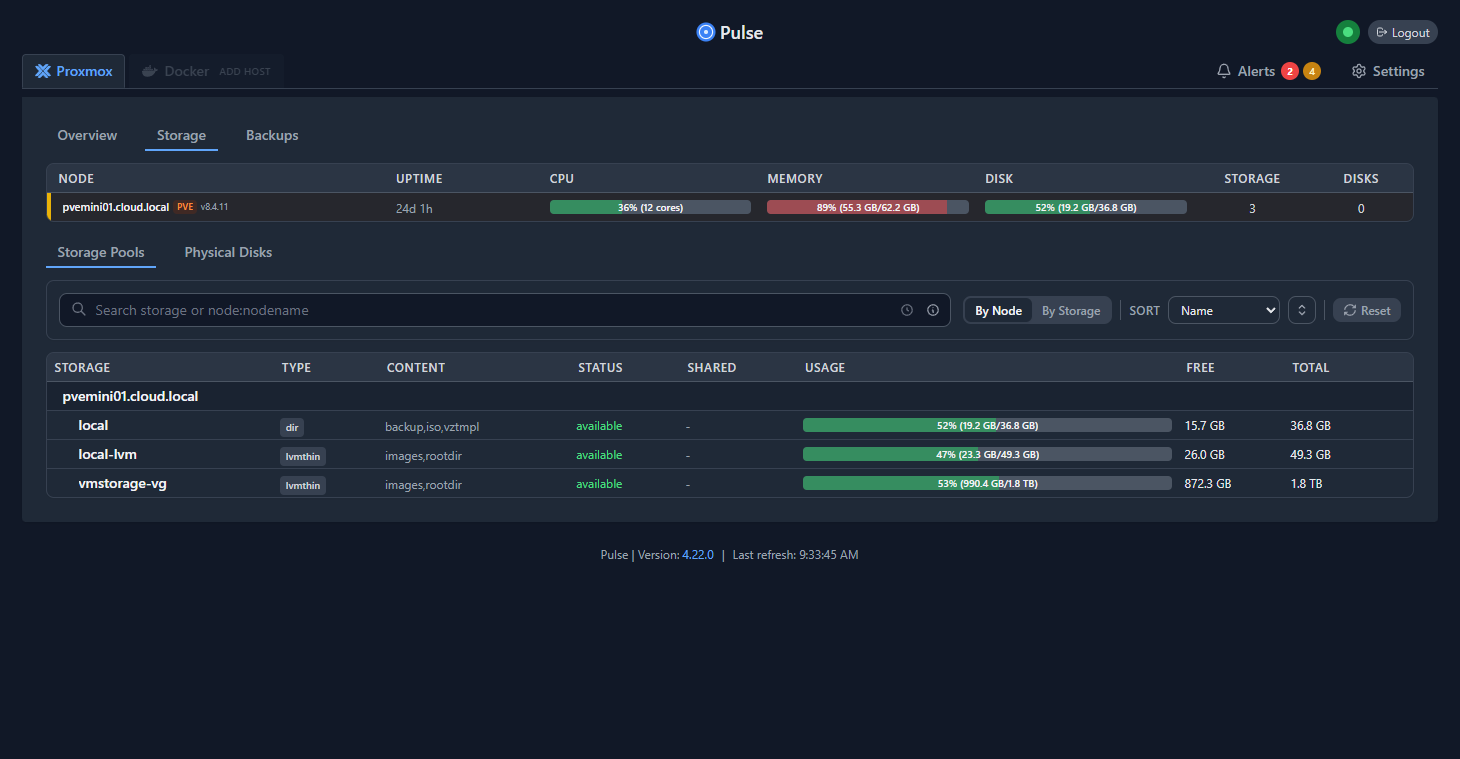
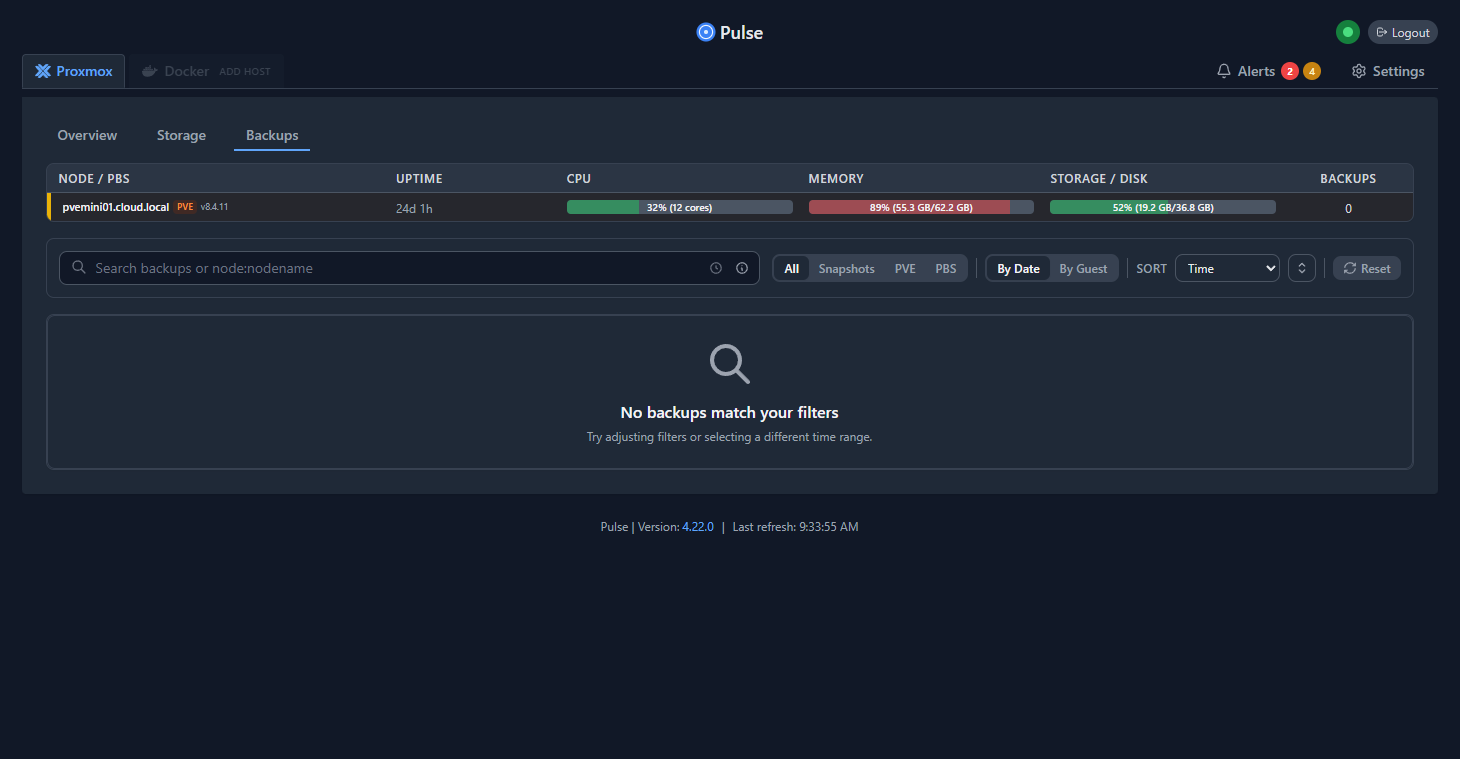
Then finally a Backups view.
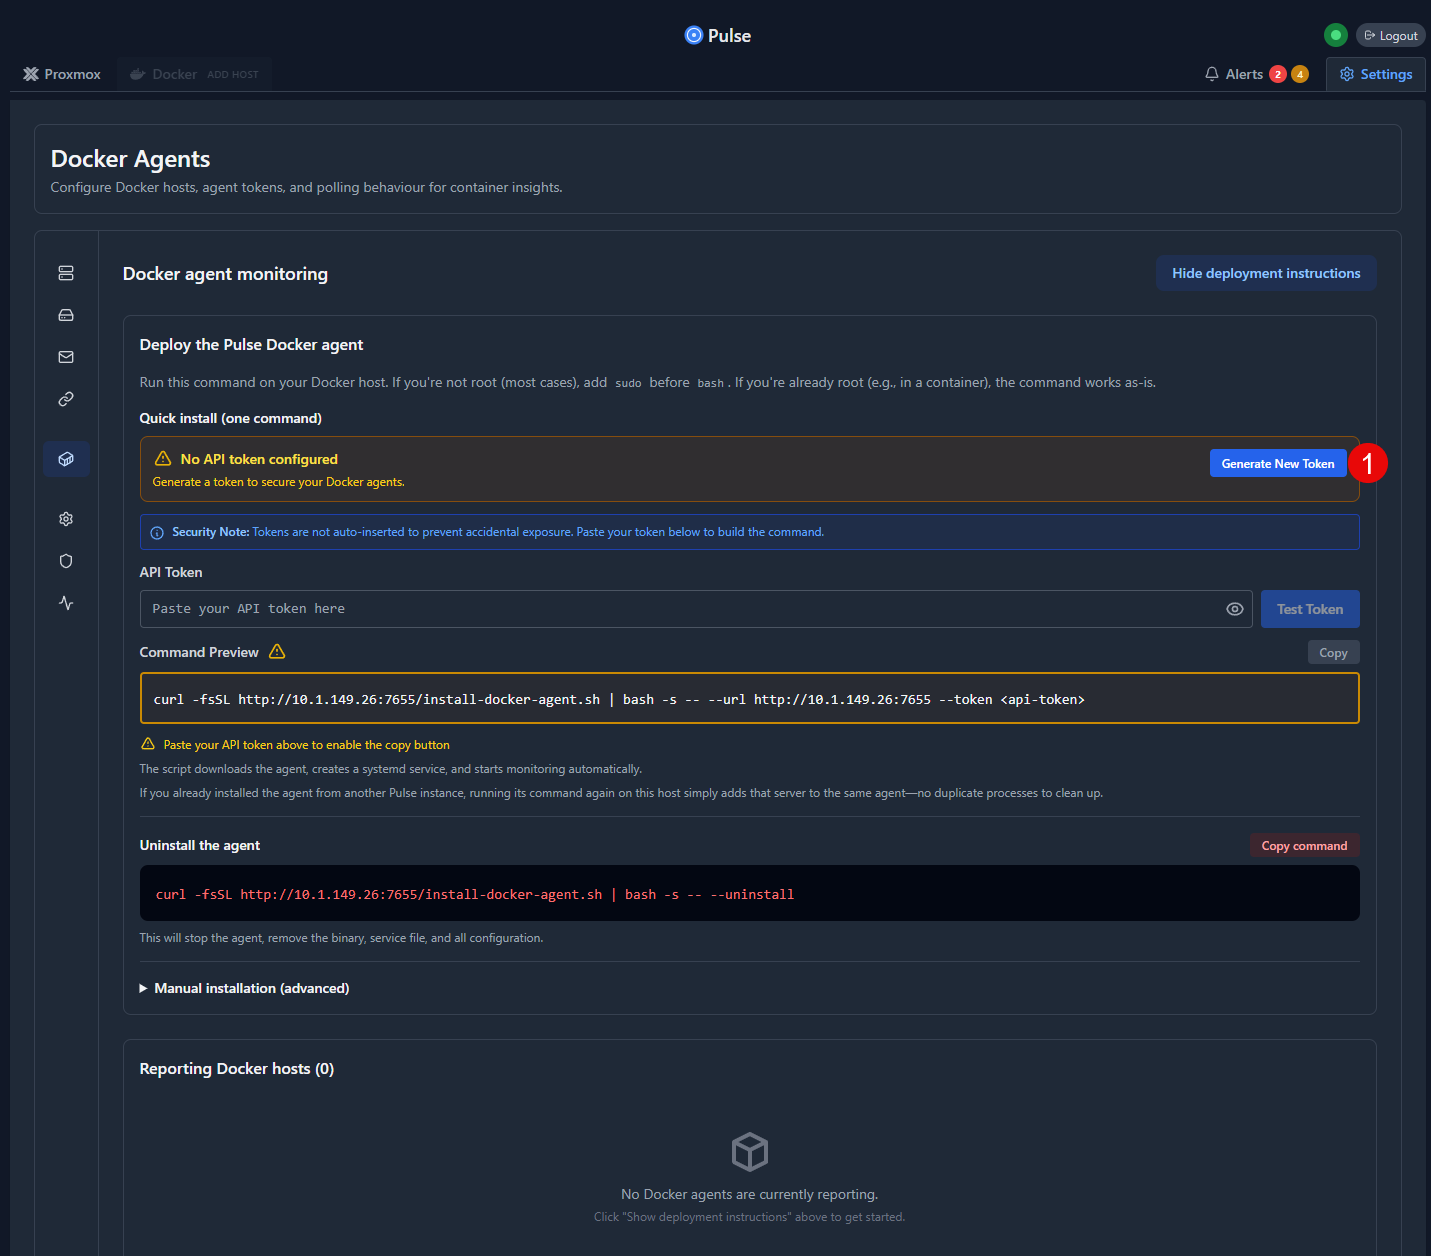
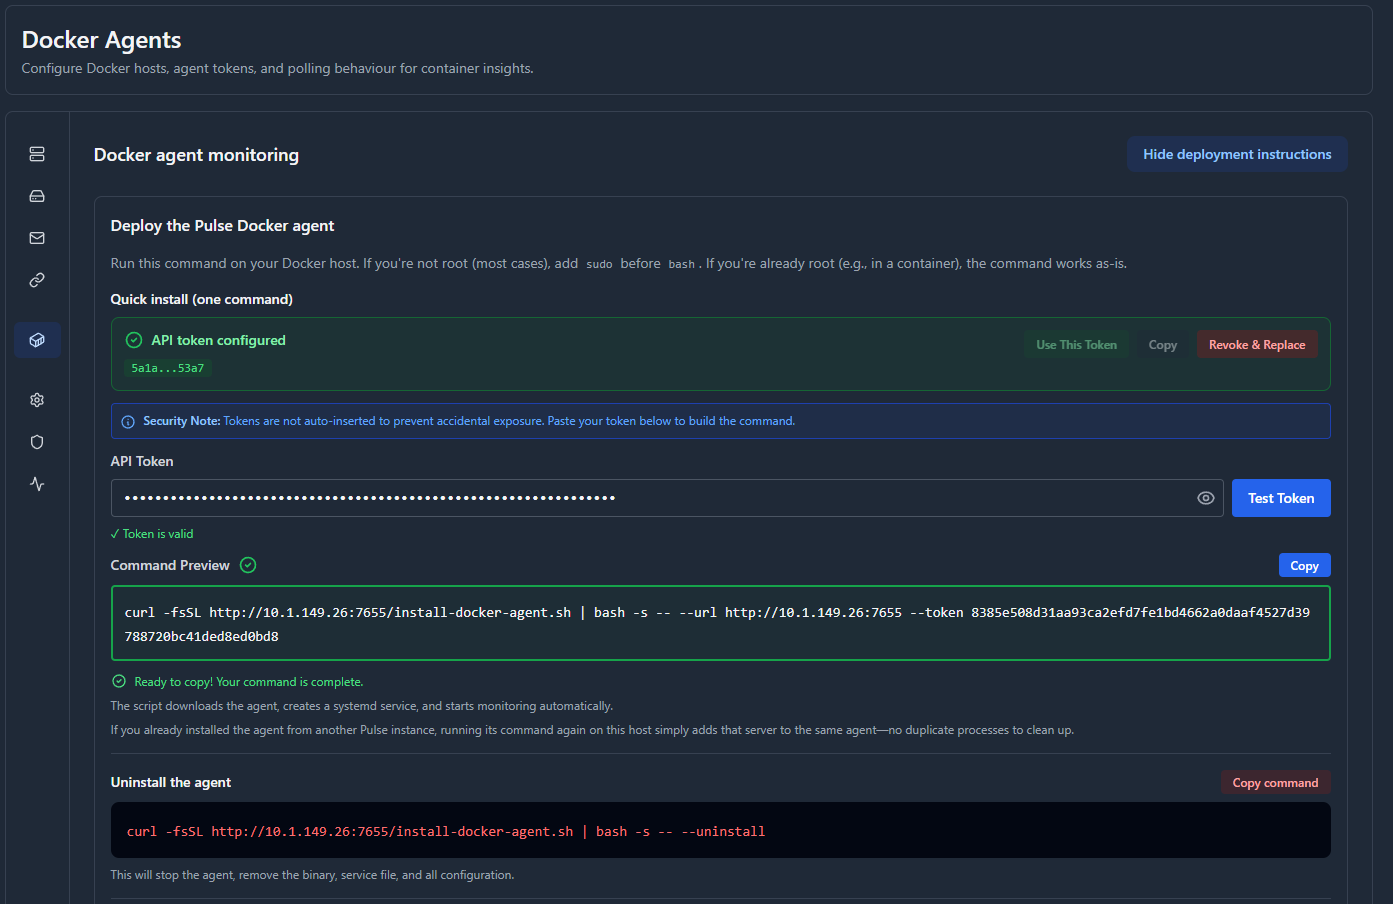
Adding a Docker host to Pulse
Now, the other side of the solution is visibility on your Docker containers running on Docker hosts. This is the monitoring that was a bit more cumbersome to spin up compared to Proxmox. It all came down to trickiness with the API key for some reason.
In the Docker compose code I have shown above, you can see the API token code:
API_TOKEN: 1bd764fae4c664d7f6158a814f8bf718f9e32e0c88b85fadb3ae2980eeea05f8This seems to work to get the container spun up. However, I couldn’t for some reason use this token for the Docker container API token piece to onboard a Docker host. I kept troubleshooting and it came down to needing to create an .env file in the data directory of Pulse in the Docker compose. I thought this was optional if you just wanted to use an .env file to protect your secrets. However, it looks like even if you use full Docker compose with the secrets configured in there, you still need an .env file with the information so it can use this to initialize the security “backend” of the container. Without this file, it will give you an error.
So, what I did was change to the data directory and created the file there with these commands:
# Navigate to your Pulse data directory
cd /home/linuxadmin/homelabservices/pulse/data
# Fix permissions if needed
sudo chown -R linuxadmin:linuxadmin /home/linuxadmin/homelabservices/pulse/data
# Create the .env file
sudo tee .env > /dev/null << 'EOF'
PULSE_AUTH_USER=admin
PULSE_AUTH_PASS=Letmein1$
API_TOKEN=1bd764fae4c664d7f6158a814f8bf718f9e32e0c88b85fadb3ae2980eeea05f8
EOF
# Restart Pulse
cd /home/linuxadmin/homelabservices/pulse
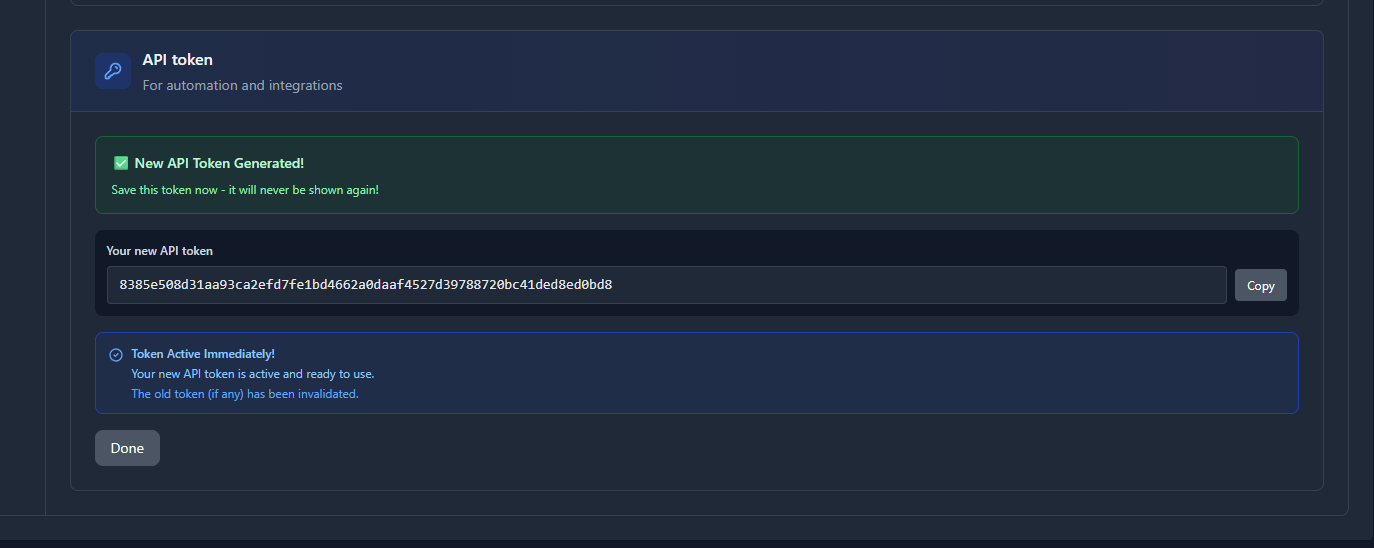
docker compose restartNext, I was able to navigate to the Settings > Security configuration inside the UI and Generate New Token from that screen.
However, the command running on a Docker host, resulted in this error. The package seemed to not be found.
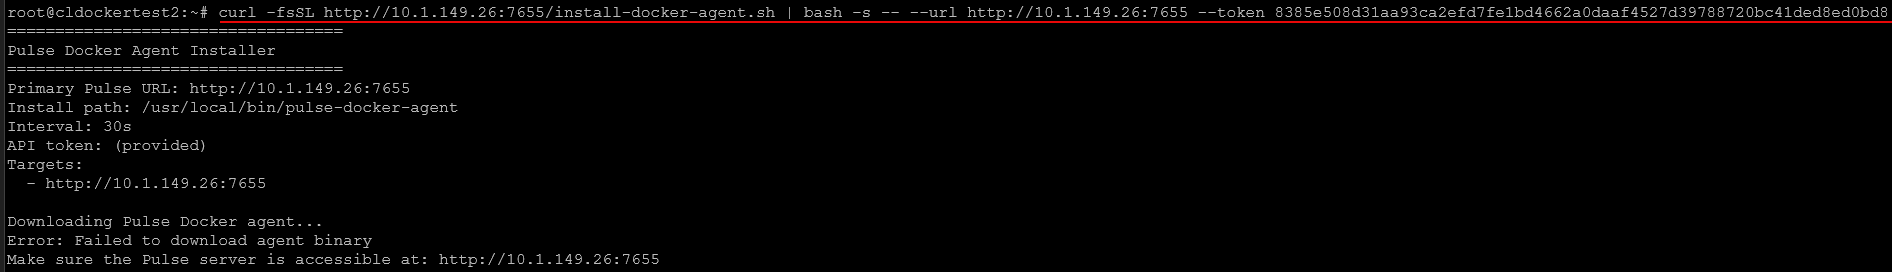
Workaround: Manually download the agent and created the systemd service
Instead, I found the workaround was to manually download the agent from GitHub and create the systemd service to go along with it.
Download the agent:
# Download the agent from GitHub releases
cd /tmp
wget https://github.com/rcourtman/Pulse/releases/download/v4.22.0-rc.1/pulse-v4.22.0-rc.1-linux-amd64.tar.gz

# For ARM64 systems, use:
# wget https://github.com/rcourtman/Pulse/releases/download/v4.22.0-rc.1/pulse-v4.22.0-rc.1-linux-arm64.tar.gz

# Extract the archive
tar -xzf pulse-v4.22.0-rc.1-linux-amd64.tar.gz

# Install the agent binary
sudo cp ./bin/pulse-docker-agent /usr/local/bin/
sudo chmod +x /usr/local/bin/pulse-docker-agent

# Verify installation
/usr/local/bin/pulse-docker-agent --help
Create the Systemd service. Below just change the specific environment URLs in the systemd service for your environment.
sudo tee /etc/systemd/system/pulse-docker-agent.service > /dev/null << 'EOF'
[Unit]
Description=Pulse Docker Agent
After=network.target docker.service
Requires=docker.service

[Service]
Type=simple
Environment=PULSE_URL=http://10.1.149.26:7655
Environment=PULSE_TOKEN=8385e508d31aa93ca2efd7fe1bd4662a0daaf4527d39788720bc41ded8ed0bd8
ExecStart=/usr/local/bin/pulse-docker-agent --interval 30s
Restart=always
RestartSec=5

[Install]
WantedBy=multi-user.target
EOF
Start and enable the service on your Docker host:
# Reload systemd to pick up the new service
sudo systemctl daemon-reload
# Enable the service to start on boot
sudo systemctl enable pulse-docker-agent
# Start the service
sudo systemctl start pulse-docker-agent
# Check the status
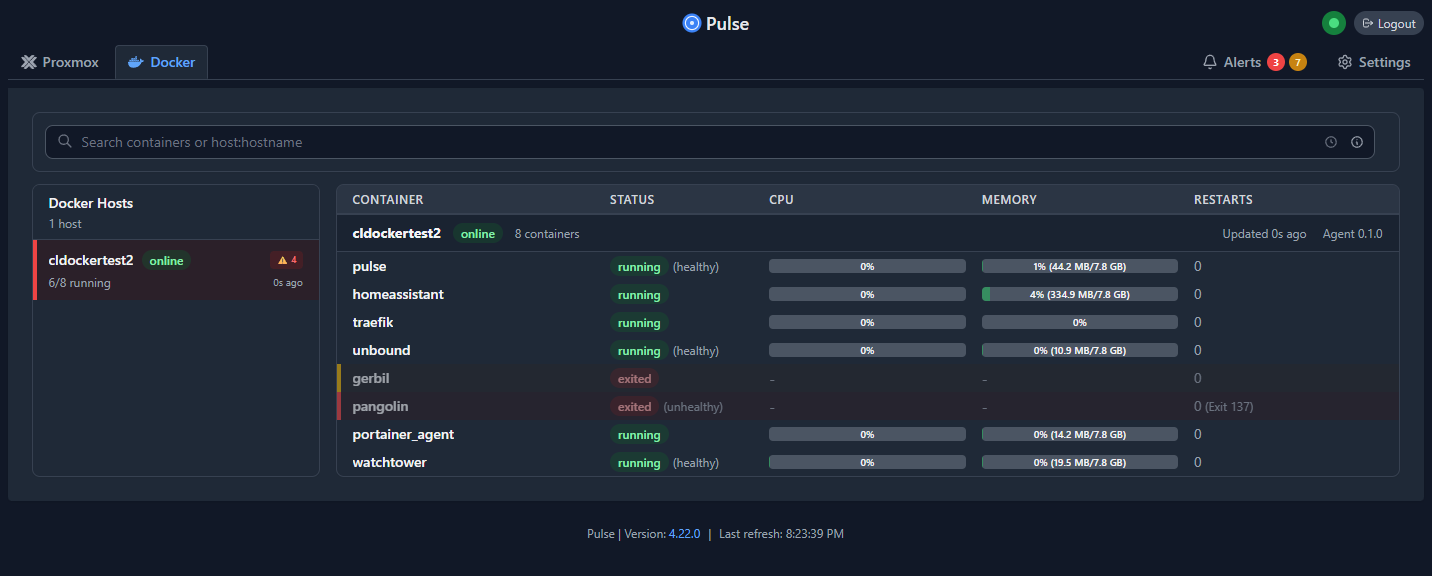
sudo systemctl status pulse-docker-agentAfter downloading the agent from the repo and starting the service using the commands above, I was able to see it show up in the Pulse Docker dashboard.
Why Pulse is a good fit for Proxmox and Docker monitoring in the home lab
I think this is a great solution for monitoring your home lab running on Proxmox and Docker. I think most right now in their home labs are hosting things in Proxmox as virtual machines or LXC containers or in Docker containers for applications.
Pulse is small, lightweight, and it is an efficient solution for monitoring that doesn’t run into a lot of complexity. You don’t have to install other clients or tools to view the monitoring data.
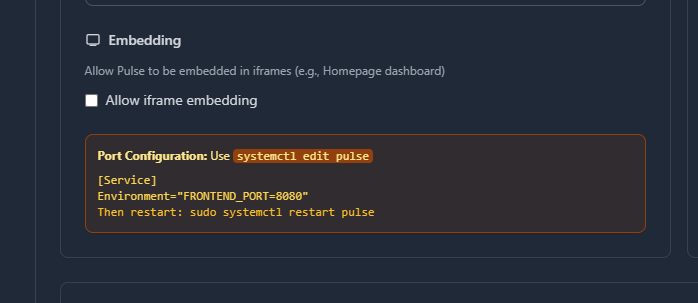
Also, you can turn on an option to view metrics in iFrame for home lab dashboards, which I thought is a really nice feature:
How it compares with other Proxmox monitoring solutions
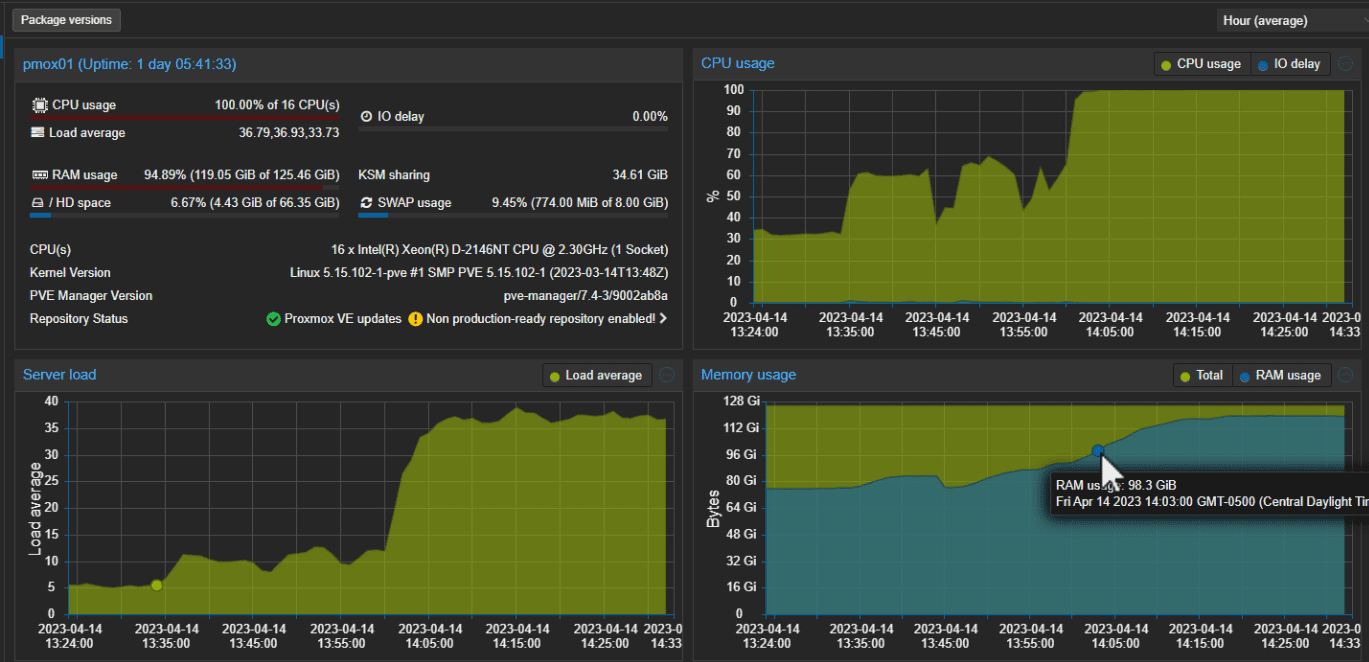
Proxmox has a basic set of graphs and statistics, but these are limited in what they can show. If you want more than the basics, the typical route is to try something open-source like Prometheus and Grafana, which are awesome tools for Promox monitoring. I have a blog covering it here: InfluxDB Grafana Docker-Compose Configuration: Proxmox Monitoring Example.
Another great tool is Netdata, which provides system-level metrics and alerts. However, it does not have built-in awareness of Proxmox clusters or virtual machines natively. You can have it monitor Debian Linux which Proxmox is built on. Also, Netdata does natively monitor Docker.
I think the advantage here with Pulse is it is designed from the ground up for Proxmox. So it understands the platform’s structure and automatically maps nodes, VMs, and containers. It also is extremely efficient compared to other platforms. Just with a single container you can monitor Proxmox, VMs, LXCs, and Docker containers.
Video overview
Wrapping up
This is a great new option for monitoring your Proxmox environment that is built expressly for Proxmox. Also, you have Docker monitoring built-in as well. So, all-in-all, I think most home labbers are steering towards Proxmox for self-hosting and of course Docker for containerized applications. This makes this a monitoring solution that has an almost perfect balance of functionality that most would be looking for in their home lab. Let me know in the comments if you have tried Pulse out for Proxmox. What are your thoughts? What are you currently using?
Google is updating how articles are shown. Don’t miss our leading home lab and tech content, written by humans, by setting Virtualization Howto as a preferred source.
About The Author


Amazing, I can’t wait to try this one for sure. Been looking for something like this that is easy to setup but monitors proxmox and docker.
Will this monitor Kubernetes clusters?
jakeby2817,
No it is just standard Docker servers at this point. However, you could probably get visibility on a Swarm cluster.
Brandon
Hello, thanks for the guide, I’m evalutating Pulse vs Beszel.
Does docker monitoring work in Pulse even if I install it in an LXC?
Thanks. Best regards
Daniele,
Glad the guide was helpful! I have also been meaning to try out Beszel as it also looks like a great FOSS tool for monitoring Proxmox/Docker. Yes, I don’t see an issue with hosting it in an LXC to monitor Docker. The Docker side is monitored with an agent so the agent just communicates back to the Pulse instance regardless of where it is running or what technology it is hosted in.
Brandon
I also want to try out Beszel.
I switched from beszel to pulse while ago and it’s been fantastic for me especially with many nodes
CJKaufman
Nice to know! It seems like Pulse is gaining steam in the community. Definitely one to keep an eye on and see how it continues to grow. Thank you for your feedback!
Brandon
A really good tool; I’d like some option in Pulse to monitor logs. Anyway, I’m asking, is there a free alternative for this that doesn’t consume so many resources? I know about OpenObserve and VictoriaLogs, but are there more?
Regards
jiriarte000,
You are meaning for logs monitoring? I would definitely check out grafana/loki. I have a write up on this: https://www.virtualizationhowto.com/2022/11/grafana-loki-configuration-syslog-server-for-home-labs/
Brandon
i tried to install but it ends here. Tried a few times and it end up the same.
Jasri,
What version of Proxmox are you running?
9.0.3. I install on the other 9.0.3 node it was ok.
Anywhere i can check or any install log that i can look into?
Jasri,
Check these two and see if it actually got to the point of installing the service and if there are any errors in the logs:
@Brandon, I followed your install guide above and found that the easiest for beginners Docker agent install was to use:
https://github.com/rcourtman/Pulse/blob/main/docs/DOCKER_MONITORING.md#containerised-agent-advanced
docker run -d \
–name pulse-docker-agent \
-e PULSE_URL=”https://pulse.example.com” \
-e PULSE_TOKEN=”<token>” \
-e PULSE_TARGETS=”https://pulse.example.com|<token>;https://pulse-dr.example.com|<token-dr>” \
-v /var/run/docker.sock:/var/run/docker.sock \
–restart unless-stopped \
ghcr.io/rcourtman/pulse-docker-agent:latest
Adjust the docker run values (pulse defaults to http) above and remove the additional targets if only one installation of pulse, this takes a few seconds and creates a reporting container on your Docker installations. Within a few minutes data starts populating for all docker containers.
Victor,
That is great to know! Thank you for sharing this and I will make note in the post of your notes here to help others hopefully avoid the issue I ran into.
Brandon