Monitor and Troubleshoot VMware vCenter Server VCSA Performance
At times we run into performance or other issues with VMware vCenter Server or we want to monitor system resources on the vCenter appliance itself. There are nice new tools built into the new VMware vCenter 6.5 Server VAMI interface on the VCSA appliance that allow us to quickly and easily see CPU and Memory metrics as well as Database metrics including DB usage. Let’s take a look at the new VAMI interface performance monitoring and metrics as well as a couple areas of interest in the vSphere web client where we can take note of ways to monitor and troubleshoot VMware vCenter Server VCSA Performance.
New VCSA 6.5 VAMI Interface Performance Monitoring
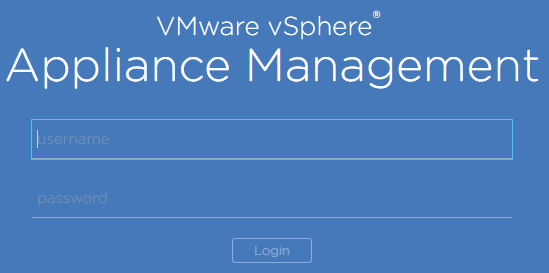
As mentioned above, there are a couple of areas we can look at to see health, performance, and utilization related statistics. Starting with The first thing we need to do to take advantage of the new performance monitoring and utilization tools with the VCSA 6.5 appliance is login to the VAMI interface. You can do that by navigating to the https://<yourvcsaIP>:5480.
As we look in the left hand pane, we can see the CPU and Memory menu. When we click the menu, we see the graphical display of the CPU and memory utilization.
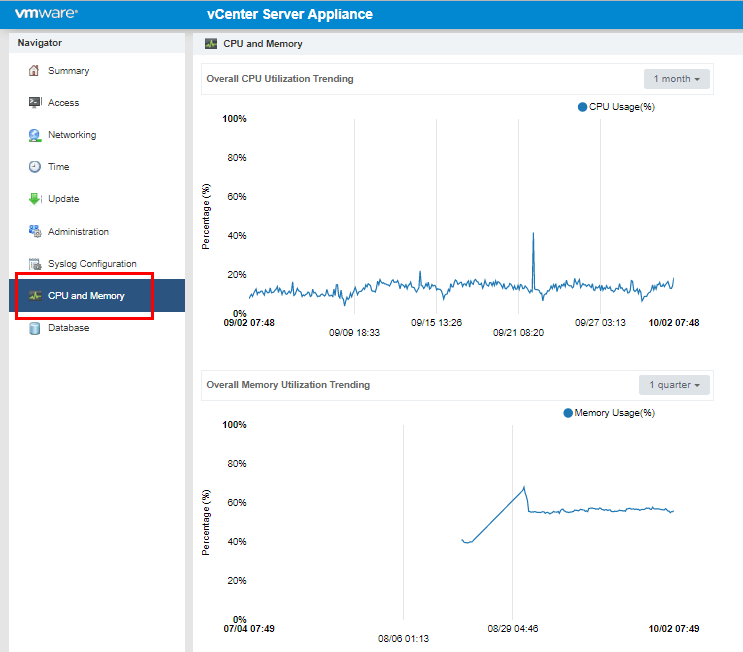
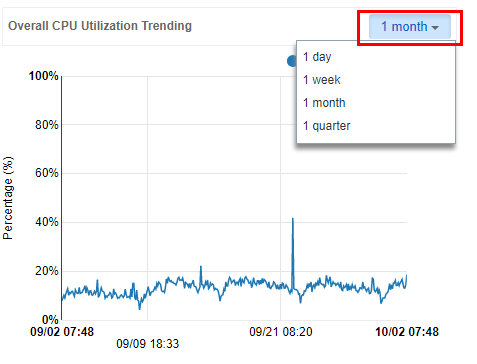
The great thing about the Utilization is we have historic data we can view. The drop down combo box allows us to select 1 day, 1 week, 1 month, 1 quarter for all the graphs.
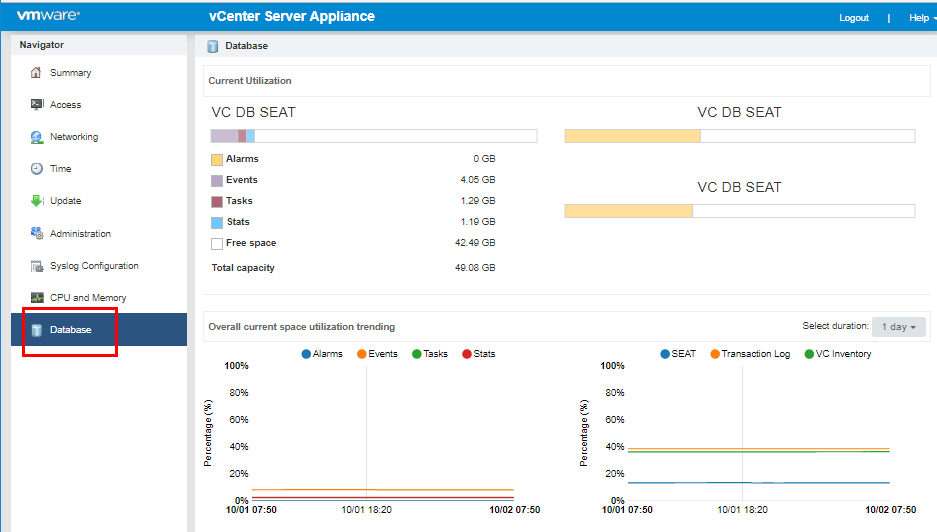
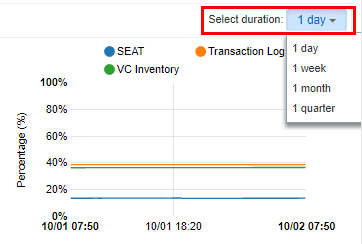
When viewing the Database menu, we see the utilization of the VC DB Seat. We have the sizes listed for Alarms, Events, Tasks, Stats as well as the current space utilization trending. Additionally we have the drop down box we can select the historic information for the DB as well.
The dropdown box allows us to select the same 1 day, 1 week, 1 month, 1 quarter increments. This can be helpful to trend certain utilization issues.
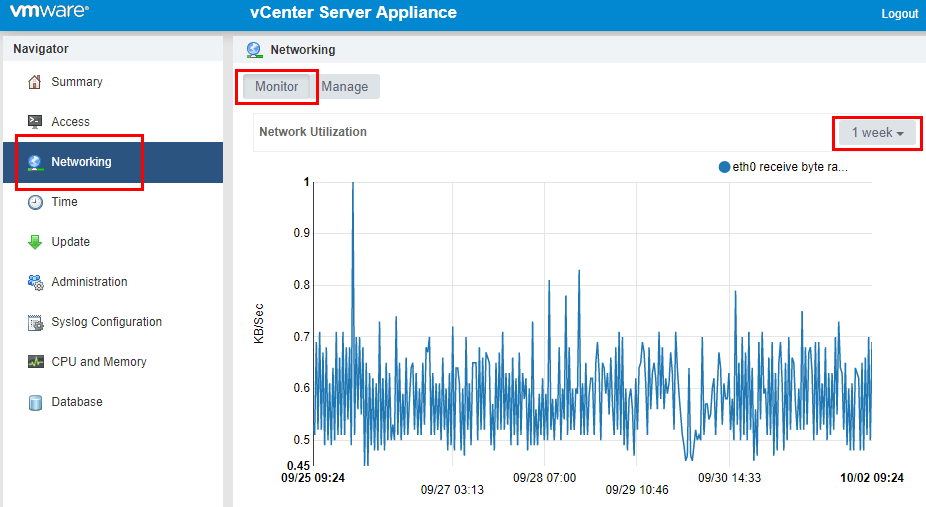
Additionally, you can see the network utilization for the VCSA appliance which is really nice. If you are troubleshooting network performance related issues, this can be a especially helpful to see if there have been drastic utilization changes recently.
Using the vSphere Web Client to analyze VCSA performance and troubleshoot
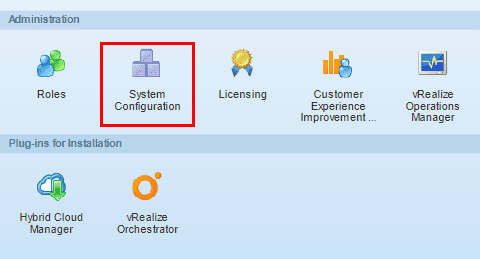
There is another very useful location that many may not have utilized in the vSphere web client, called the System Configuration that gives a good overview of vSphere vCenter server performance and health. On the Home screen of the web client, click the System Configuration button.
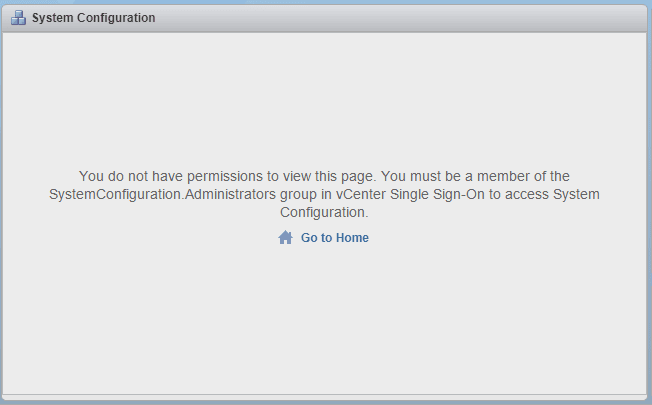
If you receive the message below about not having permissions to view this page, you need to add the user you are logging in with to the SystemConfiguration Administrators Group or alternatively you could login with the SSO administrator to view the page.
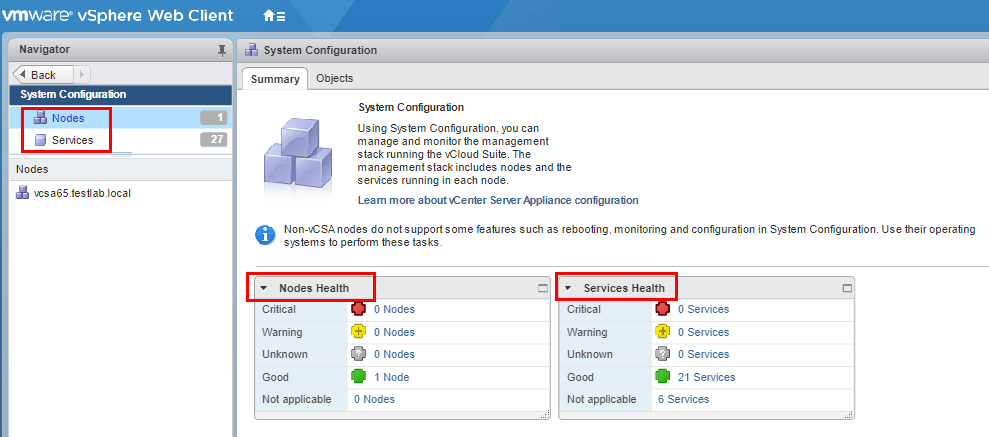
On the left, when you access the page, you will see the Nodes and Services menus. On the right hand pane, you will see the Nodes Health as well as the Services Health. This is a quick way to see any issues with the vCenter server appliance configuration, etc.
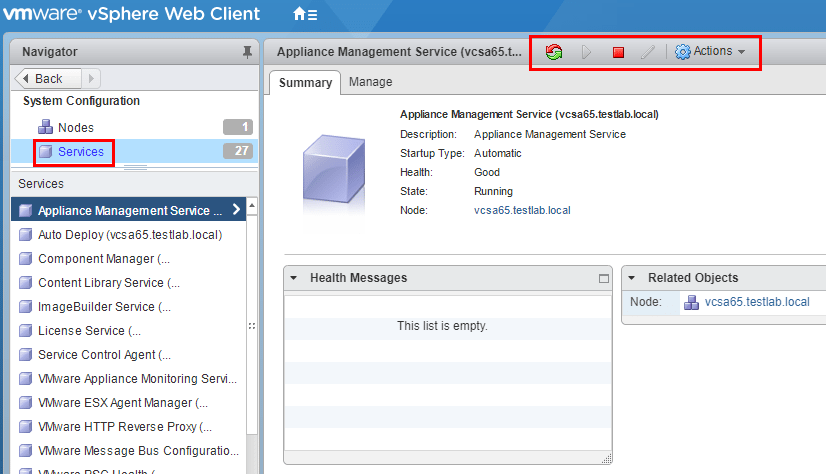
On the services menu, this is a great graphical tool to see vCenter server services and their status. Additionally, you can restart, stop, edit startup type, etc, from this screen.
Thoughts
Troubleshooting vCenter Server can be much easier now with the new tools built into the VAMI interface of the VCSA 6.5 appliance including the ability to see the utilization of CPU, memory, database, and network of the VCSA appliance. You can see historical information as well for each of the aforementioned metrics. Also, leveraging the System Configuration area of the web client can be a great quick way to see overall system health and performance as well as troubleshoot services that may not be running, etc.