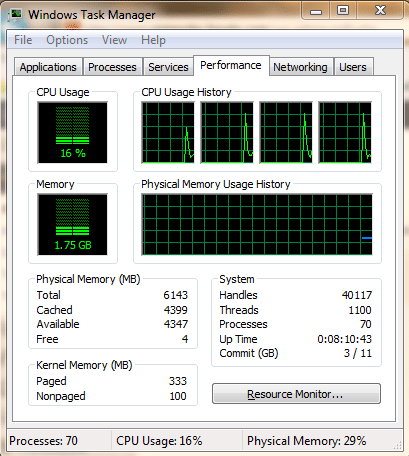
We are all familiar with tools such as TaskManager to troubleshoot performance issues on our Windows PCs and workstations. However, there is an often underutilized built-in tool in Windows that provides valuable information that is very useful in troubleshooting performance issues. The tool is Resource Monitor.
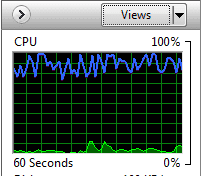
Resource Monitor provides a much nicer interface when compared to task manager. It is more of an MMC formatted app that is easily laid out to provide information about the major components of your computer’s performance including:
- CPU
- Memory
- Disk
- Network
There is also an overview mode which consolidates information panes from each of the above areas into one tab for easy viewing and troubleshooting.
Task manager definitely has its place in providing information about services and users along with running processes and applications, however task manager doesn’t provide information about areas such as disk performance. Oftentimes, disk I/O problems are at the heart of performance issues. Being able to pinpoint what application or process is tagging your disk is often the key to troubleshooting performance issues.
In fact, in Windows 7, Resource Monitor is actually available from the task manager “Performance” tab which makes it easy to being troubleshooting from Task Manager and then move on to Resource Monitor if the need be. However, if you want to get to the application directly, simply type resmon at a run/search menu.
Taking a look at the Disk performance options
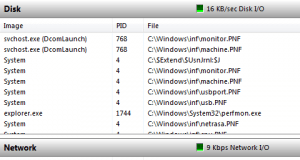
In looking at Disk performance, which we are going to key in on here, the default information provided shows information about key disk performance areas such as:
- Image name
- PID
- File location
- Read (B/sec)
- Write (B/sec)
- Total (B/sec)
- I/O Priority
- Response Time
Google is updating how articles are shown. Don’t miss our leading home lab and tech content, written by humans, by setting Virtualization Howto as a preferred source.


