I am all about project-based learning and also all about Linux! If you’re anything like me, the weekend is when you are able to get some of your best home lab learning done. It is super satisfying to improve just one area of your lab environment by spending an hour or two deploying a new tool, streamlining a process, or something else. If you are looking for a productive weekend project, here are 9 Linux management tools that have earned a permanent place in my home lab and I think you will gain value from deploying these too. Take a look!
Cockpit
If there is a tool that is known for Linux management, Cockpit is that tool. It has been around for many years now, but I think it is one of those tools that many home lab enthusiasts might actually overlook as to how helpful it actually is. After you get it up and running you quickly get a clean web interface that exposed many of the admin tasks you normally perform by SSH’ing into your hosts directly.
Note the following types of things you can use Cockpit for with your Linux administration:
- Review system performance
- Manage storage
- Restart services
- Browse system logs
- Apply operating system updates
- Monitor CPU, memory, and disk utilization
- Launch a web terminal directly from my browser
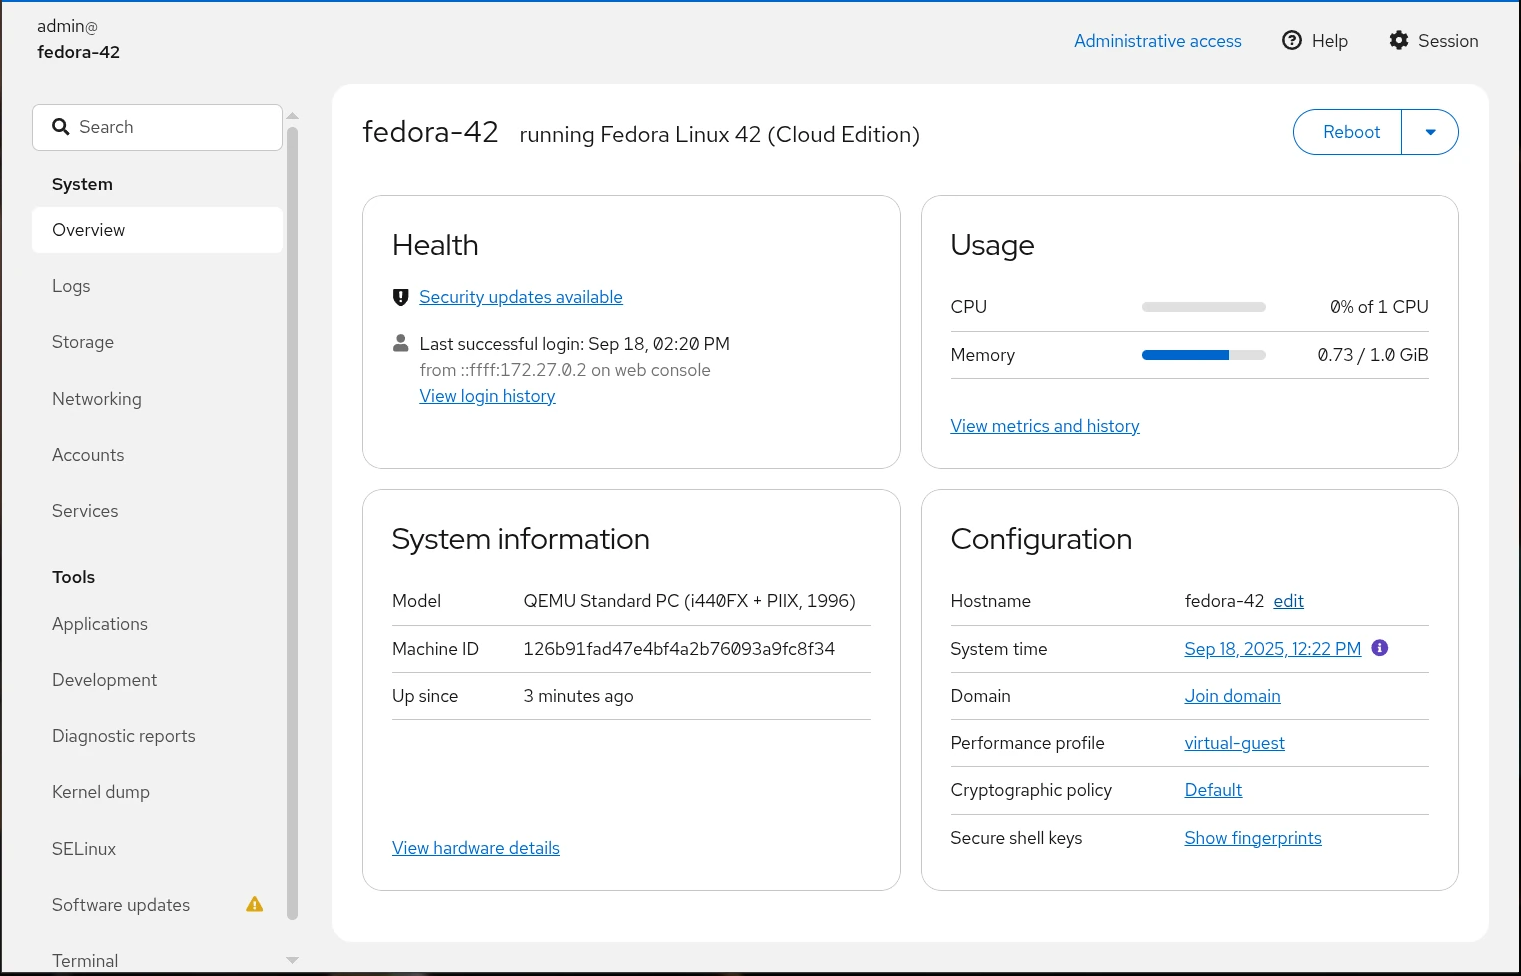
It is intuitive I think and it presents familiar admin functions for you in a modern fluid interface. You still have full access to the underlying operating system, and if you need to drop into a shell, it is literally one click away.
Also, this is not just for managing one server per Cockpit installation. You can all multiple servers to Cockpit and it becomes the centralized location where you can manage and see all of your Linux server estate and have all of the functionality exposed to you for your servers from one dashboard.
If you are looking for a great weekend project for your Linux servers, this is probably one of the high value projects you can tackle and it doesn’t take much time to spin up.
Check out my blog post on Cockpit here: Cockpit Ubuntu Install Configuration and Apps.
Patchmon
If you are running “mutable” Linux Servers that are long-lived and that have a more traditional approach to management where you need to keep them patched, etc, Patchmon is the best tool I have found to manage Linux server updates.
Patchmon regularly scans your Linux hosts once you add them and it will tell you which packages on each host are out of date. Then, you can create group profiles for your servers so you can have these update at a time and frequency that aligns with what you want. It also supports multiple Linux distros as well so it isn’t tied to a single solution.
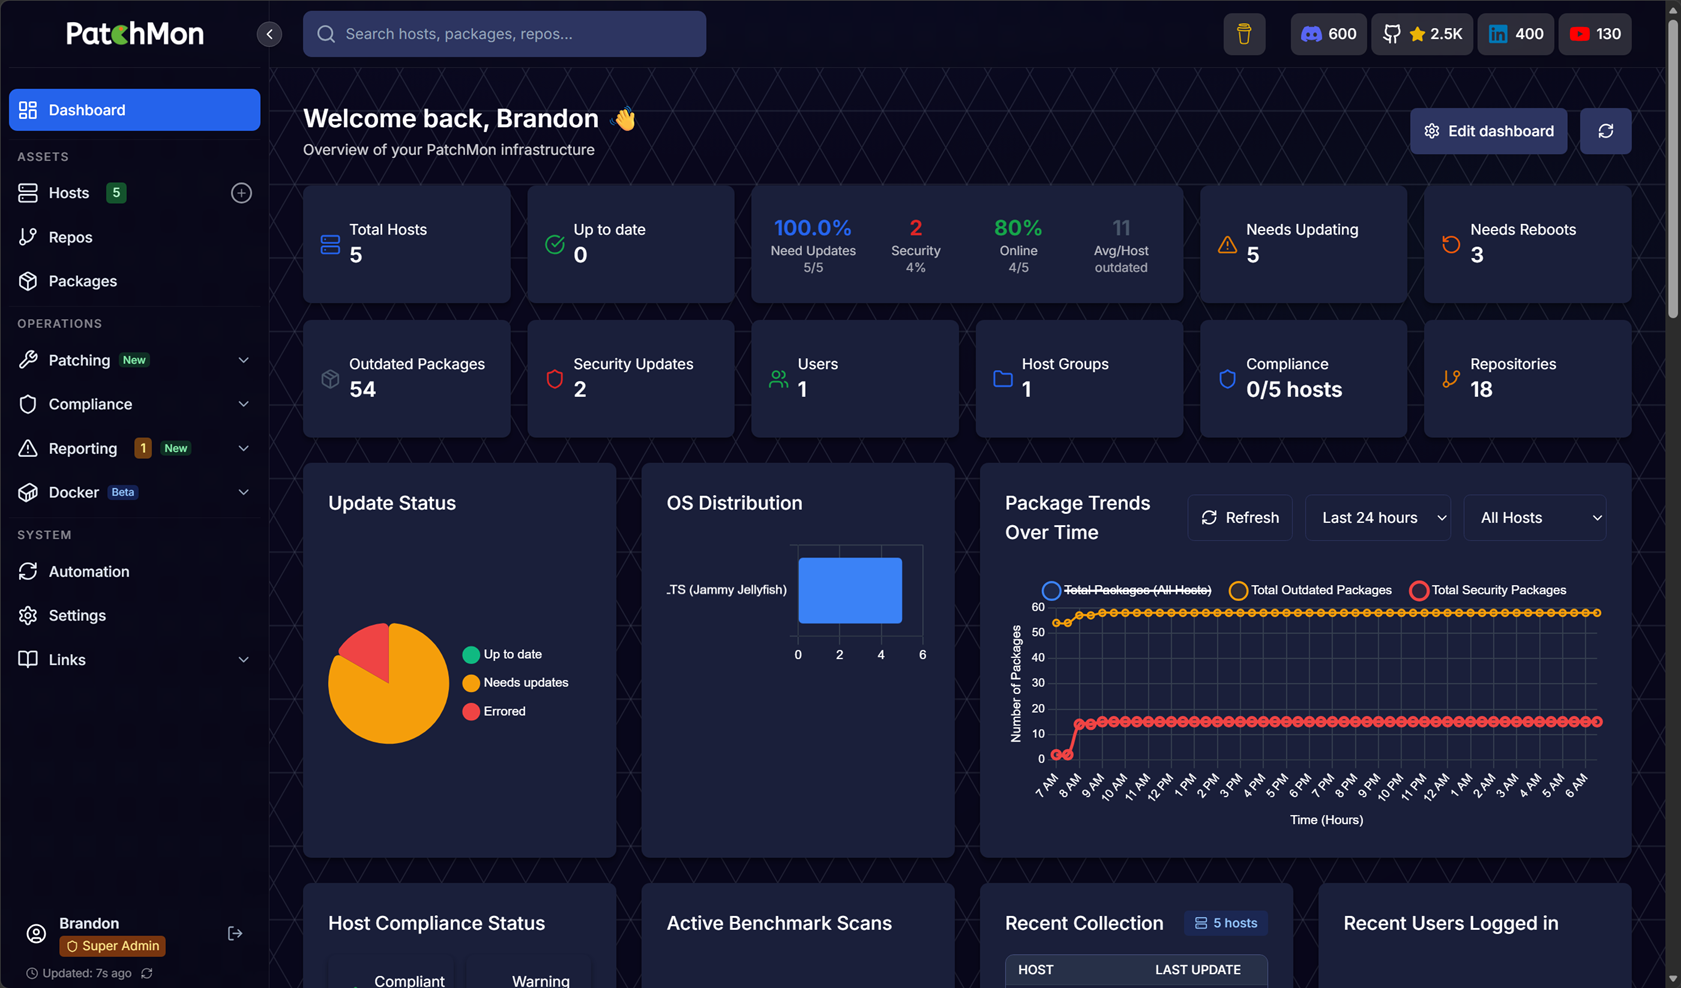
Even though we are focused on Linux for this post, it also supports looking at your Windows patches needed if you want to also add your Windows estate. So, you can have a single pane of glass over the top of all your update needs. You can’t initiate update installations for Windows as of yet, only Linux, but this functionality I’m sure is coming.
Check out my blog post here on the new Patchmon v2 functionality: PatchMon V2 Finally Lets You Patch Your Servers From One Dashboard.
Pulse
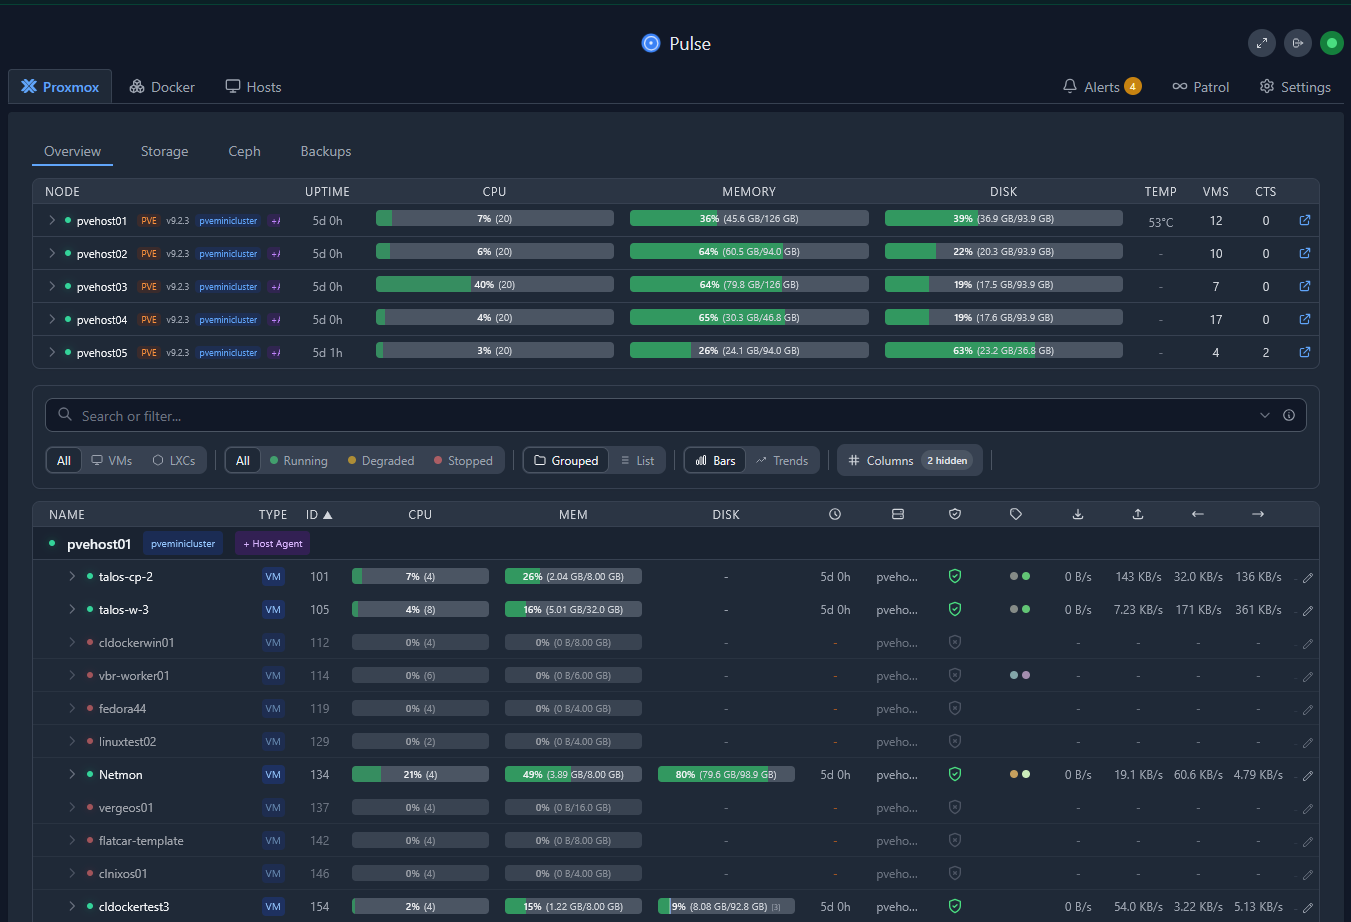
Pulse is a tool that has become the core of my monitoring tools in the home lab environment, especially after moving to Proxmox for my production workloads. This tool is awesome in what it does. It gives you a full view of your Proxmox host environment health, including storage and HCI storage with Ceph.
Instead of having a solution to monitor Proxmox and another solution to monitor Docker, Pulse has allowed me to collapse down my monitoring configuration so that a single solution covers all of this for me and it does a really nice job of monitoring the two technologies that I think most are using in the home lab stack with Proxmox and Docker.
Another thing I like about Pulse is that it doesn’t feel overwhelming or that you have to have a degree in monitoring to get useable monitoring in place. You just stand it up, install the agents on your Proxmox hosts and your Docker hosts, and it starts pulling in all the useful metrics you need to know.
It also has really good alerting capabilities built into the platform that allows you to notify on built-in alerts that are sensible out of the box. Then you can tweak things as you need to along the way.
If you’re looking for something new to evaluate this weekend, this would definitely be on my shortlist.
Check out my post covering Pulse monitoring for Proxmox here: This Free Tool Gives Proxmox the Monitoring Dashboard It Always Needed.
Beszel
If you are looking for something that isn’t so Proxmox or Docker specific, Beszel is a great option for a home lab environment. It is one that is simple and easy to get setup and start seeing value from.
With the metrics that Beszel gives you, you can quickly see things like the following for your monitored hosts:
- CPU utilization
- Memory usage
- Disk utilization
- Network activity
- Historical performance trends
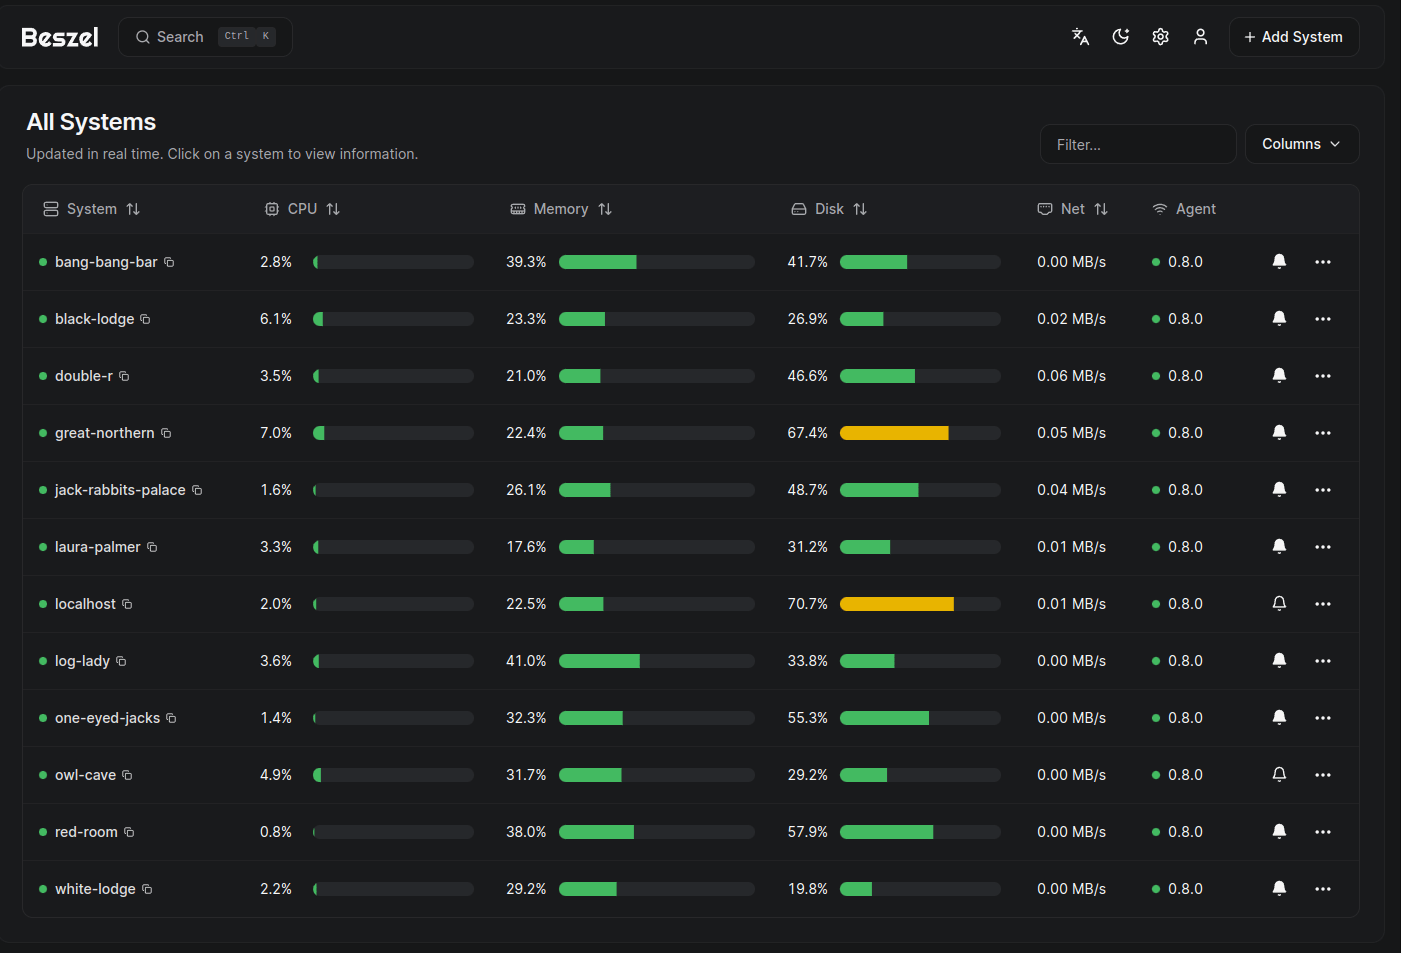
The interface is really clean and like Pulse, I think it gives you a lot of information without having to spend a ton of time figuring out how to set things up. So, for me, it is a great balance between functionality and complexity. It gives me enough information to identify issues without requiring the hours of investment of a more complex monitoring platform.
Sometimes that’s exactly what a home lab needs. Check out my detailed blog on Beszel monitoring in the home lab here: I Replaced My Monitoring Stack and This Just Works in My Home Lab.
Uptime Kuma
If you are absolutely looking for one of the best solutions to help you know when something is “down” or not, Uptime Kuma needs no introduction. In fact, this is usually one of the first things in my home lab that alerts me if something is not right. Usually when something goes down, it will take down a service in the lab. I have Uptime Kuma monitoring that service or web page and if it can’t get to it
What exactly can you use it to monitor? Well, most everything that I think most of us self-host. Those things include: websites, APIs, Docker services, virtual machines, DNS servers, reverse proxies, and practically anything else that responds over the network.
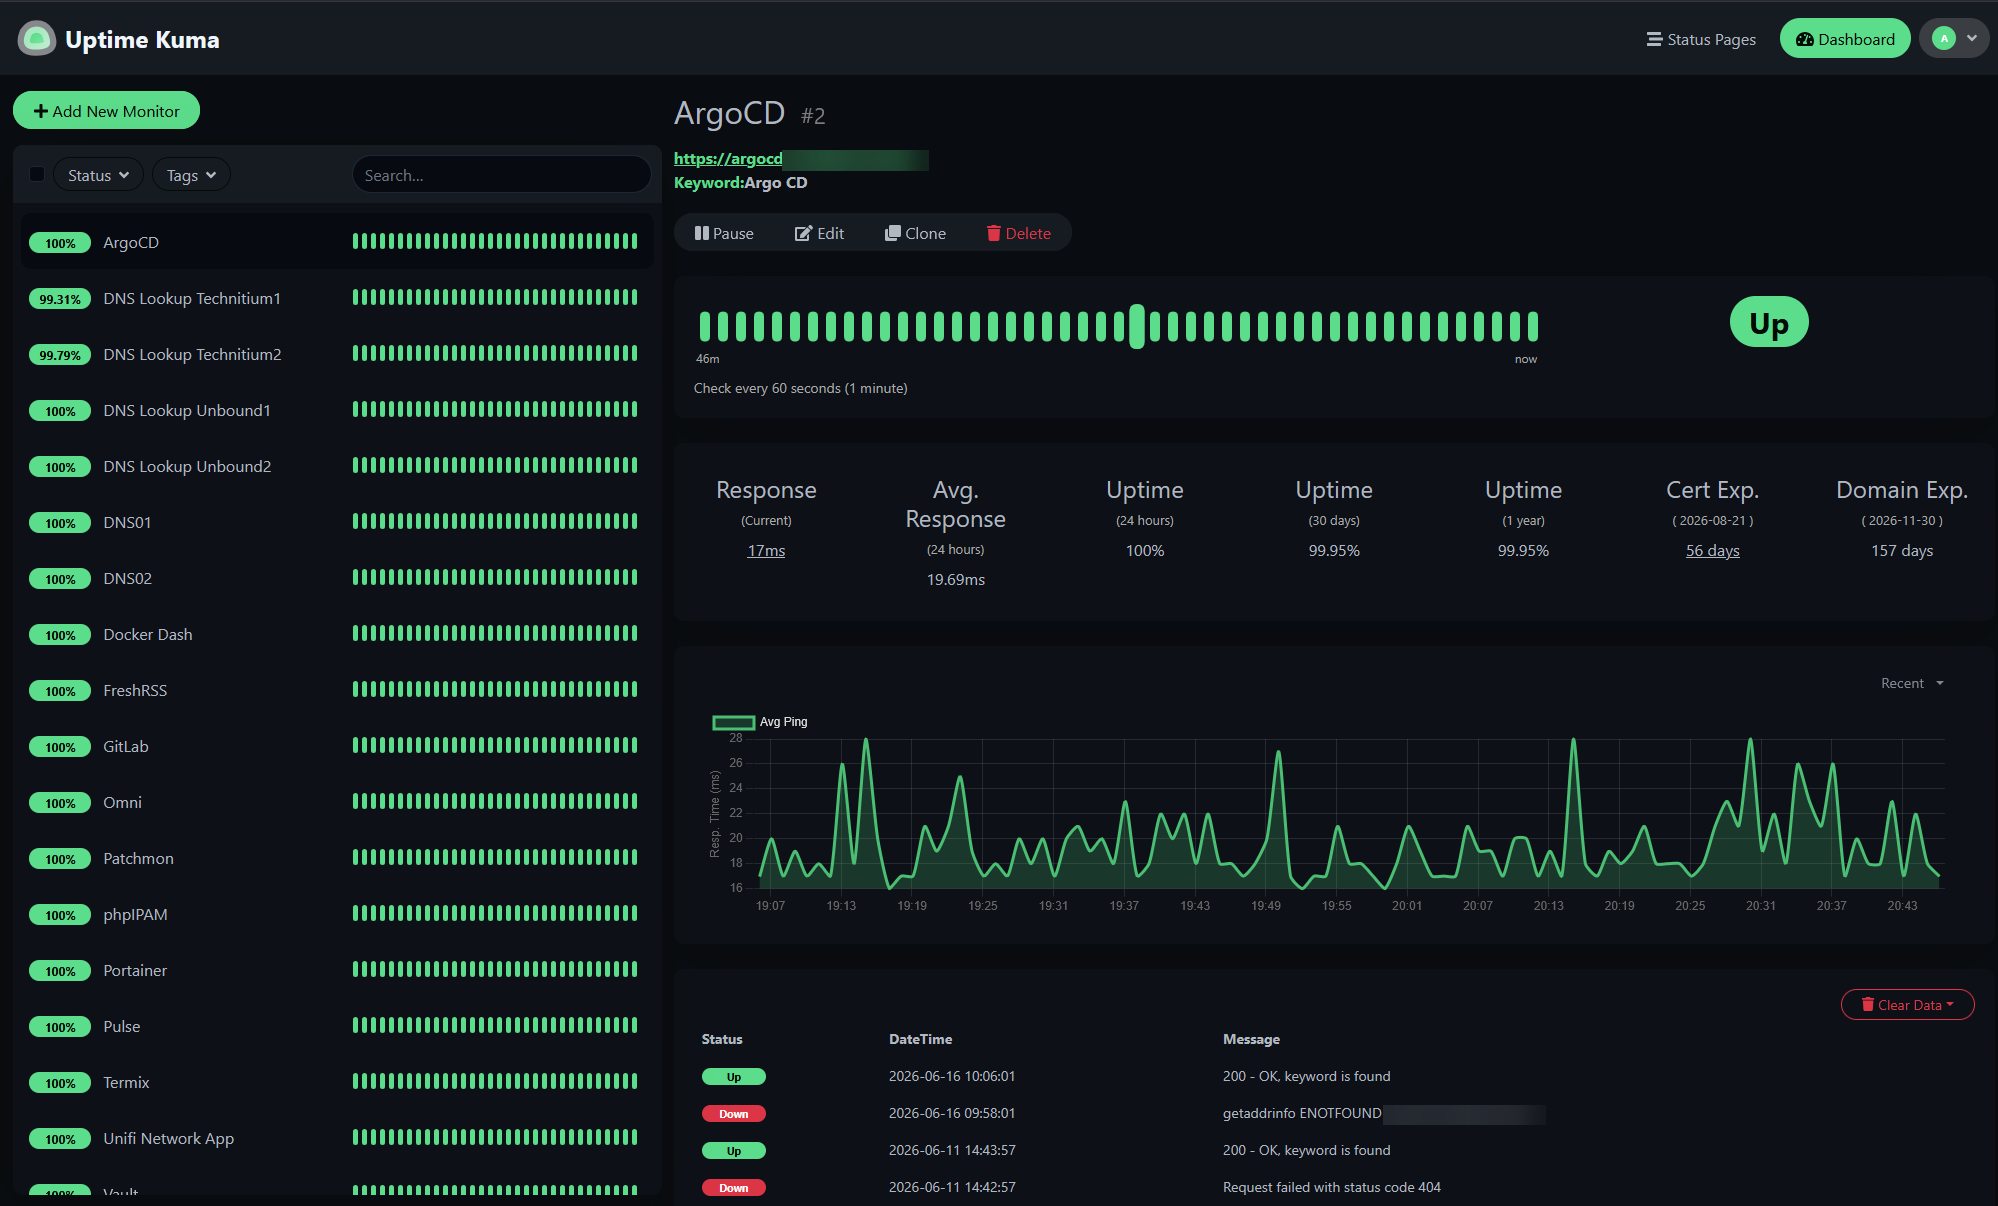
The notifications are one of its biggest strengths. It gives you many options and allows you to use most of the big ones like email, Discord, Slack, Microsoft Teams, Telegram, etc. Uptime Kuma integrates with nearly everything on the notifications front.
One thing I always recommend is monitoring your critical infrastructure first. Start with the services you are running like:
- DNS
- Reverse proxy
- Identity provider
- Storage
- Backup server
- Virtualization hosts
Once those are covered, expand into your application stack. This will give you a lot of peace of mind that if you do get an alert you will trust that it is something that you need to look into.
Check out my blog post here on Uptime Kuma: Uptime Kuma Self-hosted application and server monitoring.
btop
Most of what we have seen so far has been GUI-oriented. Sometimes though, still the fasted way to troubleshoot is from the command line or terminal session. If you have used htop before, think of btop as a modern successor to that. It takes everything i liked about htop and presents it in a much cleaner and I think more informative interface.
In one terminal TUI of sorts, you can see CPU, memory, swap usage, disk activity, network activity, and processes that are running and consuming resources, or general troubleshooting. It is kind of that one tool that gives you a lot of the information you would get from jumping between other tools like top, free, iostat, and iftop.
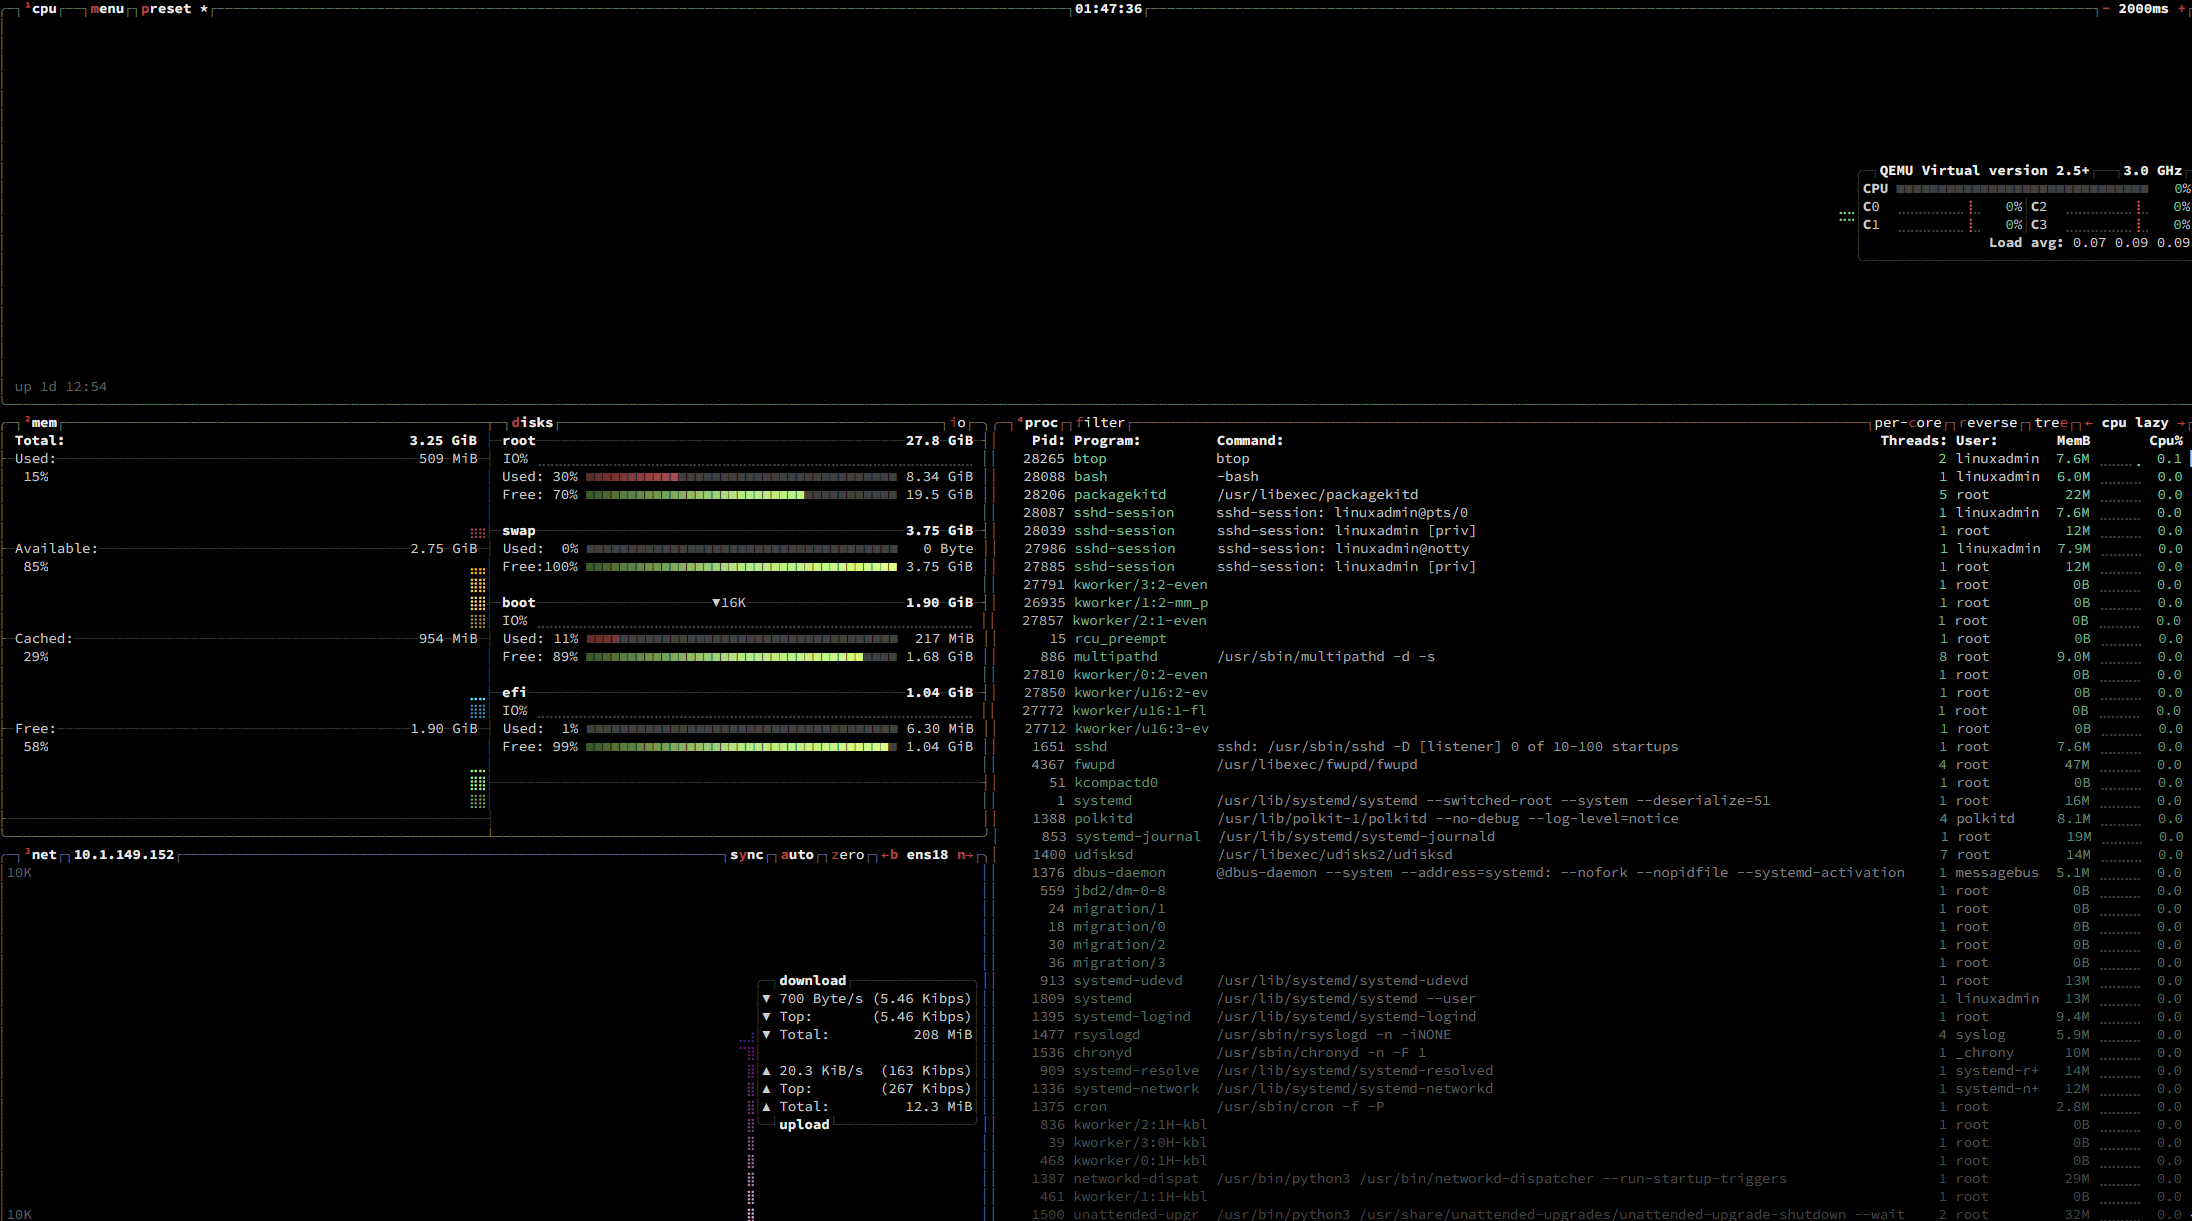
The btop tool is also really customizable. You can change themes, change your refresh rates and customize it to display the information that is relevant to your specific environment or home lab. It is still lightweight enough that it doesn’t feel like a pig on resources .
If you are looking at learning or trying out a new and very easy Linux management tool this weekend, give btop a try and you won’t regret it!
Sencho
Sencho is a tool that I found recently and was really blown away with by the number of features and really cool little things this one does that I haven’t really seen in other solutions. Even though I enjoy editing Docker Compose files directly and love tinkering, a GUI solution for your docker compose makes life easy for management.
You may have already used something like Portainer or Komodo. Sencho I think will impress you with the features that it offers and cool things you can do with it. Using a single management container, you can connect a Pilot agent they call it on your other Docker hosts and have access to all the vitals on your other hosts.
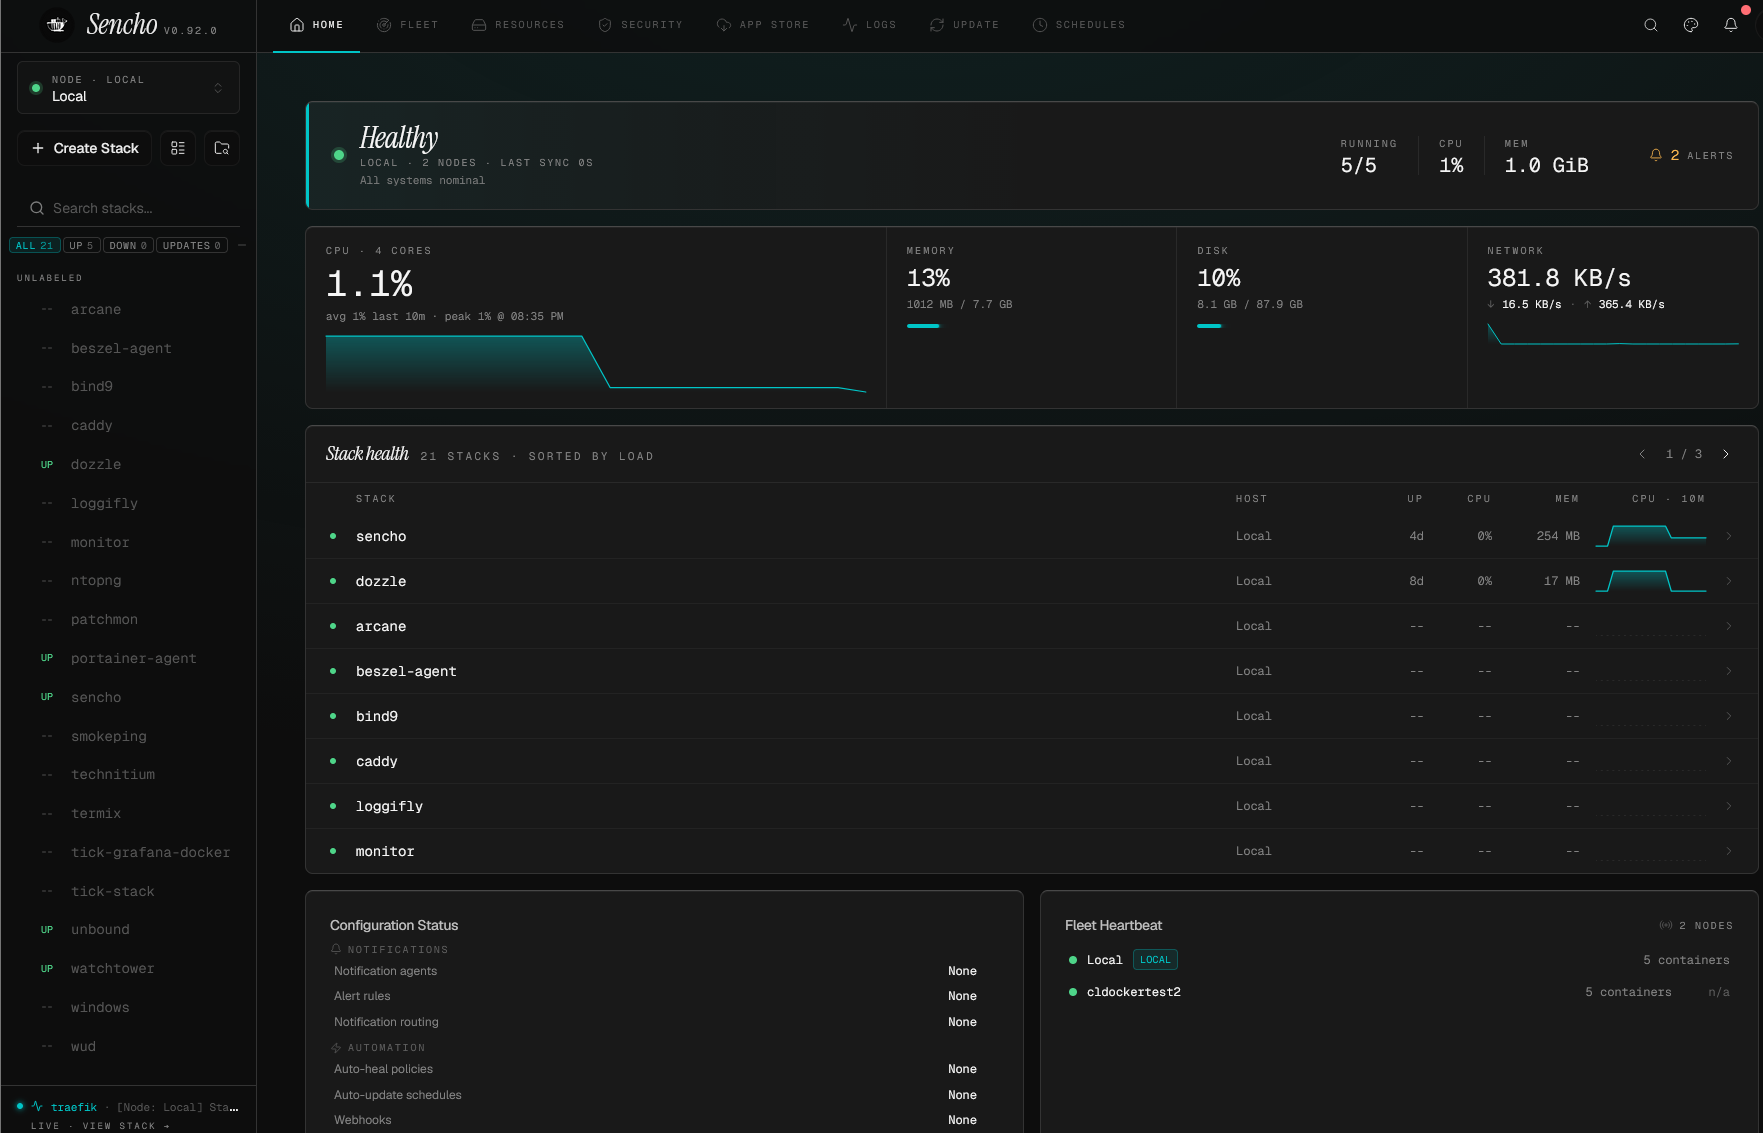
One of the really impressive things you can do is “snapshot” your Docker compose stacks as it has a quick and easy way to do that built into the interface. I haven’t really seen another tool that has this type of functionality.
Check out my full, detailed blog post on Sencho docker compose management here: Sencho Might Be the Docker Compose Management Tool Home Labs Have Been Waiting For.
Loggifly
Loggifly is a tool that I found recently that I really like. Especially running Linux servers as Docker hosts, I found myself looking through Docker container logs only after I knew something had errored or was going wrong. The docker logs command works really well, but it is very reactive.
Loggifly is a tool that monitors your containers logs and alerts you to any keywords or phrases found in your Docker logs. So, for instance, if the word error, warning, fail are found, you can have loggifly alert you and send over the error messages that it is seeing.
This little tool has been really useful when testing new applications or updating existing services. If I have an app that crashes or a container that is in a restart loop, loggifly will alert on the reason and send over a message with the error.
Check out my full blog post on Loggifly here: LoggiFly Is the Docker Log Alerting Tool I Didn’t Know I Needed.
Semaphore UI
One of the other tools that I love for home lab and production environments is Ansible. I think it is the king of configuration management and we can do so much with it. If you haven’t already, spin up a Semaphore instance.
Semaphore UI is a GUI tool that I personally think is better than the Ansible AWX open source solution that I ran for a while. It is a modern take on what GUI management should be for Ansible. It isn’t limited to Ansible though and can manage other scripting languages and source things from Git.
Check out my full post here on Semaphore, getting it installed and an example playbook configuration: Ansible Semaphore: Awesome Open Source Ansible GUI.
Wrapping up
One of the misconceptions I think many have about running Linux in the home lab is that you will spend hours inside dozens of SSH sessions all day long. These management tools that I have briefly described here are some of the best tools that I have found and personally use in my home lab in managing Linux servers. All of these have value in their own right and help to solve specific problems in the home lab. How about you? Is there a tool that I didn’t put on this list that you personally use? Please share with the community in the comments!
Google is updating how articles are shown. Don’t miss our leading home lab and tech content, written by humans, by setting Virtualization Howto as a preferred source.
About The Author