Have you ever had those frustrating moments when running a home lab and you know that everything looks like it is “technically” working, but things just “feel” slow? It is hard to put your finger on it. VMs are up and running, containers are spun up, and there are no obvious errors that you see when checking across your normal monitoring stack. But something just feels off. Web interfaces may be sluggish and SSH or RDP sessions feel delayed. Sluggish performance can be one of the hardest types of problems to troubleshoot, because nothing is really “broken”. In this post, let’s walk through the exact things I check when my home lab feels slow, even when everything looks healthy on the surface.
It is almost never just one issue
One thing to keep in mind is that slowness is usually not caused by a single failure. This is a hard thing to accept sometimes but it will be a paradigm shift when you start thinking along those lines. It is almost always multiple small things that stack up to cause things to “feel” slow.
When you have a little bit of storage latency stacked on top of CPU throttling, and a network link that isn’t running at full speed, this causes your entire lab to suddenly feel slow. This is why traditional monitoring doesn’t always flag anything as being critical. You have to think like a detective and look to see how everything interacts.
On that note, check out a tool here I just wrote about that is like RVTools reporting for Proxmox: Proxmox Finally Has a Real RVTools-Style Report (This Is What Was Missing).
But luckily, there are a few things that are often the culprit when things feel slow that you want to have as part of your “checklist” of sorts. Let’s see what some of these may be.
Your hypervisor may be aggressively “swapping”
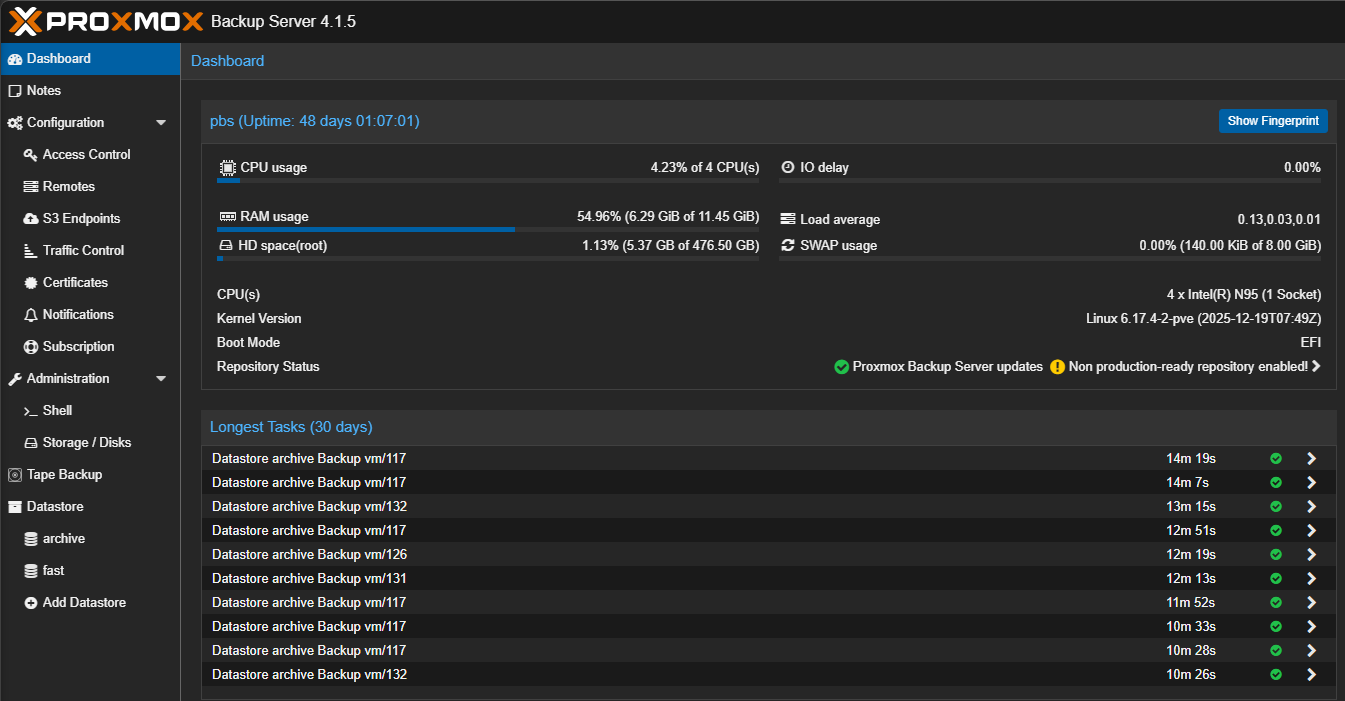
One of the first health checks that I take a look at from the hypervisor level is how much you are “swapping”. In Proxmox, it is very easy to overcommit memory without really realizing it. It does a great job of just handling things behind the scenes. Everything still runs. But, if your host starts swapping out memory, performance will start to drop extremely hard.
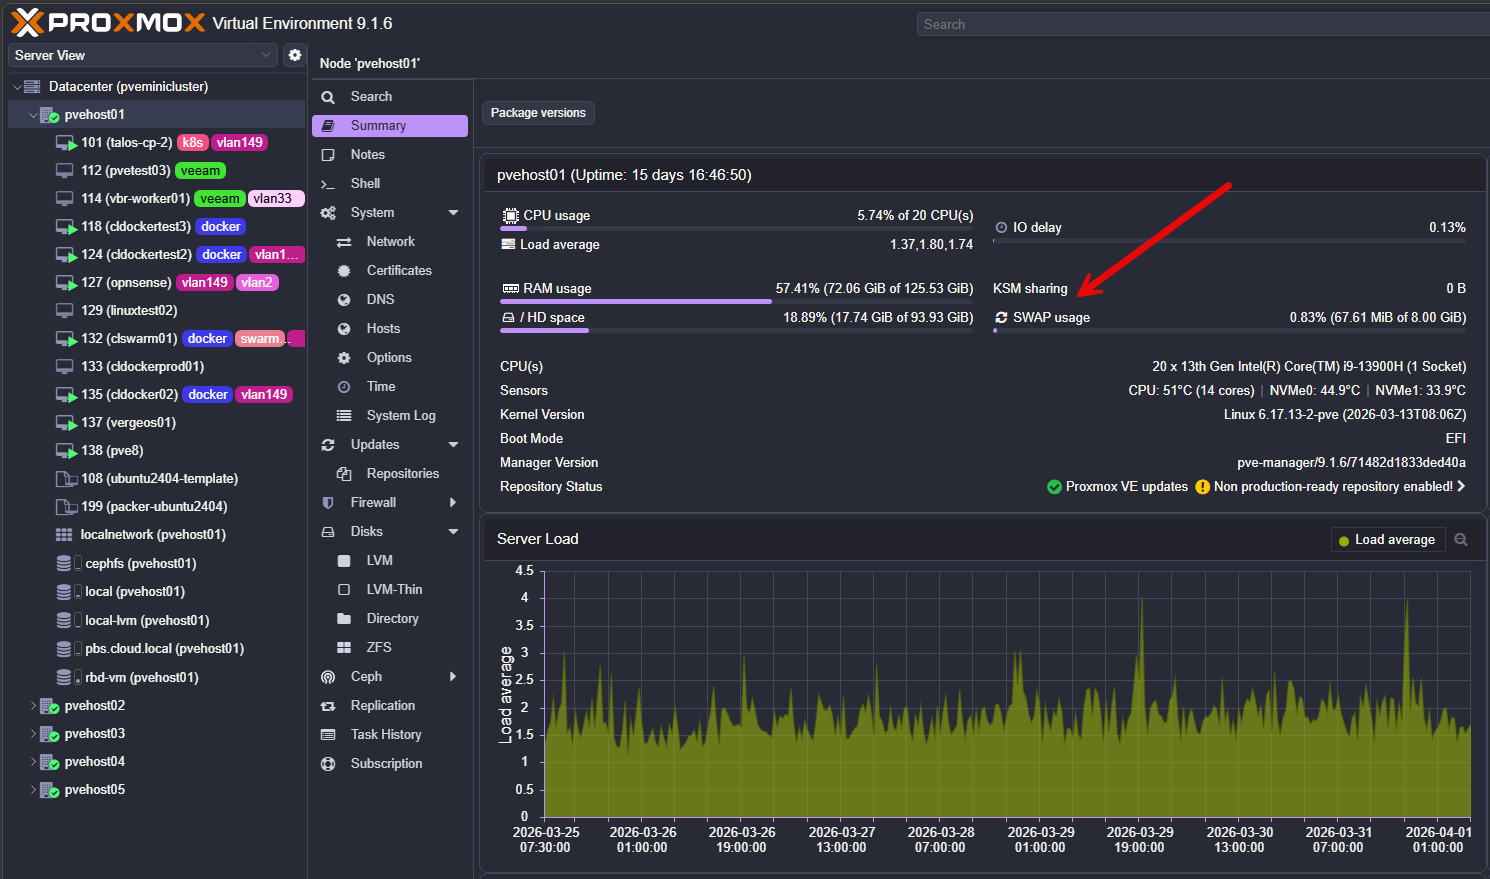
Even small amounts of swapping can cause noticeable latency and “slowness” across all of your workloads. There are a few things to check on your Proxmox nodes. What are these? Run the following commands:
- free -h on each node
- vmstat 1 to watch swap activity in real time
- Proxmox node summary for memory pressure
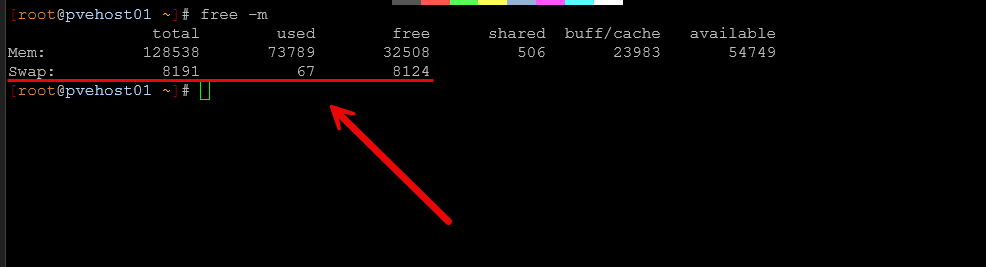
If you see swap usage increasing under load, that is a red flag. What can you do if you see this happening? A few things to start looking at doing:
- Reduce your VM memory allocations
- Add more physical RAM (tough in today’s market and prices :-/ )
- Adjust ballooning settings – Ballooning can reclaim memory under pressure, which sounds good, but it introduces latency
- Moving heavy workloads to other nodes
This is one of those issues where nothing looks broken, but everything feels slow. Check out my post here on how to make SWAP almost perform like RAM using Intel Optane:
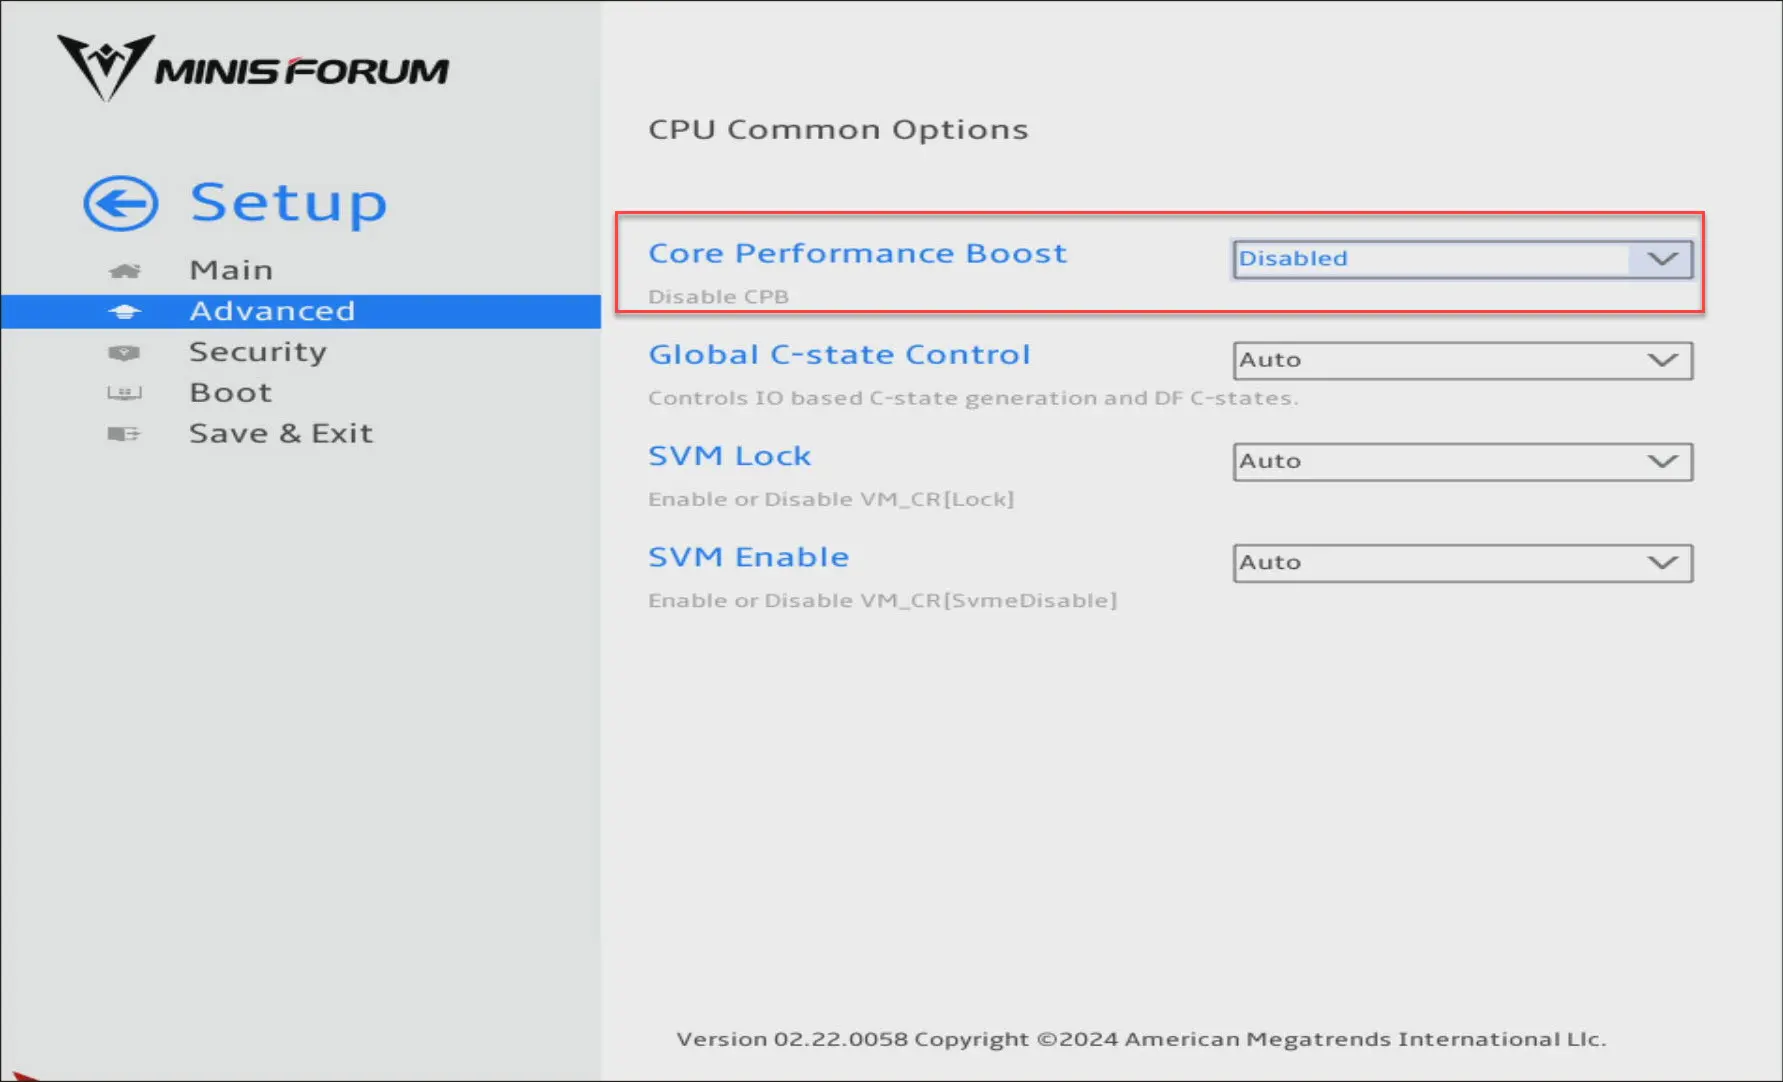
Core performance boost might be holding you back
This is a big one, especially in home labs focused on power efficiency. If you are like me and you have disabled settings like Core Performance Boost (AMD) or Turbo (Intel), your system may never reach its full potential for performance under load.
This may not be a big deal to turn off these settings under normal workloads or when things are pretty much baselined anyway. But, keep in mind if your system starts getting under CPU pressure, it can’t benefit from the full frequency potential of the CPU. In effect, your cores are not allowed to boost to higher frequencies when this may be of benefit.
You may see some of the following characteristics if you disable this:
- Slower VM responsiveness
- Longer task execution times
- Kubernetes workloads taking longer to schedule and start
If you have disabled boost for power savings, it is worth testing both configurations to see what the difference is in terms of power consumption. In my lab, disabling boost cut power usage significantly. But it can also introduce sluggishness in the right circumstances. Just know that it is a tradeoff between power consumption and performance that you need to understand.
Check out my dedicated post on this setting here:
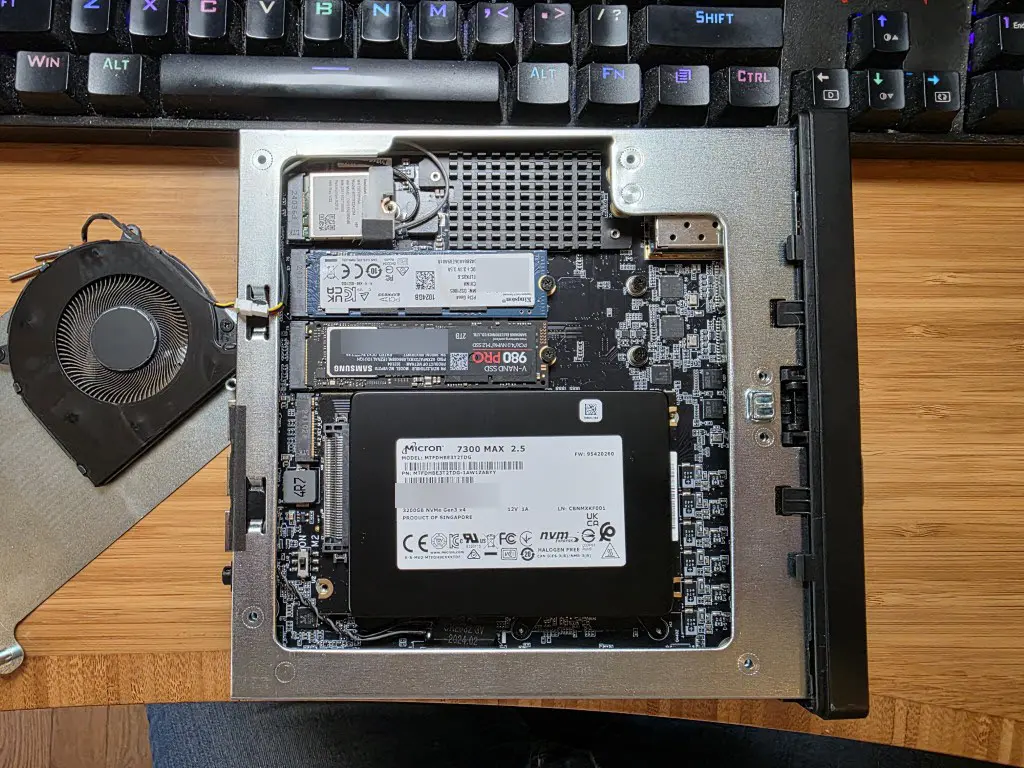
Consumer NVMe drives may be throttling you under load
This can be one of the biggest performance killers, especially when you are using consumer-grade NVMe drives. These rely heavily on something called SLC cache. They perform really well in short bursts. But once the cache on a consumer NVMe filles up, performance will drop off significantly.
This can happen especially if you are using very “write heavy” technologies like Ceph HCI storage with the built-in write amplification. In a home lab, performance hits due to SLC cache filling up can happen in the following situations:
- Multiple VMs are writing at the same time
- Backups are running
- Ceph is rebalancing or recovering
At first, everything feels fast. Then suddenly the entire system slows down to a crawl. What is happening when you “feel” this, is the cache is saturated and the drive is now writing directly to slower NAND. What should you look for as signs this is happening?
- Good benchmark results but poor real-world performance
- Performance drops during writes that are sustained
- Inconsistent latency patterns, especially under load
The long-term fix is moving to enterprise SSDs. They are designed for sustained workloads and behave much more predictably. Do check out my very cool experiment that I did recently where I compared the performance benchmarks of Ceph HCI storage in the home lab and, more importantly, latency between consumer NVMe drives and enterprise NVMe drives. The results were pretty eye opening.
Your network links might not be running at full speed
You have a shiny new 10 GbE or 25 GbE switch. You just assume that plugging your links into a faster uplink will just automatically make things uplink at that speed. Well, it is supposed to work that way if everything is capable of the higher speed. But, I have seen a lot of weird issues with autonegotiation issues due to cables or SFPs that weren’t really rated or supported with a certain vendor as an example. You get link lights, but in the process the switch negotiates the uplink down to a slower speed.
This is one that I think catches a lot of people off guard. Just because you have 10 Gb networking hardware does not mean your links are actually running at 10 Gb. I have personally seen links negotiate down to 1 Gb or 2.5 Gb due to several issues, including:
- Bad cables
- Incorrect SFP modules
- Switch port configuration
- NIC compatibility issues
Everything still works, but your throughput is definitely handicapped. Don’t assume, be sure to check things out thoroughly:
- ethtool on Linux to verify link speed
- Switch port status
- LACP bond status in Proxmox
- Error counters on interfaces
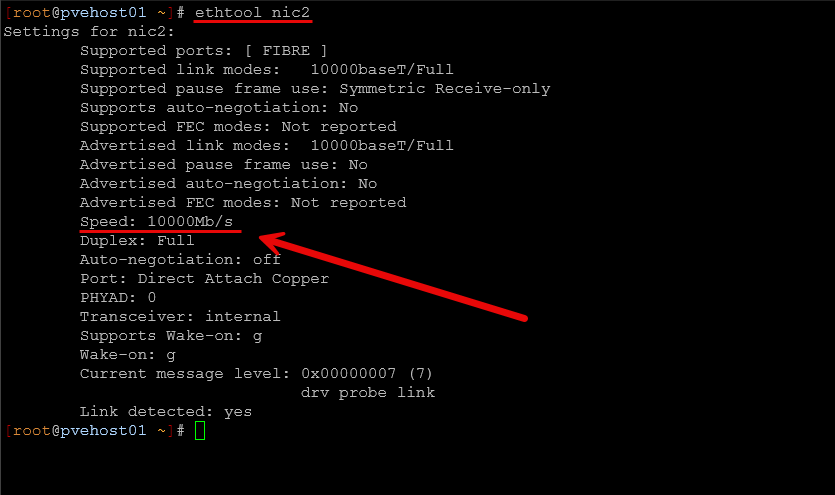
IEven if just one link in your storage or cluster network is running slower than expected, it can impact your entire environment.
MTU mismatches can quietly degrade performance
This is another performance sapping issue that I ran into not long ago that I wrote about. MTU mismatches can absolutely kill performance. It is ironic that the very reason we enable jumbo frames is to increase performance and throughput while lowering CPU utilization, all to cause the opposite to happen.
If you are using jumbo frames, MTU mismatch is a classic issue that many run into. The tricky part is that connectivity will often still work just fine. Pings will work. SSH still works. But, performance is degraded. Due to this mismatch you may see weird things like storage traffic latency, increased latency between nodes, and reduced throughput on large transfers.
The most important thing to remember with jumbo frames is making sure they are consistent across your infrastructure that is involved in the communication path. This usually includes:
- NICs
- Bonds
- Bridges
- Switch ports
One mismatch in the chain is enough to cause issues. Also, it is usually a mistake to enable jumbo frames on VM virtual networks where your virtual machine workloads connect. Most VMs don’t need jumbo frames. If you enable them on a VM network, after a reboot most modern OS’es will adjust to use jumbo frames. Then any traffic that is routed across a link that is not layer 2 usually starts getting fragmented as you don’t usually account for that. This will cause backup failures, and other weird elephant flow issues.
You can use a simple ping test to test jumbo frames:
ping -M do -s 8972 <destination host>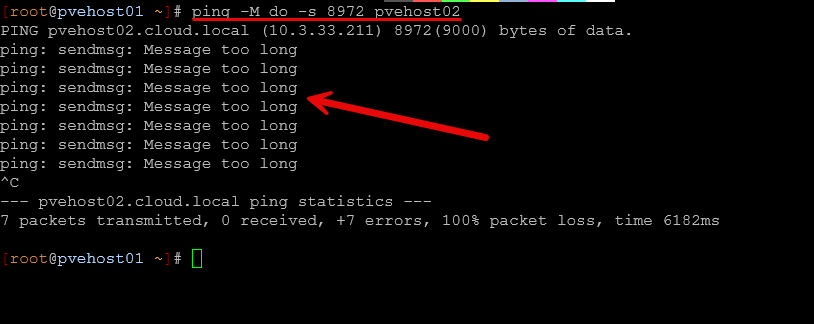
Scheduled jobs may be taking their toll
Automated and scheduled jobs are a great thing that helps to take the heavy lifting out of remembering to run important processes and tasks like backups. But, they can also be something that can take their toll when we don’t really think about, since they are set on automatic.
What are some examples of jobs that may take their toll on the performance of your home lab?
- Backups running while Ceph is rebalancing
- Container updates pulling large images
- Monitoring systems scraping large amounts of data at set intervals
- Snapshot pruning jobs kicking off
Each of these is fine on its own. But if these get inadvertently stacked on top of other very intensive operations, you may see massive performance hits. I know I have kicked off ad-hoc jobs not even thinking about other jobs that may kick off on a schedule, leading to performance degrading for a time.
Of course with scheduling, do your best to make sure intensive jobs don’t overlap. Sometimes this is unavoidable, but plan as best as you can.
A single noisy workload
Sometimes the issue is just a single noisy workload that is doing a LOT of I/O or that has massive CPU or memory pressure which will affect the overall resources of everything else. For example, you might have a logging container that is writing constantly, or a database virtual machine that is doing heavy indexing operations. Backup operations that hit a certain VM may write large amounts of data.
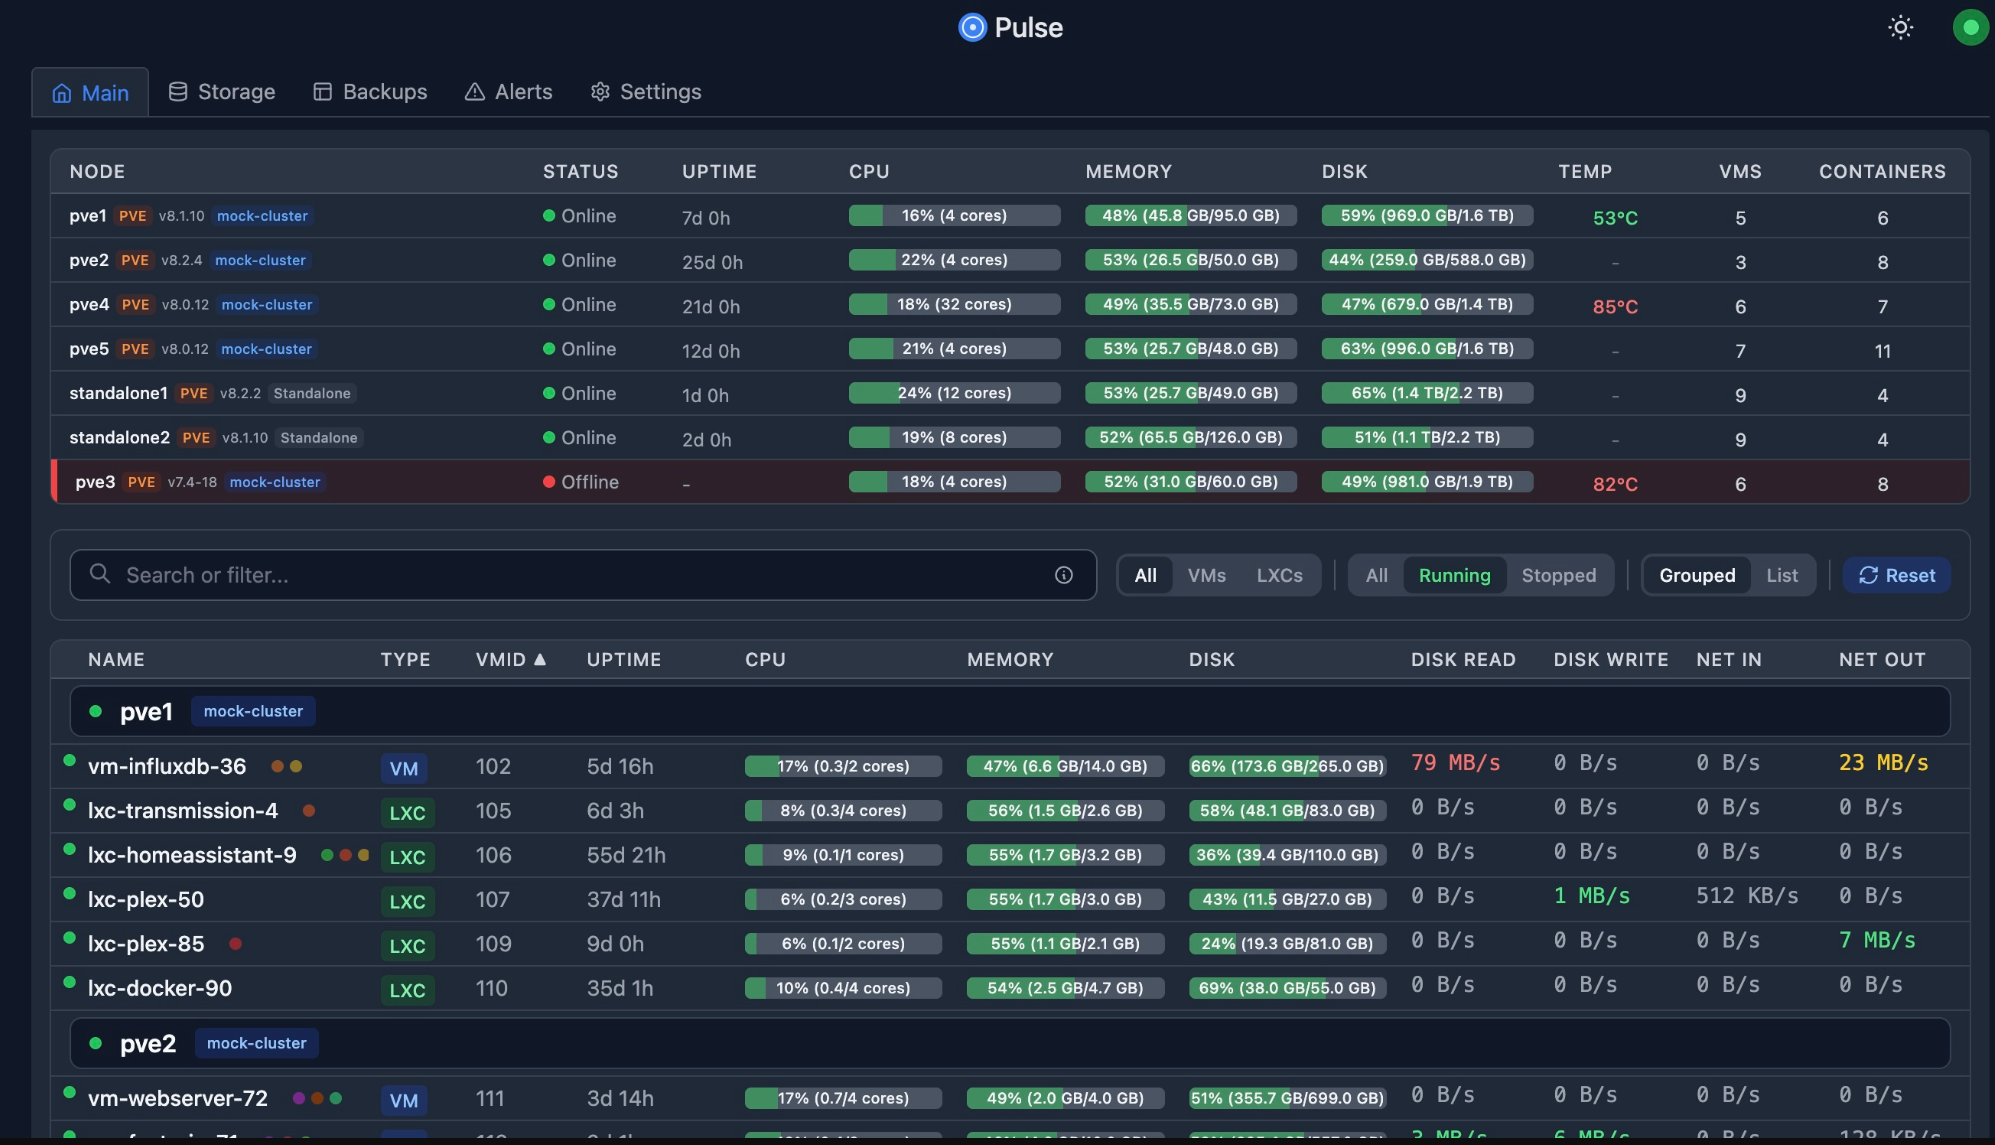
When everything shares the same storage backend, one noisy workload can and will impact everything else if you don’t have much headroom performance wise, which is often the case in a modest home lab. If your system feels slow, use something like Pulse to monitor your VMs and containers you have running. If any stand out it is worth investigating.
Thermal throttling
We mentioned in an earlier point about saturating the SLC cache on a consumer NVMe drive robbing you of performance. There is another culprit that can also be at play when things start to feel like they are slowing down. This is thermal throttling. With small form factor systems like mini PCs that most of us run, it is pretty easy to hit thermal limits under sustained write operations.
When this happens, CPU and NVMe drives can be throttled. Everything still works, but at a giant performance drop. Definitely use software monitoring tools to keep an eye on your hardware temps that you have for your mini PCs. ProxMenux is a great tool that I use to keep an eye on just these types metrics.
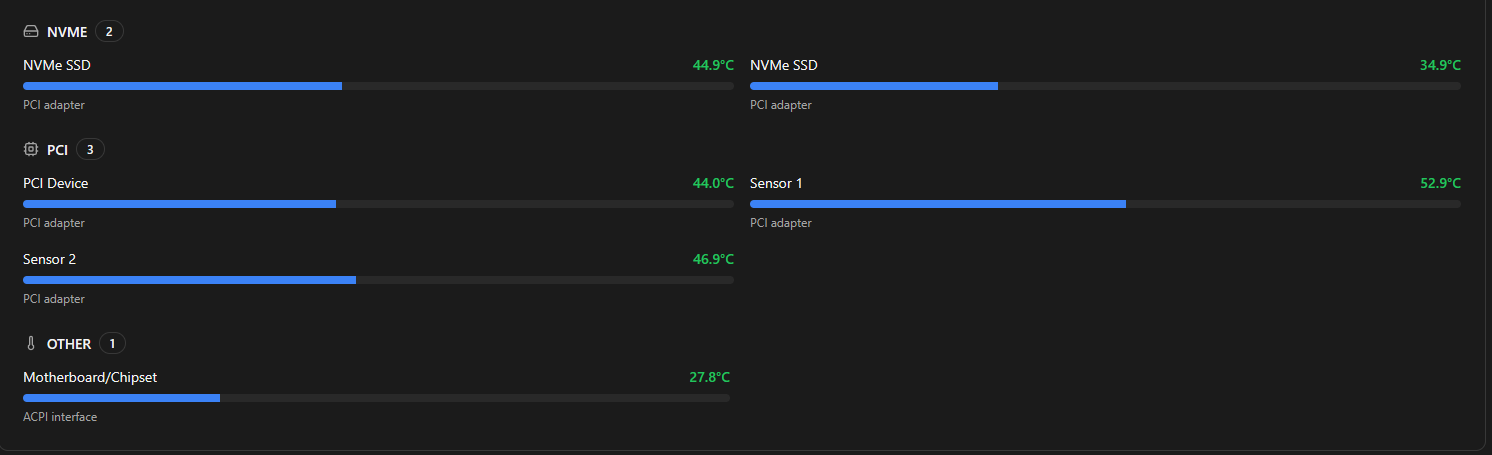
Things to keep an eye on:
- CPU temperatures
- NVMe temperatures
- Fan curves and airflow
If your hardware is running hot, look at improving your cooling for your mini PCs or airflow in general helps prevent heat soaking or leeching.
Checklist of what to look for
Check out the following simple checks you can make when you see certain performance bottlenecks in your home lab.
| Check | What to look for | What to check |
|---|---|---|
| Swap usage on nodes | High or increasing swap usage | free -h, vmstat 1, Proxmox node summary |
| CPU boost and frequency | Boost disabled or low CPU frequencies under load | BIOS settings, lscpu, cpupower frequency-info |
| Storage latency | High latency even with decent throughput | iostat -x, fio, Ceph ceph -s and ceph osd perf |
| Network link speeds and MTU | Links running below expected speed or MTU mismatch | ethtool, ip a, switch port status |
| Heavy or overlapping jobs | Backups, updates, or rebalancing running at the same time | Proxmox tasks, cron jobs, Kubernetes jobs |
| DNS response times | Slow or inconsistent lookup times | dig, nslookup, check DNS server config |
| Single workload heavy I/O | One VM or container doing excessive reads or writes | iotop, top, Proxmox VM metrics |
| Temperatures and throttling | High CPU or NVMe temps leading to throttling | sensors, nvme smart-log, IPMI or BIOS monitoring |
Wrapping up
This is by no means an exhaustive list of every possible performance killer in the home lab. But, by going through this list of things, you will likely be able to narrow in on what is going on when things feel sluggish or like they are just not performing like they should be. As we have discussed, it is often not caused by a single failure of sorts, but by multiple things that start working together that go against performance. Once you know to start checking things like swap usage, CPU boost behavior, NVMe characteristics, and network link speeds, you will begin to see patterns that come up in terms of load and performance. What about you? Have you fought issues in the past where your home lab felt slow? Was it any of the things we listed in the post or something else? Do share in the comments.
Google is updating how articles are shown. Don’t miss our leading home lab and tech content, written by humans, by setting Virtualization Howto as a preferred source.
About The Author