
Running your own self-hosted environment usually means you are going to be running Linux servers at some point (or you should be). Linux provides one of the most robust and stable hosting platforms that you can run. However, when things break (and they will), you need to know how to troubleshoot things effectively. Thankfully, Linux has a ton of really great troubleshooting commands that every home lab admin should know. Let’s dive in and look closer at 15 commands should be on your short list.
journalctl
The first tool on the list is journalctl. This is the tool you use to look at systemd’s journal log. When a service won’t start, it crashes, or has some type of strange behavior, journalctl is one of the first places you should look. Note the examples below.
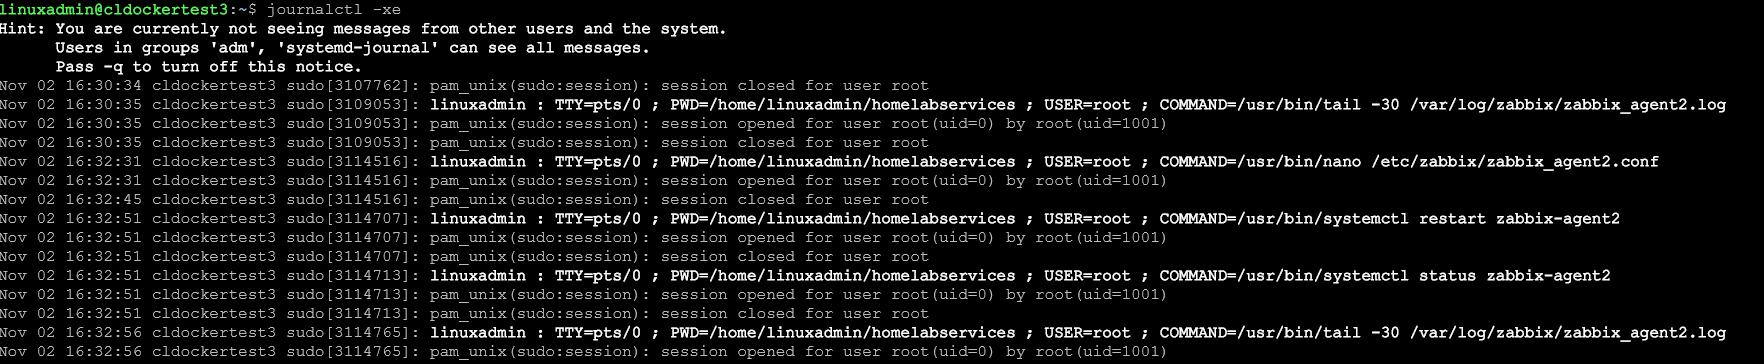
If you want to view the entire system log:
journalctl -xeAlso, you can view logs for a specific service:
journalctl -u nginx
journalctl -u ssh
journalctl -u kubelet
If you want to see continual updates to the log:
journalctl -u docker -f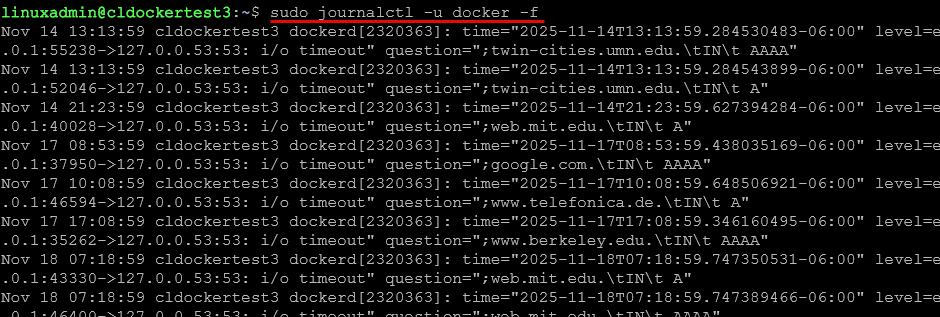
Journalctl is one of my go to commands that is extremely useful on modern distros like Ubuntu, Debian, Fedora, Rocky, and even your Proxmox nodes. If you only learn one log command, learn this one and learn it well. It will come in handy often.
systemctl
There is another tool that is often used when you need to troubleshoot services in particular. The tool is systemctl. With a service that refuses to start or crash for some reason
If a service is misbehaving, failing to restart, or not running on boot, systemctl shows you the truth. It also handles manual restarts for quick troubleshooting.
Check the status of any service:
systemctl status nginx
systemctl status pvedaemon
systemctl status docker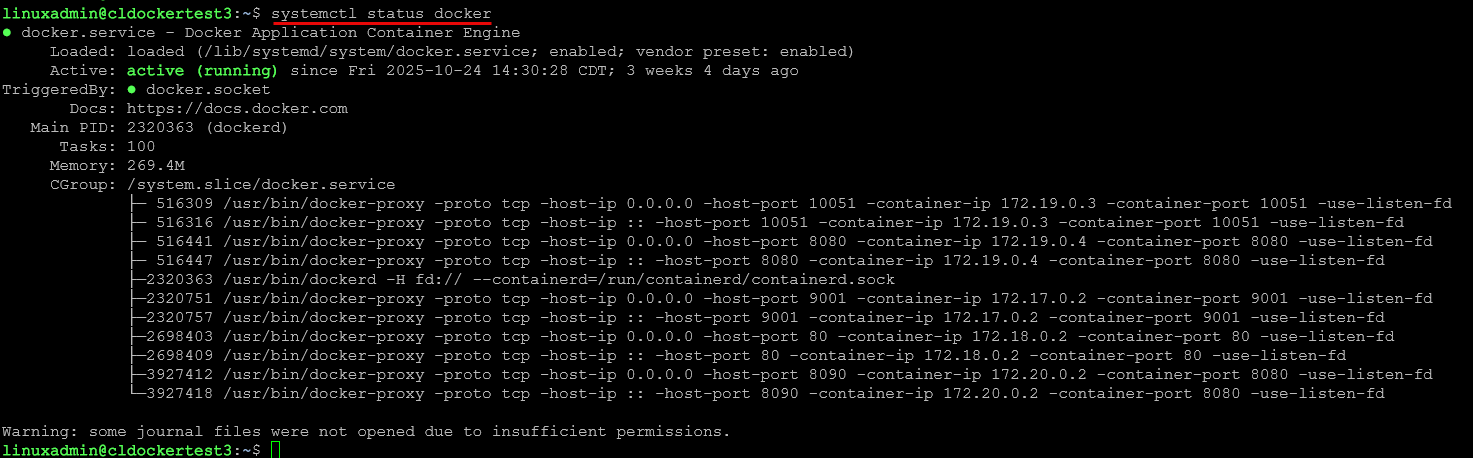
Start, stop, or restart the service:
systemctl restart nginx
systemctl start docker
systemctl stop grafana-server
Enable a service to auto start on boot:
systemctl enable prometheustop, htop, and btop
These tools are really great for seeing your resource usage in Linux, or even something like your Proxmox host: top, htop, and btop. If you want to see resources from the command line, this is the way to do it. When you think about it, on a Linux server, you don’t have a GUI to take a look at resources, so these tools are really needed to do that.
Problems with resources can cause a lot of problems in a home lab, especially when we are dealing with overloaded hardware or trying to run a lot of different workloads on the same hardware, maybe even nested installations.
Use top for the built in tool that is included in most distros.
top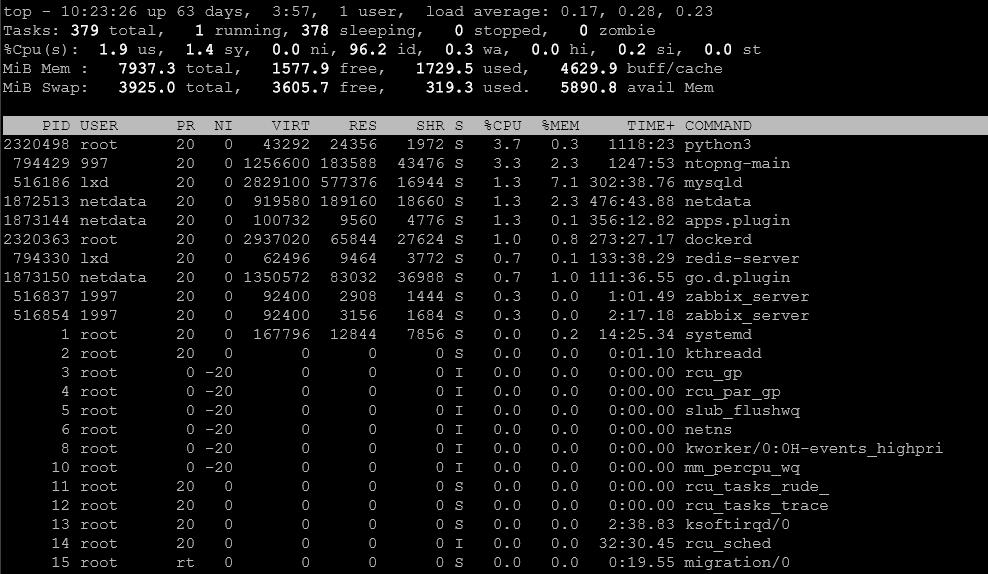
If you want a better visual interface, you can use htop.
htop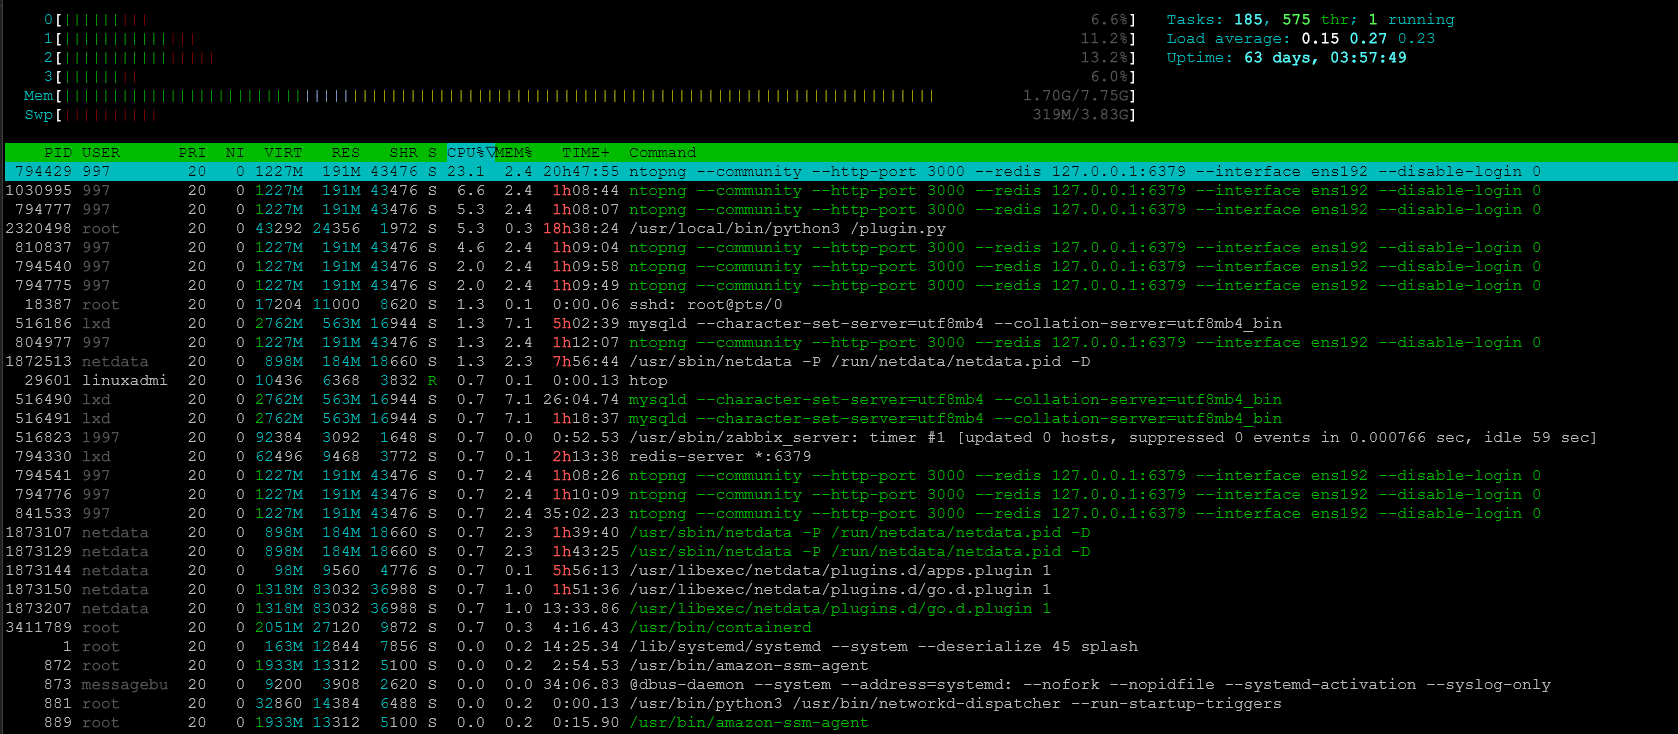
Finally, use btop for what is arguably the best resource dashboard in the terminal interface for seeing everything and making sense of the information it displays. However, this is one that you will need to install most likely as it isn’t included by default. On Ubuntu Server, you can use:
snap install btop
apt install btop
After installing, just type the command:
btopBelow, you can see the really nice output that you get from btop and the information it gives you.
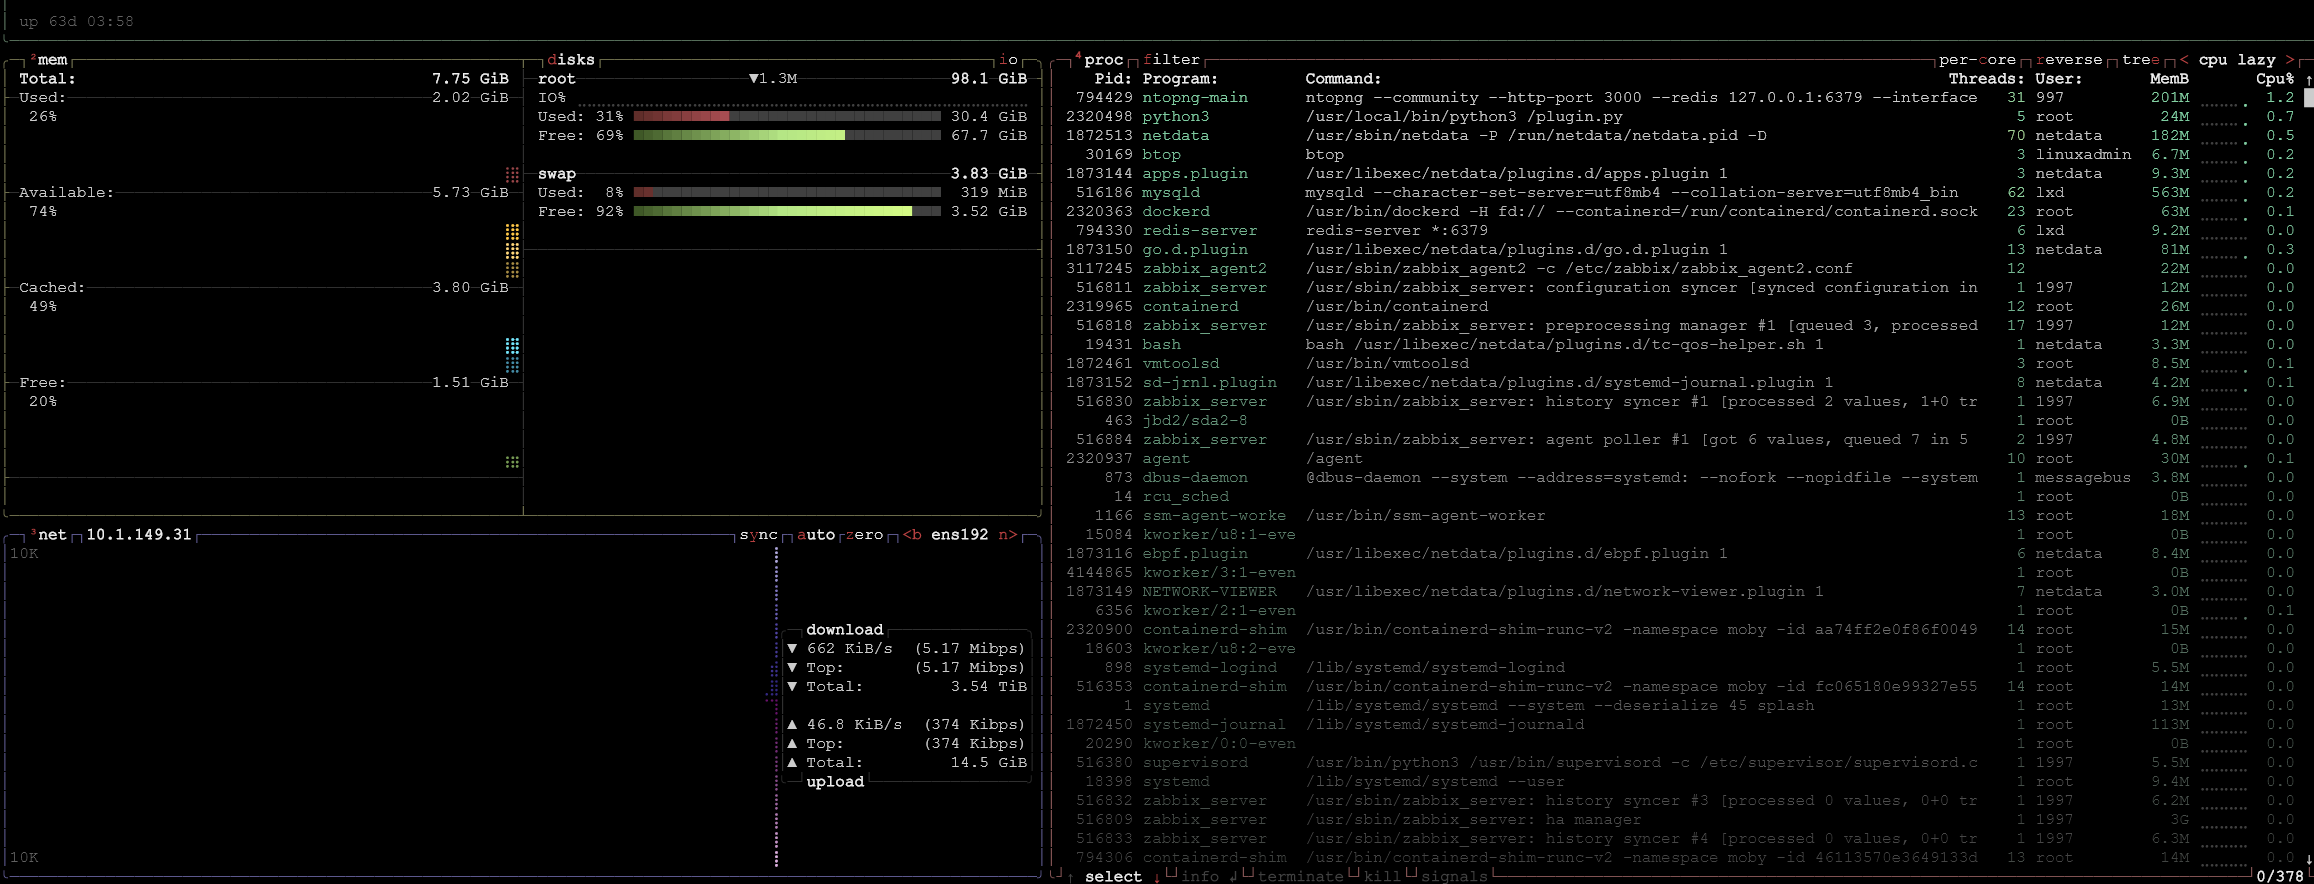
These commands reveal CPU steal time, memory exhaustion, overloaded threads, runaway processes, and load averages. If something is slow, this is where you look first.
dmesg
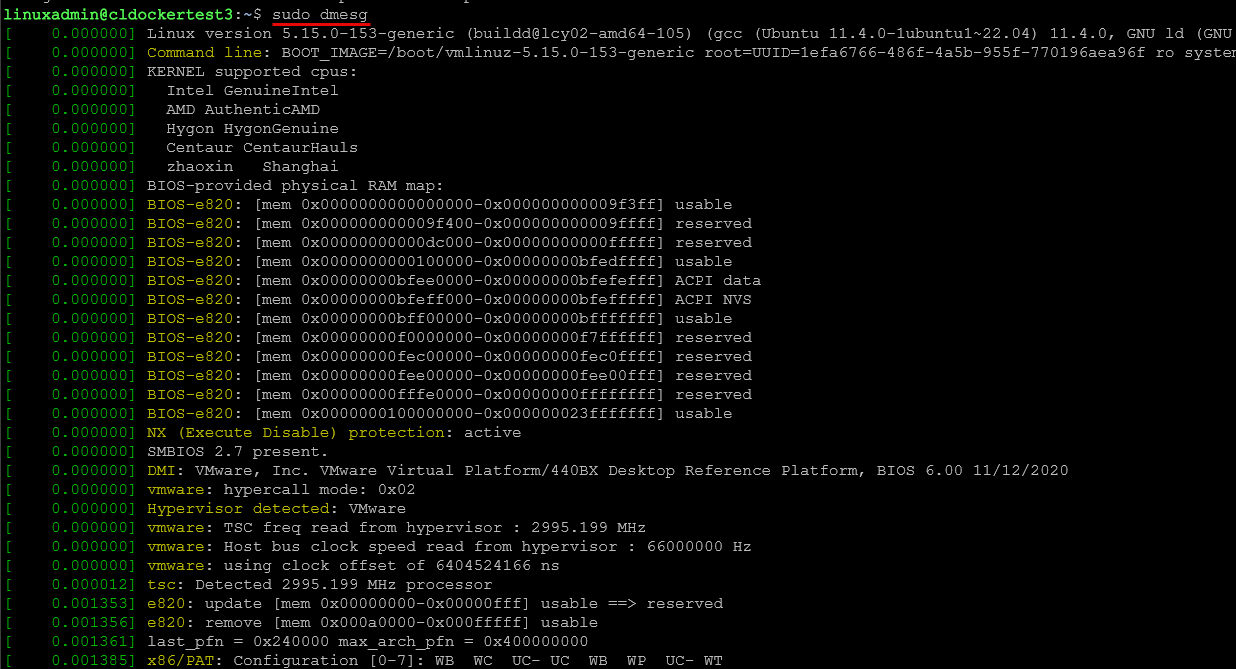
The purpose of the dmesg command is to show kernel messages. The kernel messages log is where things like hardware issues will show up. If you want to know why a hard drive vanished from the config, or why something like a PCIe GPU didn’t initialize, why a kernel module didn’t load, this is what will help show the reason why.
View all messages:
dmesgView only error messages:
dmesg --level=errFollow messages in real time:
dmesg -wOn Proxmox nodes, dmesg is a great tool for troubleshooting things like ZFS problems, drive failures, GPU passthrough issues, etc.
lsblk
One of the common issues that comes up in Linux troubleshooting in the home lab is storage mapping issues. When you install a new NVMe drive, or pass through disks to virtual machines, you will need to confirm what your system sees. This is where lsblk comes into play.
You can use the following command to list all the block devices on your system:
lsblk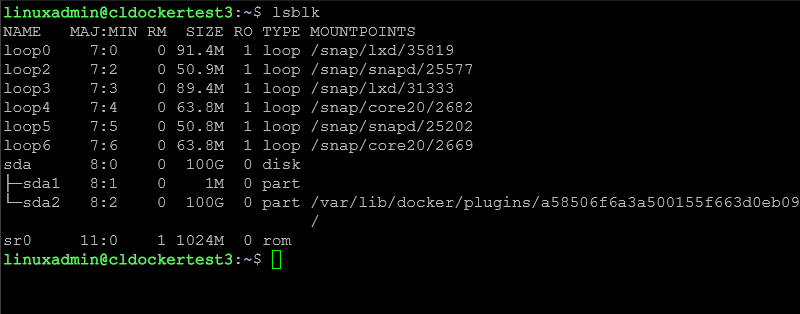
If you want to show the file system types on the mount points, use the following:
lsblk -fCheck major and minor device numbers for advanced troubleshooting as well:
lsblk -o NAME,MAJ:MIN,FSTYPE,SIZE,MOUNTPOINTEvery time you expand your storage or add new disks, this is the command to start with just for high-level checks, but just know it can also be used for deeper troubleshooting as well.
df -h
Disk space issues are some of the more common issues with storage in the home lab or production environments. A full disk can cause major issues and cause corruption as well. One of the best go to tools to use is the df command.
Check overall storage use across your mount points in a human readable format:
df -h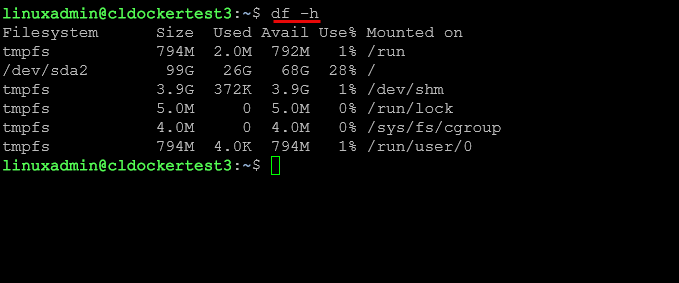
This is also a handy command if you need to check the storage inside a container, you can exec in and do that with the following:
docker exec -it containername df -hIf you need to check your ZFS pools specifically for Proxmox, use the following:
df -h /rpooldu -sh *
In Linux when you know the disk is full from the above “df” command, how do you know what is taking up the space? That is where the du -sh * command comes into play. I can’t tell you how many times I have used the du -sh * command or a variation to track down which folder is consuming all the disk space on a particular mount point.
The du command gives you a simple way to track down storage usage. For example, to find the largest directories in the current folder:
du -sh *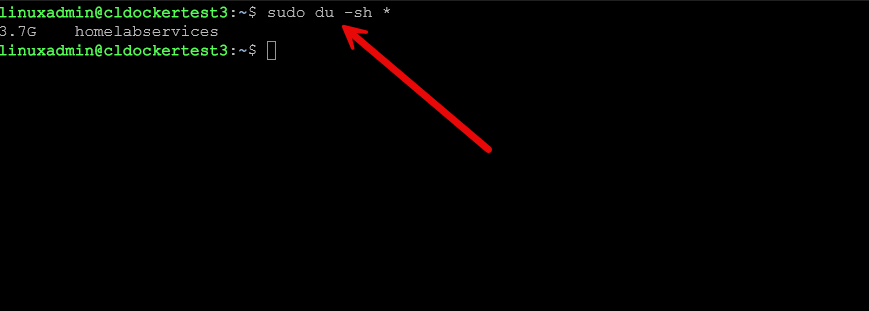
Find large files recursively:
du -sh /var/* | sort -hThis is a command line that I have saved from using it many times. This command gives you the output in 1G format and sorts the top 20 folders from largest to smallest:
du -ah --block-size=1G / | sort -rh | head -n 20free -h
Don’t forget about memory pressure. Memory pressure can cause system performance to come to a crawl, container failures, and extreme swap usage and disk activity. The free command line tool is the tool that allows you to easily see the overall memory footprint on the system and how much is “free.
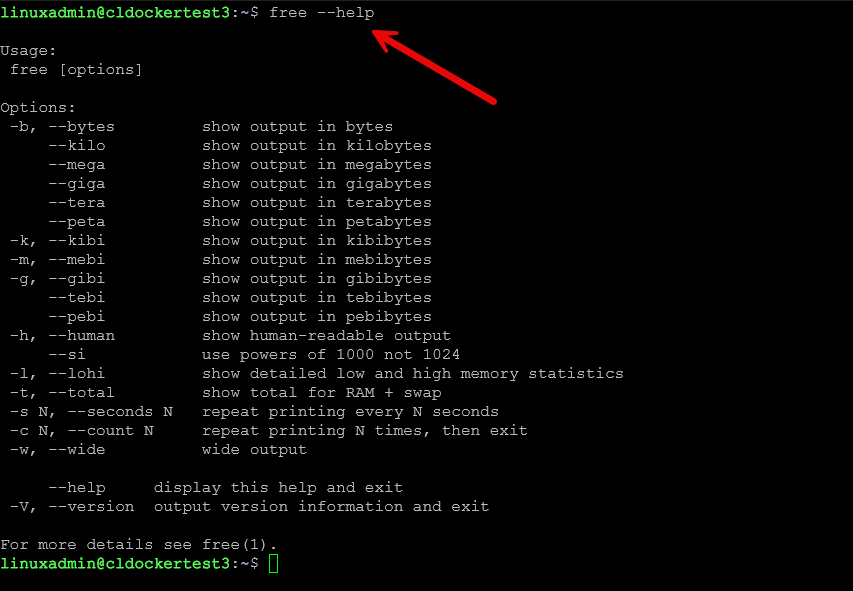
To get a very human readable output, use the command:
free -hLook for things like:
- Low available memory
- High swap usage
- Buffer cache growing too large
Combine free with htop to get a full picture of RAM behavior and what is causing the memory pressure.
ss -tulpn
I have used the netstat command for a LONG time across both Linux and Windows. However, in the Linux world, there is a newer tool that replaces the old netstat tool. This is the ss tool and it shows exactly what ports are listening, what processes are bound to those ports, and what connections are active.
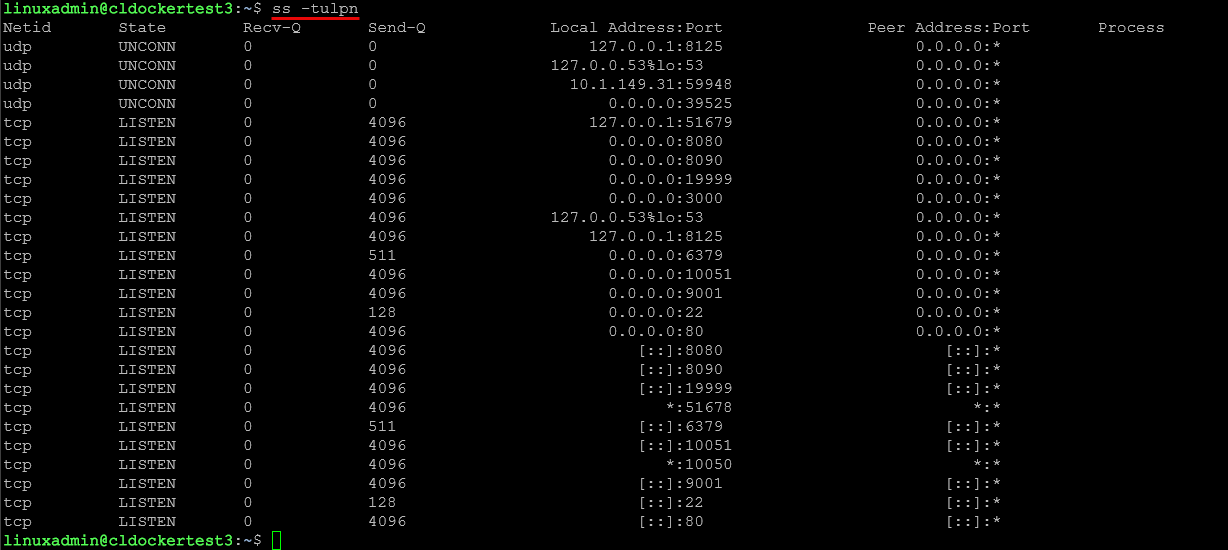
Note the following parameters you can use to get valuable output from the ss tool. To list the listening ports:
ss -tulpnList all connections:
ss -tunapYou can search for a specific port by combining it with grep:
ss -tulpn | grep 8080This is essential when debugging container networking, Kubernetes services, reverse proxies, or failed TCP services.
ps
The ps tool
Sometimes a process gets stuck, runs away with CPU usage, or refuses to shut down. If you run ps by itself, it gives you all the processes running for your user. The ps aux command shows you all running processes and their resource consumption:
ps aux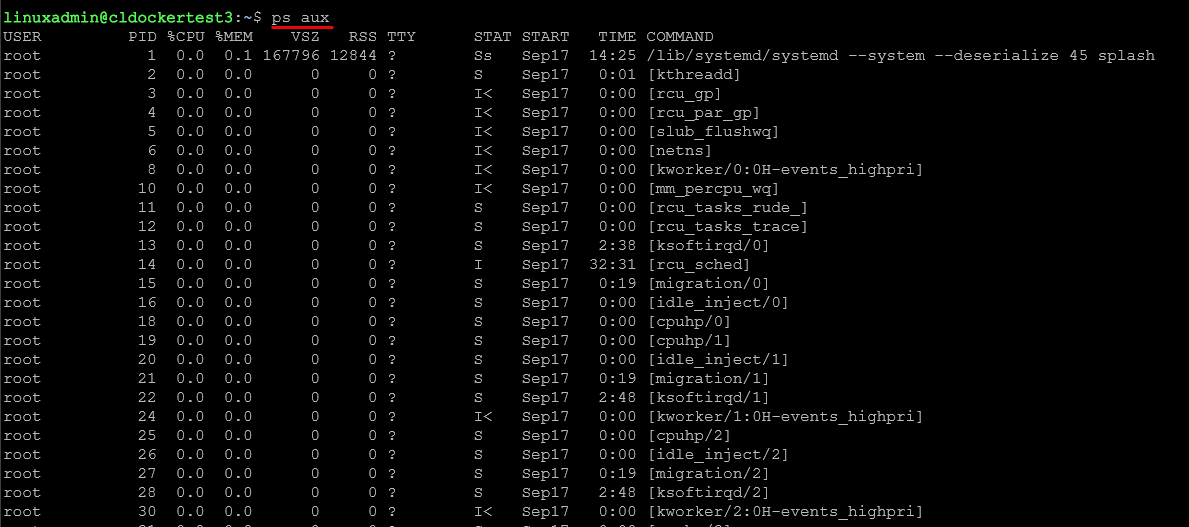
You can also filter by process:
ps aux | grep nginxCombine it with the kill command to kill a specific process. After getting the PID from the ps command, feed this into “kill”.
kill -9 PIDPs aux is also helpful when containers leave zombie processes or Kubernetes pods spawn unexpected child processes and you need to have visibility to these.
nginx -t
If you run Nginx reverse proxies, Nginx Proxy Manager, or custom configs for services, configuration errors are common. Before restarting Nginx, always test the configuration.
nginx -tIf you are using Docker:
docker exec -it nginxcontainer nginx -t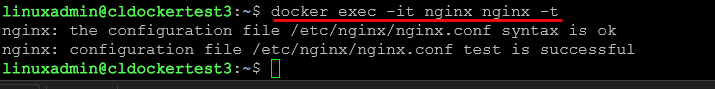
If Nginx fails to load, your entire home lab may appear to be offline. This command prevents that.
kubectl get events
If there is one solution that you WILL BE troubleshooting it is Kubernetes 🙂 There is a helpful command to memorize with the kubectl command and that is the kubectl get events command. K8s nodes and pods throw a lot of errors when things break. The events will tell you things you need to know when pods fail to schedule, containers crash, or services cannot mount storage.
The events log will help tell you why:
kubectl get events --sort-by=.metadata.creationTimestamp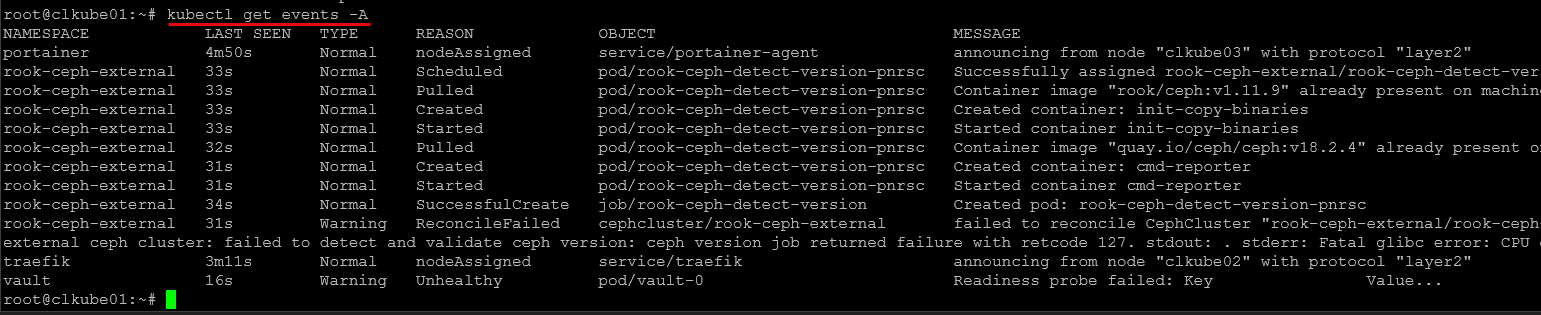
Check events for a specific namespace:
kubectl get events -n kube-systemCheck events for a pod:
kubectl describe pod podnameThis is one of the most valuable commands for anyone running a Kubernetes cluster in the home lab
zfs list and zpool status
The zfs list and zpool status commands are great commands to know if you use Proxmox with ZFS or you are running something like TrueNAS SCALE. If you run ZFS long enough it is likely you will at some point need to troubleshoot pool issues. These commands help you to see pool health, dataset sizes, available space, and other types of failures.
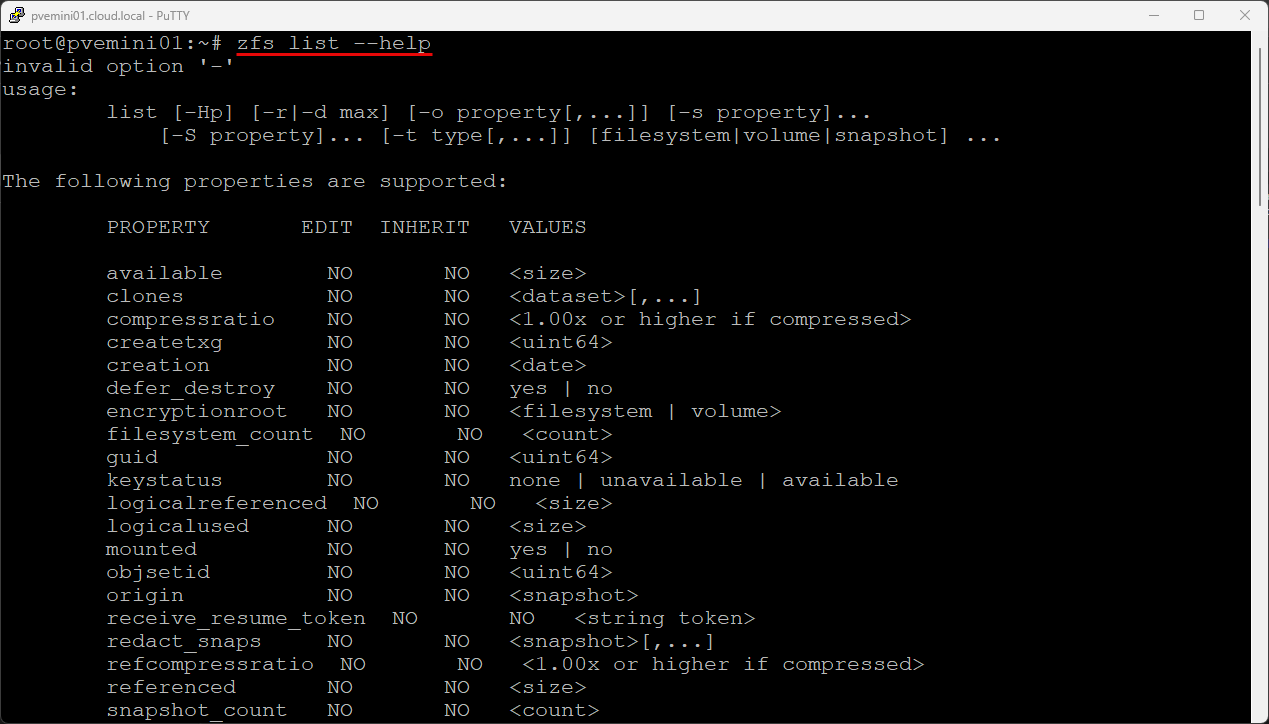
List datasets and usage:
zfs listzpool status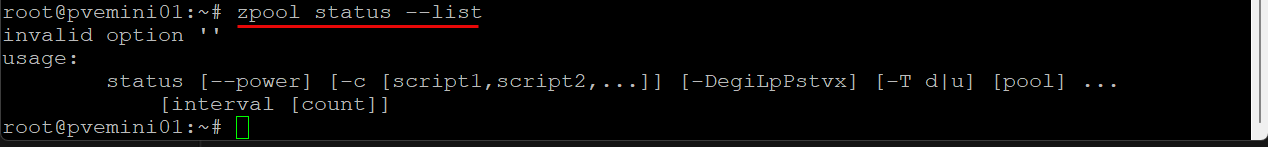
Look for things like:
- Degraded pools
- Failed disks
- Rebuild progress
- SMART errors bubbling up from underlying hardware
ZFS provides more detail about underlying disks than almost any other filesystem.
pveperf
The pveperf tool is a really helpful tool that helps with spotting Proxmox performance issues. It is not made for synthetic testing but instead of that, it helps you spot slow storage, swap, or issues with the CPU.
pveperf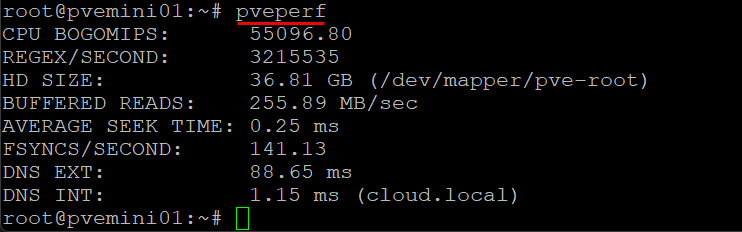
You will see measurements for:
- FSYNCS per second
- L1/L2 cache performance
- Disk throughput
- Storage latency
If VMs feel sluggish out of nowhere, pveperf is a great place to begin comparing historical performance.
smartctl
The smartctl tool helps you diagnose disk failures or slow performance based on SMART data. This tools helps surface SMART errors on SSDs, NVMe drives, or spinning disks before an all out failure happens.
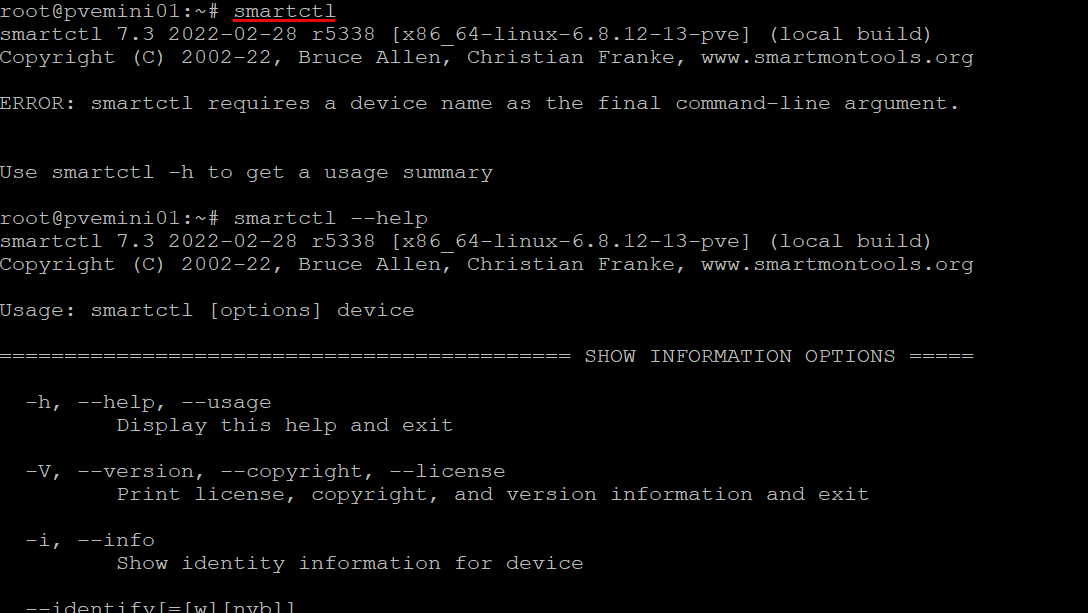
Check smart information on a particular drive.
smartctl -a /dev/sdaCheck NVMe drives:
smartctl -a /dev/nvme0n1Run a drive self test:
smartctl -t short /dev/sdaIf you experience I/O waits, slow ZFS rebuilds, or strange kernel logs, always check smartctl.
Video
Wrapping up
Troubleshooting in the home lab I can guarantee is one of the best “skill multipliers” that you can use to level-up your expertise. When you know how to quickly diagnose issues using the right Linux commands, you will know more than most other engineers know to be honest. Before someone can Google or pull up their favorite AI chat interface, you will be able to run 1-3 commands and be getting close to a root cause. These 15 commands are ones that will get you through almost any issue you face running Linux in a home lab or even production environment in 2025 and beyond. I use one of these at least every day when working with Linux machines, troubleshooting, configuring, etc. What about you. What commands do you include on your must-know troubleshooting commands for Linux?
Google is updating how articles are shown. Don’t miss our leading home lab and tech content, written by humans, by setting Virtualization Howto as a preferred source.
About The Author


Very good list! I spotted a couple here that I need to familiarize myself with.
Nice list. I’ve saved this post for future reference. There is an Oops in the example for the du -sh command. The example actually shows the command failing because of a missing dash preceeding the sh options.
Daryl,
Thanks for that! I will take a look at the example command and make the edits there. Thank you for pointing this out!
Brandon
Screen for du -sh * is not entirely successful 🙂
Thank you Filip! I missed the dash on the command there. Should have noticed it in the command output. Thank you again! I have updated the blog, but should be:
sudo du -sh *
Brandon