Recently, you may have seen some automation I have been doing with AI to self-heal and correct things in the home lab. One of those workflows I have been using is for Docker containers and making sure these are self-healed and can be restarted and other things if there are failures. However, I would like to introduce you to another free tool that I have found to be extremely powerful when it comes to monitoring and automating self-healing of your Docker environment. It is called LogForge. Let’s see what this tool is, what it can do, and how I am using it.
Easy monitoring?
When you’re running multiple Docker containers in your home lab or production setup, keeping track of what’s running, what’s crashed, and which logs matter can definitely get messy. There are free and open-source tools like Loki, Promtail, and Grafana.
These can give really good insights to things going on, but they can take a lot of time to configure and they have multiple moving parts. That’s where the tool, LogForge steps in. It is a self-hosted Docker monitoring dashboard and alerting platform that gives you real-time visibility and alerting, and, more importantly, automation to self-heal and correct problems as these happen.
What is LogForge?
In a nutshell, LogForge is a self-hosted monitoring and alerting solution. However, something it has that other solutions don’t have for your self-hosted docker application is “self-healing” out of the box. If you don’t know what we are talking about with self-healing, take a look at my recent post on this topic: How I Built a Self-Healing Home Lab That Fixes Itself.
LogForge gives you a live view of your containers and also rule-based alerting. As we will see, it then allows you to automatically respond to issues and performs self-remediation tasks for you. You can monitor your containers, stream logs, trigger alerts on events that you want to trigger on. Then you can run built-in tasks that it comes with or scripts that you bring to restart services automatically.
Check out the official project here: log-forge/logforge
Architecture
When you spin up the docker compose of the LogForge solution, it will create six containers that make up the architecture of the solution. By default, it sets containers servicing the frontend, backend, alert engine, notifier, and autoupdate service. You can customize their ports and names in the .env file as you will see below.
- logforge-alert-frontend
- logforge-alert-backend
- logforge-frontend
- logforge-notifier
- logforge-backend
- logforge-auoupdate
LogForge Frontend
The frontend containers as part of the architecture provides the GUI for browsing your containers, toggling on monitoring, viewing current alerts, and browsing files inside the containers.
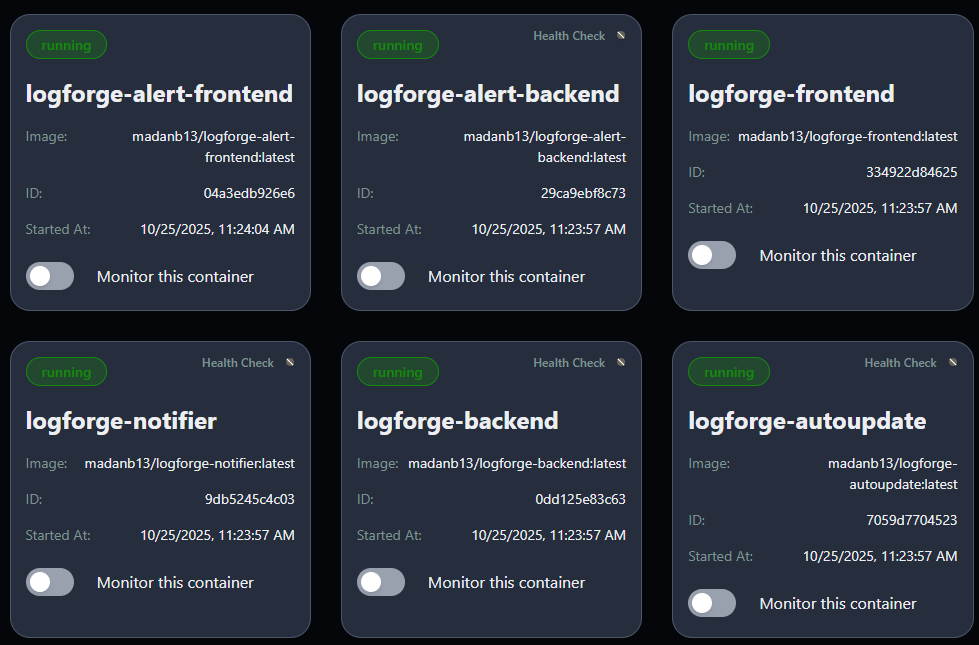
LogForge Notifier
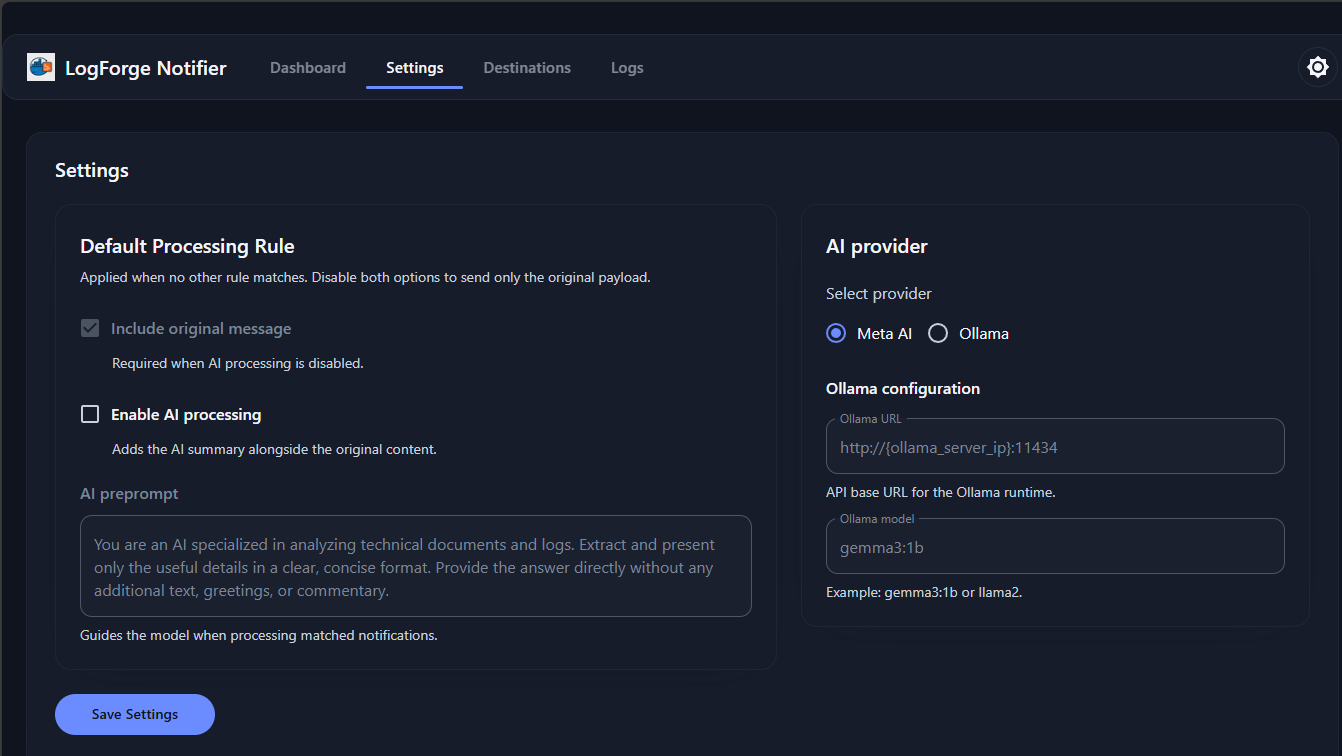
The notifier is where you configure the destinations for your notifications. Also, very cool is the ability to send notifications through local AI so you can get AI intelligence to summarize the notifications and present only the useful details. You can use local AI engines, like Ollama.
LogForge Alert Engine
The alert engine is where you configure the rules that trigger notifications.
Installing LogForge
You can pull down the Docker Compose stack file from the official repo, which you can use to get up and running quickly. The only thing I modified was the bind mount I wanted to use for the Docker volumes in my environment.
services:
  logforge-backend:
    image: madanb13/logforge-backend:latest
    container_name: ${LOGFORGE_BACKEND_CONTAINER_NAME:-logforge-backend}
    networks:
      - logforge-network
    volumes:
      - logforge_core_data:/app/app/core/data
      - /var/run/docker.sock:/var/run/docker.sock
    restart: unless-stopped
    labels:
      - "com.centurylinklabs.watchtower.enable=${AUTO_UPDATE:-true}"

  logforge-frontend:
    image: madanb13/logforge-frontend:latest
    container_name: ${LOGFORGE_FRONTEND_CONTAINER_NAME:-logforge-frontend}
    environment:
    - VITE_NOTIFIER_PORT=${NOTIFIER_WEB_PORT}
    - VITE_ALERT_ENGINE_PORT=${ALERT_ENGINE_FRONTEND_PORT}
    ports:
      - "127.0.0.1:${LOGFORGE_FRONTEND_PORT:-3008}:3000"
    networks:
      - logforge-network
    restart: unless-stopped
    depends_on:
      - logforge-backend
    labels:
      - "com.centurylinklabs.watchtower.enable=${AUTO_UPDATE:-true}"

  logforge-notifier:
    image: madanb13/logforge-notifier:latest
    container_name: ${NOTIFIER_SERVICE_CONTAINER_NAME:-logforge-notifier}
    ports:
      - "127.0.0.1:${NOTIFIER_WEB_PORT:-8087}:8085"
    volumes:
      - logforge_notifier_data:/app/data
      - /etc/localtime:/etc/localtime:ro
    networks:
      - logforge-network
    restart: unless-stopped
    labels:
      - "com.centurylinklabs.watchtower.enable=${AUTO_UPDATE:-true}"

  logforge-autoupdate:
    image: madanb13/logforge-autoupdate:latest
    container_name: ${AUTOUPDATE_SERVICE_NAME:-logforge-autoupdate}
    volumes:
      - /var/run/docker.sock:/var/run/docker.sock
    restart: always
    labels:
      - "com.centurylinklabs.watchtower.enable=${AUTO_UPDATE:-true}"

  alert-engine-backend:
    container_name: ${ALERT_ENGINE_BACKEND_CONTAINER_NAME:-logforge-alert-backend}
    image: madanb13/logforge-alert-backend:latest
    volumes:
      - logforge_alert_engine_data:/app/data
    restart: unless-stopped
    labels:
      - "com.centurylinklabs.watchtower.enable=${AUTO_UPDATE:-true}"
    healthcheck:
      test: ["CMD", "/app/alert_engine", "--selfcheck"]

      interval: 30s
      timeout: 10s
      retries: 3
      start_period: 40s
    networks:
      - logforge-network
    depends_on:
      - logforge-backend
      - logforge-notifier

  alert-engine-frontend:
    container_name: ${ALERT_ENGINE_FRONTEND_CONTAINER_NAME:-logforge-alert-frontend}
    image: madanb13/logforge-alert-frontend:latest
    ports:
      - "127.0.0.1:${ALERT_ENGINE_FRONTEND_PORT:-3033}:3033"
    environment:
    - ALERT_ENGINE_FRONTEND_PORT=${ALERT_ENGINE_FRONTEND_PORT:-3033}
    depends_on:
      alert-engine-backend:
        condition: service_healthy
    restart: unless-stopped
    labels:
      - "com.centurylinklabs.watchtower.enable=${AUTO_UPDATE:-true}"
    networks:
      - logforge-network

networks:
  logforge-network:
    driver: bridge
volumes:
  logforge_notifier_data:
  logforge_core_data:
  logforge_alert_engine_data:
You can also use the .env file to customize the solution, container names, port values, etc. As a note, if you don’t use the .env it will spin up fine, using the defaults.
# Container names
LOGFORGE_BACKEND_CONTAINER_NAME=logforge-backend
LOGFORGE_FRONTEND_CONTAINER_NAME=logforge-frontend
ALERT_ENGINE_BACKEND_CONTAINER_NAME=logforge-alert-backend
ALERT_ENGINE_FRONTEND_CONTAINER_NAME=logforge-alert-frontend
AUTOUPDATE_SERVICE_NAME=logforge-autoupdate
NOTIFIER_SERVICE_CONTAINER_NAME=logforge-notifier

# Host ports exposed by default
LOGFORGE_FRONTEND_PORT=3008
NOTIFIER_WEB_PORT=8087
ALERT_ENGINE_FRONTEND_PORT=3033

#auto-update on/off
AUTO_UPDATE=true
Then:
docker compose up -dIf you want to pull down the files from the repo, you can carry out the following steps to do that:
Clone the GitHub repository:
## Clone from the LogForge repo
git clone https://github.com/log-forge/logforge.git

## Change to the LogForge directory
cd logforge
Next, simply launch the containers:
docker compose up -d --buildNow, you will be able to browse out to the LogForge frontend:
http://localhost:3008As a note that I think is also cool is the configuration enables auto-update, which uses a built-in service similar to Watchtower. It keeps your LogForge stack up to date without needing to manually set this up.
LogForge interface
I found the LogForge interface to be intuitive. In fact, just a couple of minutes of clicking around, you will have a good feel for where everything lives and where you configure things. Let’s look at a few of the high points.
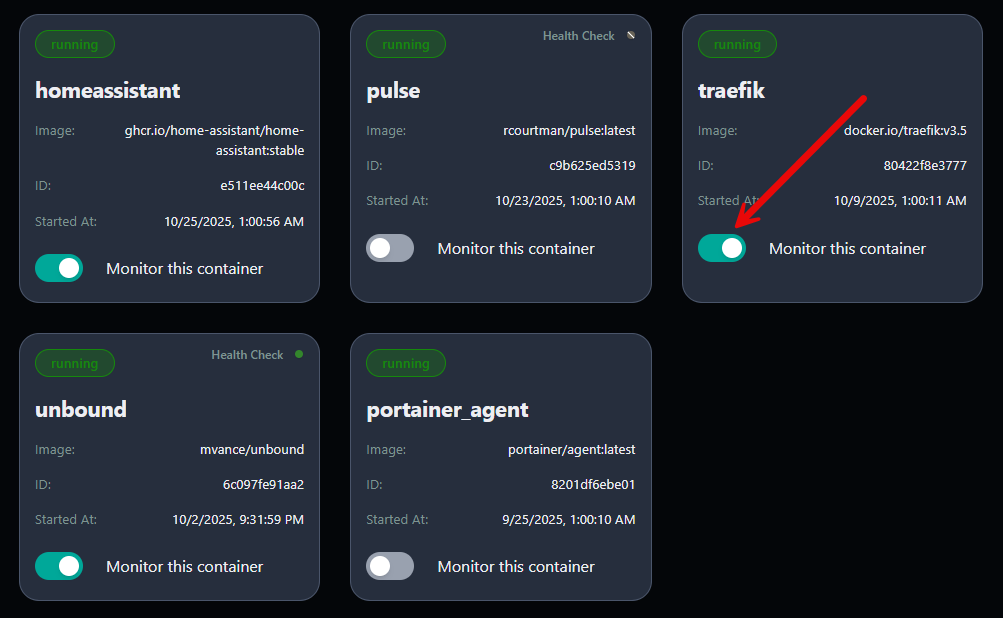
Toggling on monitoring for containers
The way you start monitoring containers is simple. Each container tile has a toggle switch that you simply flip on to start monitoring that particular container in the dashboard at port 3008.
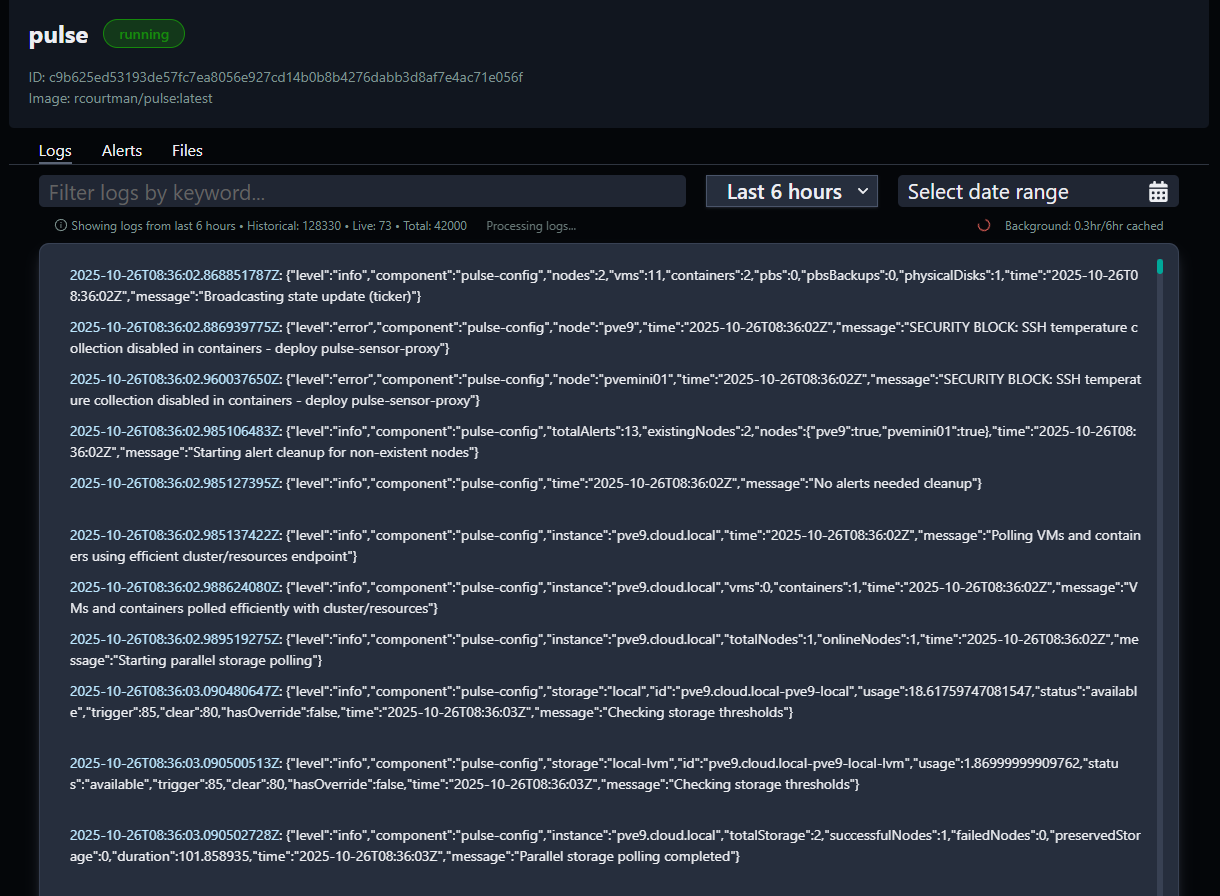
Viewing logs for a container
You can easily view logs for a container by clicking the container tile. It defaults to the Live log view. However, as shown below, you can take it out to 6 hours of history and also selected date range.
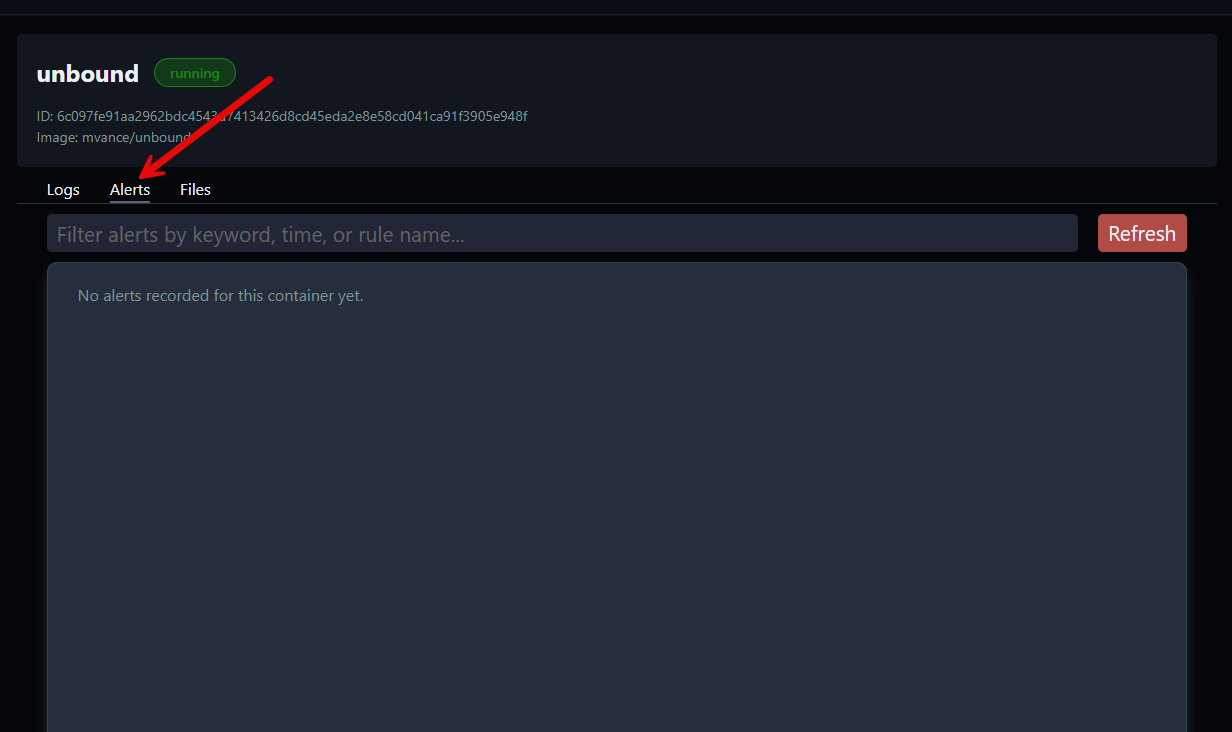
Viewing alerts for containers
Once you click any of the containers, you will see the Alerts tab. Here is where you will see any active alerts for the specific container you have drilled into.
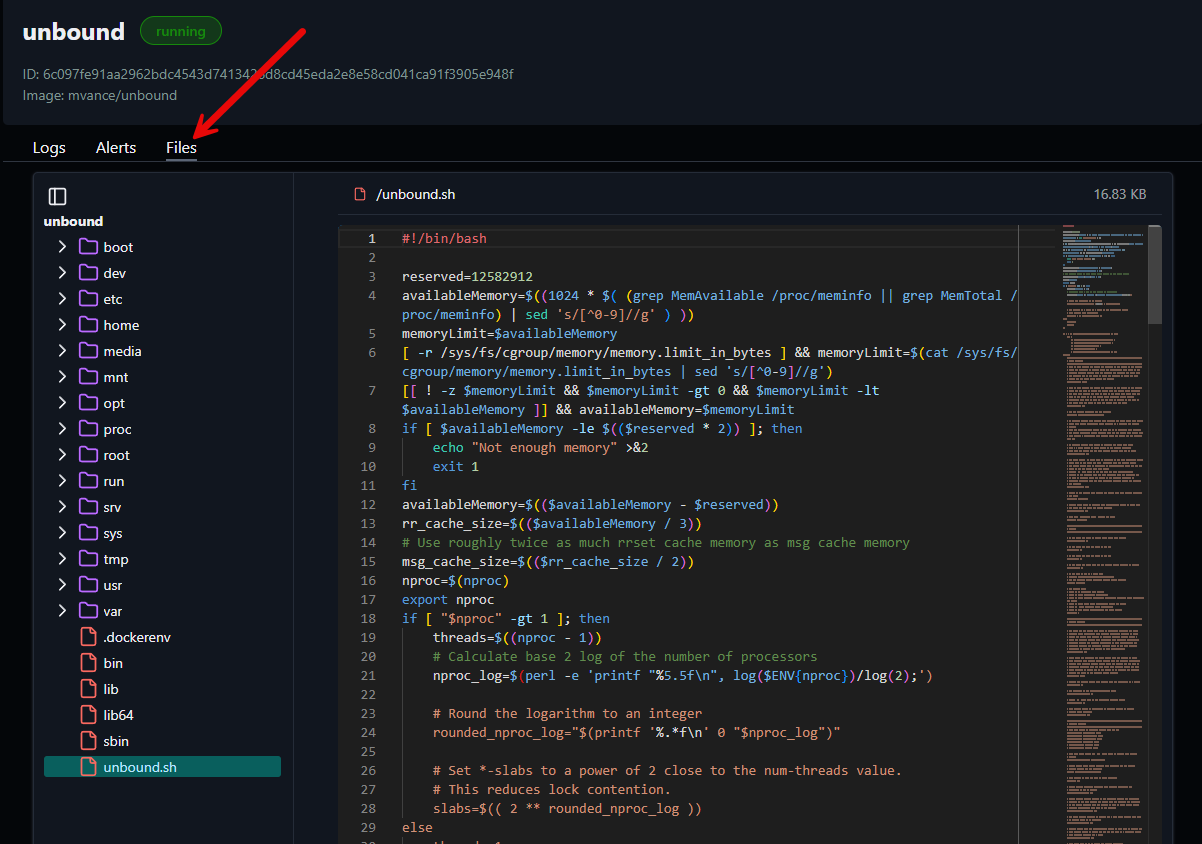
Viewing files in your containers with LogForge
This is a really cool feature that I like. On the Files tab, it displays the files on the inside of the container like a file browser. So, you don’t have to exec into the container from the command line, just do this from the LogForge interface.
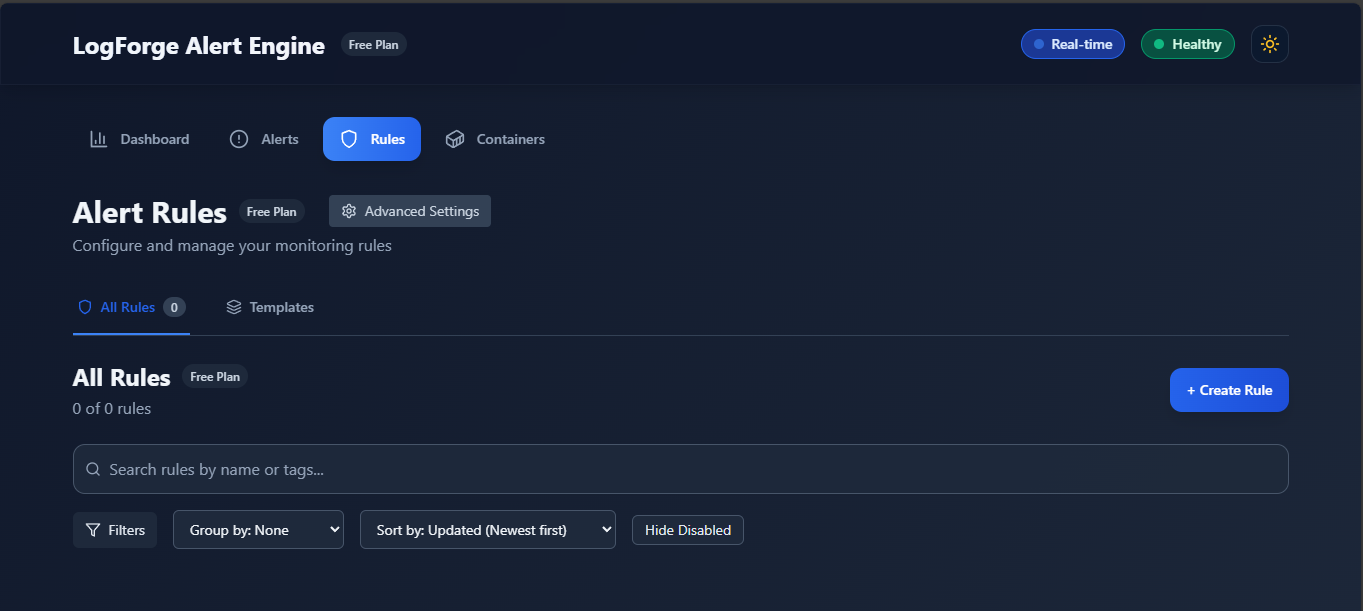
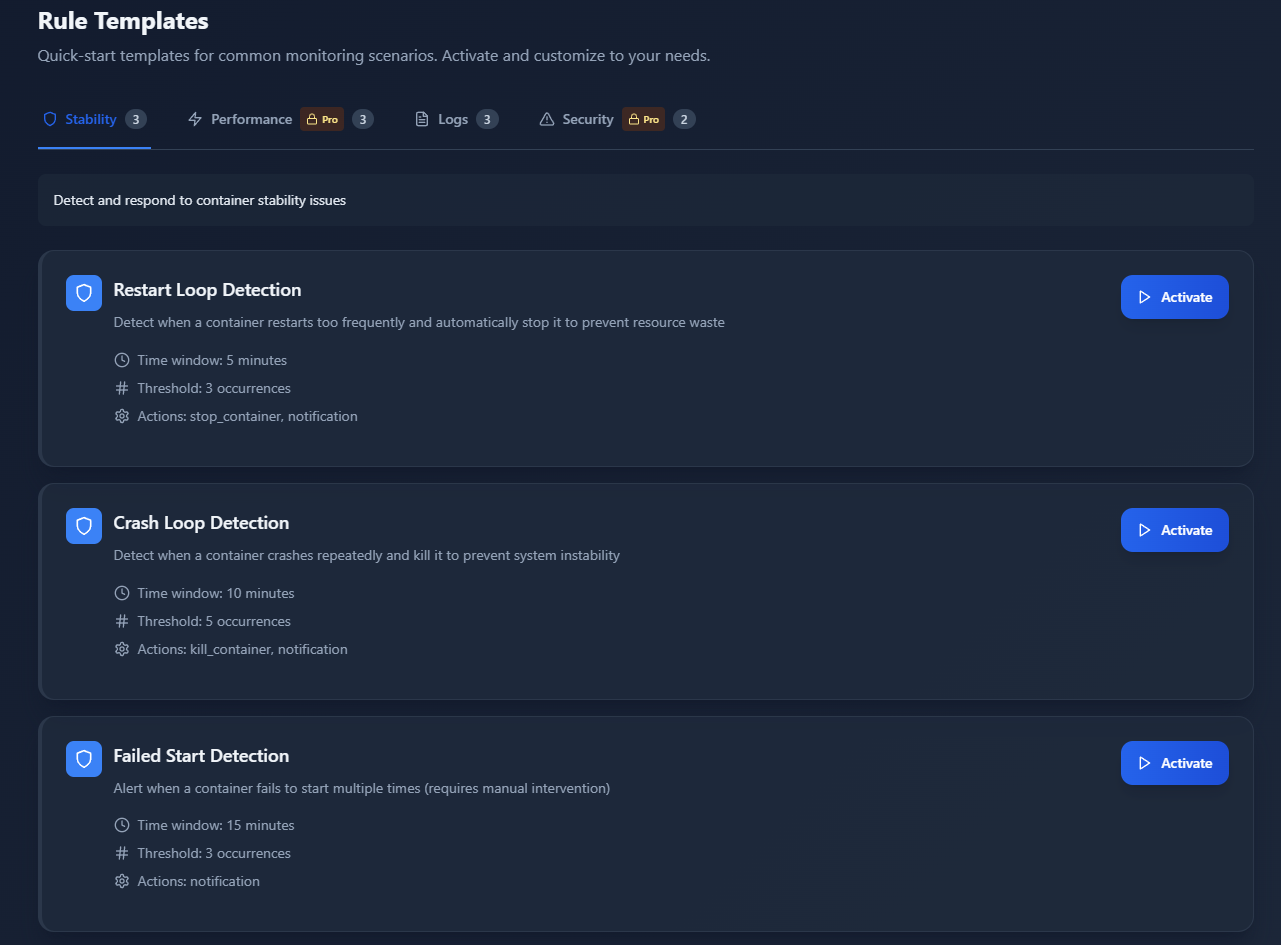
Rule templates
One of the things I really like about LogForge is the self-healing that it comes with out of the box. You can find these in the LogForge Alert Engine > Rule Templates. These provide out of the box detection and remediation actions that I think most would want to have in their Docker environment.
Below, you can see the following templates under the Stability menu:
- Restart loop detection
- Crash loop detection
- Failed start detection
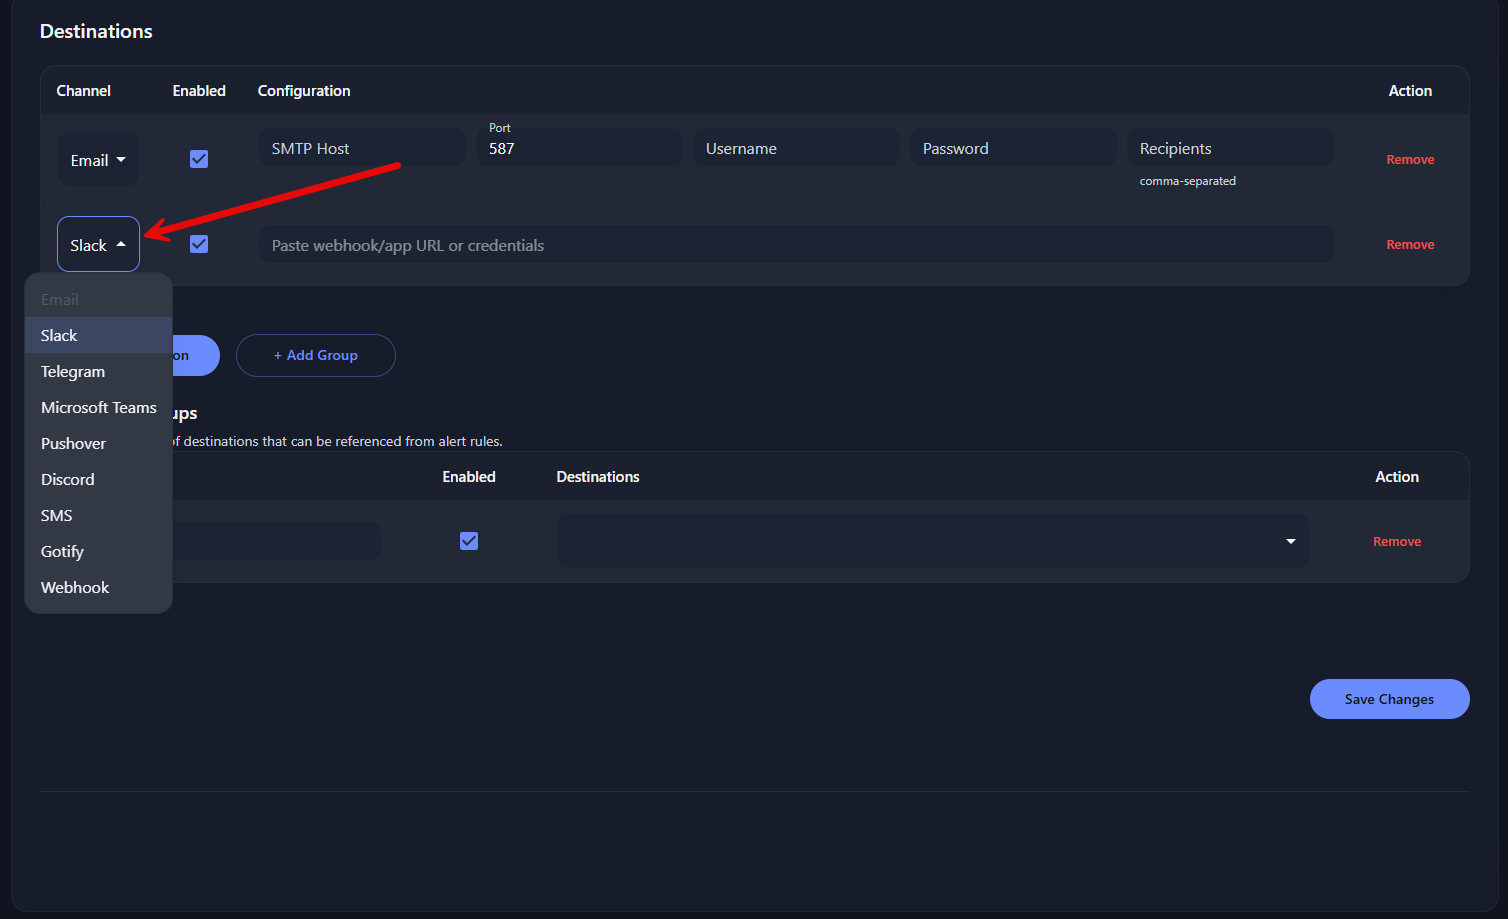
Alert destinations
LogForge can target modern notification platforms to send notifications once rules are triggered. These include:
- Slack
- Telegram
- Microsoft Teams
- Pushover
- Discord
- SMS
- Gotify
- Webhook
Features that I think make LogForge stand out
Below is a table listing the features that make LogForge a very cool solution for monitoring and alerting in your home lab or even production environment as the project matures.
| Feature | Description |
|---|---|
| Auto-detection of Docker services | It detects all your running containers and shows which are active, crashed, or stopped. You don’t have to come up with config to do this, it does it automatically. It reads directly from your Docker socket (/var/run/docker.sock) for live data. |
| Grouping and selective monitoring | You can group your containers and create logical monitoring structures. For example, group your core infrastructure, home lab testing containers, and any development containers you have. |
| Real-time log streaming and filtering | LogForge provides live log streaming directly in the browser with filtering. You can search for specific keywords or events across containers. This helps you eliminate the need to SSH in and run the docker logs command. |
| Customizable alerts and notifications | Create rules that trigger alerts when certain log entries, container events, or metrics occur. As an example when a container crashes twice in five minutes or a specific error appears. Notifications can be sent to Email, Slack, Discord, Telegram, Gotify, and more, really any modern notification platform or webhook. |
| Safe auto-remediation | Beyond alerts, LogForge can automatically take actions like restarting or stopping containers, running scripts, or chaining certain actions together. It includes safeguards like cooldown and backoff timers, and rate limits to prevent restart loops or race conditions. |
| Rule templates and UI-based configuration | Everything is configured from the web interface. LogForge also has prebuilt rule templates for stability, performance, logs, and security. You can customize these templates. Example rules include: “If this error appears 3 times in 10 minutes, restart the container,” or “If this event happens repeatedly for 5 minutes, send a notification and mark as critical.” |
| File system access | You can also browse container file systems to inspect logs or configuration files. This keeps you from having to switch between Docker CLI or SSH sessions. |
| Alert history and noise control | LogForge keeps a full alert history so you can review past incidents and actions. You can acknowledge alerts to hide them until new activity happens. Rule configuration options like case sensitivity, AND/OR keyword logic, and ignore lists help make sure you are not inundated with false positives. |
| You control the data | Because LogForge is fully self-hosted, none of your data leaves your environment. Information like logs, alerts, and rule configurations are all stored locally. This means you have privacy and control which is great for home labs. |
Current limitations and roadmap of features
There are a few things to note about LogForge in its current version and capabilities. It is still very early on in the development lifecycle, so keep that in mind. Features will be rapidly added and it is exciting to see where this one will go. Note the following:
- You can currently only monitor Docker containers on the same host where you run LogForge
- So no remote Docker host monitoring yet
- There are a limited number of built-in templates – development plans on expanding these to include many new templates. These will include AI-assisted rule creation to help with creating rules with natural language.
- Currently it only supports Docker exclusively
- Future releases are on the roadmap to support both Kubernetes and Docker Swarm
- No Role-based Access Control (RBAC) currently – This feature is on the way in a future release to allow assigning roles like admin, developer, viewer, etc.
- Currently no enterprise team functionality – This is on the roadmap to include centralized team management with shared dashboards and alert configs, advanced analytics, cloud and on-prem log retention
- Limited integrations – currently you can integrate with Slack, Discord, Gotify and others. Future releases will offer things like Jira and GitHub integration
- More AI-powered features like semantic search and anomaly detection are on the roadmap
So, just keep in mind this release covers the basics really well, but more is on the way with many very cool features planned for future releases.
Comparing LogForge to other tools you may be familiar with
Take a look at the comparison below to see how LogForge compares with solutions you have no doubt tried in your home lab or prod environments.
| Feature | LogForge | Loki + Grafana | Dozzle |
|---|---|---|---|
| Log Streaming | Built-in | Requires Promtail | Built-in |
| Alerting | UI-based rules | Requires Alertmanager | None |
| Auto-Remediation | Safe and it is rule-based | Requires automation scripts | None |
| Setup Time | Minutes | Complex | Minutes |
| Self-Hosted Privacy | Yes | Yes | Yes |
| UI Customization | Web UI with templates | Grafana dashboards | Basic UI |
| Remote container monitoring | No (but coming) | Yes | Yes |
Free and Pro versions
One think you will notice in the interface, especially under the Alert Rules section with the rule templates is there is a Pro version of the solution. In speaking with the developer, the Pro version is a few weeks away from being delivered. The plan is to add remote hosts and extend the custom rules limits for the free plan as well as Pro version.
There isn’t word yet on pricing for the Pro version as it isn’t quite available yet. However, stay tuned here for updates on when this lands.
Wrapping up
I think that LogForge definitely fills a gap for Docker users and administrators, especially for home lab. It is super quick to deploy, completely self-hosted and it can replace what I would think to be several tools used for monitoring and alerting. In addition, the self-healing features it contains are perfect for auto remediating common issues with containers and allow you to hook into your self-hosted AI resources with Ollama for more effective summaries of issues. It does have limits currently but I suspect this project will develop very quickly and LogForge will be one to watch. How about you? Are you looking to test LogForge in your home lab?
Google is updating how articles are shown. Don’t miss our leading home lab and tech content, written by humans, by setting Virtualization Howto as a preferred source.
About The Author

Pretty neat stuff! I love how it simplifies monitoring containers without the complexity that Grafana introduces. Will definitely try this on my self-hosted setup
Munem,
Thanks for the comment! Definitely think this is going to be a great tool for home labs and even production. Definitely one to watch and see how it develops!
Brandon
Great article! The LogForge looks interesting. The license tho is not interesting at all, even for home use.
It will be interesting to see how it evolves even on the free offering.