I have been running Ceph in my Proxmox powered home lab now since the beginning of this year and it is an amazing storage solution. It provides the backend storage for things in my home lab like virtual machines, containers, and Kubernetes persistent volumes. I can confidently say that a handful of commands have saved me more times than I can count. I am going to walk through my Proxmox Ceph commands home lab notes in context to the situations or real scenarios where you might use them and how you can apply them directly to your own home lab. If you learn these commands, you will become an absolute boss working with Ceph in your home lab.
Checking overall Ceph cluster health
This is absolutely the most used Ceph command that you will type in. It is the command that you run to get a quick status check on the health of your Ceph cluster storage.
It is the following command:
ceph -s

or

ceph status
This gives you a high level view of everything. You will see health status, number of OSDs, monitors, placement groups, and whether anything is degraded or recovering.
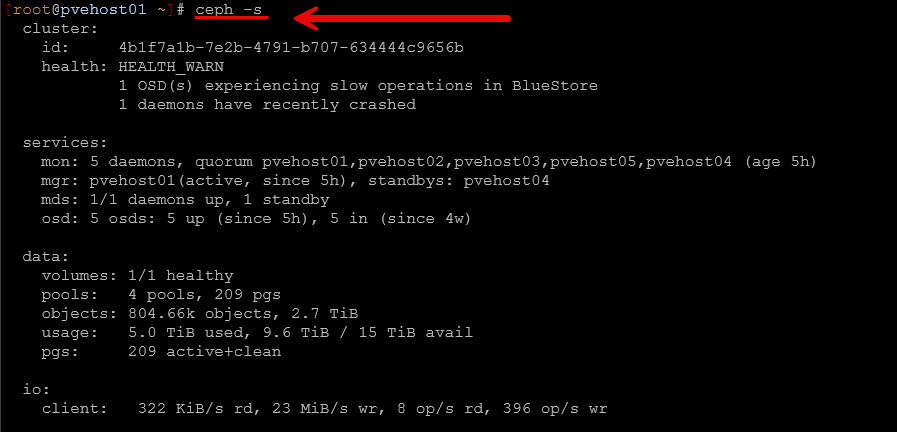
In my lab, this is usually how I detect that something is not quite right before I even feel performance issues. For example, I have seen cases where everything looked fine from a VM perspective, but ceph -s showed degraded placement groups or backfilling activity. This lets you know that you have a storage level impairment that you need to watch. This is also a quick command that I always run before applying updates, rebooting nodes, etc.
If you only remember one command from this entire post, this is the one.
Preventing a rebalance operation during maintenance periods
This is one of the most important commands I use when doing maintenance on my cluster or a specific node in general. When you have a node or OSD offline for an extended period of time and you no there isn’t really a hardware issue and the OSD will be coming back online, you don’t want Ceph to start self-healing operations if it doesn’t need to.
So, to prevent it from performing any unnecessary rebalances of your data across remaining disks and to make sure it doesn’t set a particular OSD to a status of “out”, setting the noout flag is an important one. To do that, you simply run the following on any node in the cluster:
ceph osd set noout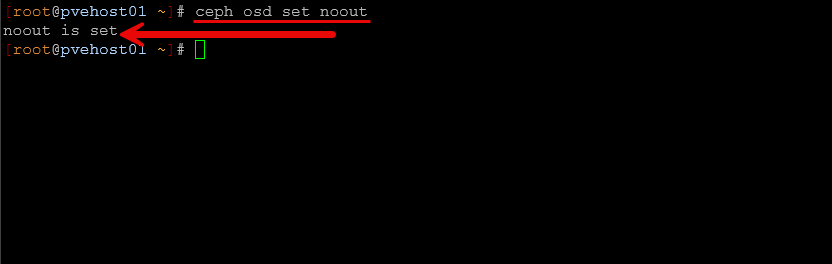
I learned this the hard way early on. I took a node down for an extended period of time to update the firmware or reboot and install a hardware adapter, etc, and suddenly the cluster would start rebalancing everything. By the time the node came back, it would rebalance all over again. This command will prevent that from happening.
After maintenance is complete, ALWAYS remember to unset it. You don’t want to leave it this way accidentally because you DO want it to rebalance when there is a need to do so like when you actually lose a drive.
ceph osd unset nooutThis would leave your cluster in a risky state where it will not properly react to real failures, so this is just as important as setting it. All in all, setting and unsetting this single command will save you a ton of unnecessary storage object churn in your cluster.
Getting more detail about Ceph warnings or errors
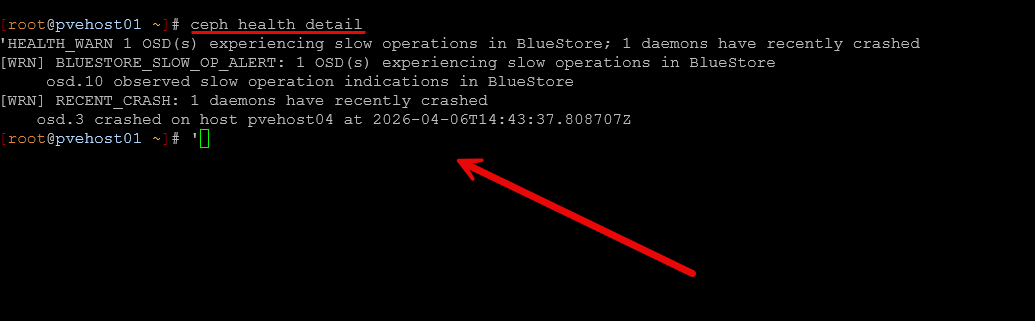
When ceph -s shows a warning, the next command that you will want to know to run is the following command that gives you more specific details on any warnings or errors.
ceph health detailAs you can see below, I have had a recent crash on an OSD and also a slow operation indication. This was during a maintenance period but it shows the point of how the ceph health detail command will shed light onto various issues.
I had a recently lingering issue that I “thought” was just a transient issue, but it turned out to be a real event with the following warning:
- clients failing to respond to cache pressure
That pointed me to an MDS client issue related to a Kubernetes node using CephFS. Without this command, I would have had no idea where to start or that it was even going on. Things were running just fine, but it shows the power of the ceph commands.
Seeing OSD layout
When I want to understand how data is physically distributed, I use the following command in my Ceph environment:
ceph osd tree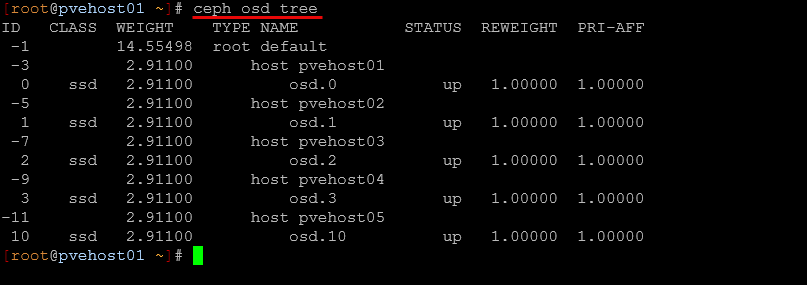
This shows you the hierarchy of your OSDs. This includes which host they belong to and their status. So this is really great information if you wnat to see also which OSD number is associated with which Ceph cluster host.
This command is helpful for a lot of different reasons, but it comes in handy especially when:
- You suspect a node is overloaded
- You are planning maintenance
- You want to verify CRUSH placement
In my setup with multiple mini PCs, this helps confirm that data is balanced across nodes and that no single host is carrying too much load in the config unnecessarily.
Checking your storage use
To get more details on the amount of storage you have used in your Ceph pools, there is a purpose-built command for that. It is the following:
ceph df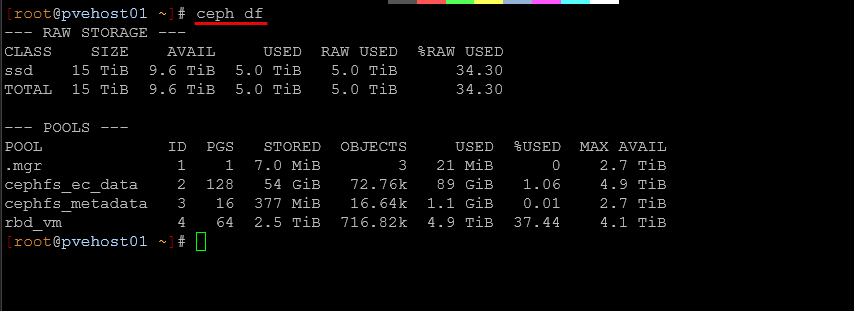
This shows actual storage usage across pools, and not just the raw disk capacity which is really helpful. In a home lab, it is easy to think you have plenty of space left, especially with replication or erasure coding in play. But ceph df shows how much usable space you really have.
I have caught situations where a pool was getting close to capacity even though the cluster looked fine overall. This is really important when running CephFS and RBD side by side.
Pinpoint an OSD that is struggling
When you want to see a quick snapshot of performance without running a benchmark tool like rados bench, you can get a very quick overview of how things will “feel” performance wise with the following command:
ceph osd perfThis command is super helpful in that it will show you the latencies that your OSDs are getting in the environment. This will help you spot disks that are slow or may not be performing on par with the rest of your disks.
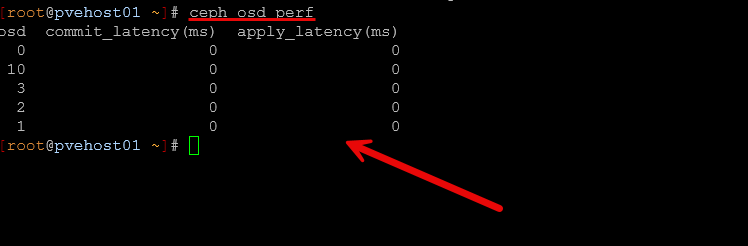
In one case, I had a single SSD that was starting to behave poorly. Everything felt slower, but it wasn’t just killing performance overall. But having this command at your disposal makes this much more obvious. This way you can isolate the problem quickly and see which OSD has high latencies and then correlate this with the ceph osd tree command to see which host it is located in.
See your pool configuration and behavior
If you need to go back and understand how one of your Ceph pools was configured, whether or not this was RBD or CephFS, you can use the command:
ceph osd pool ls detail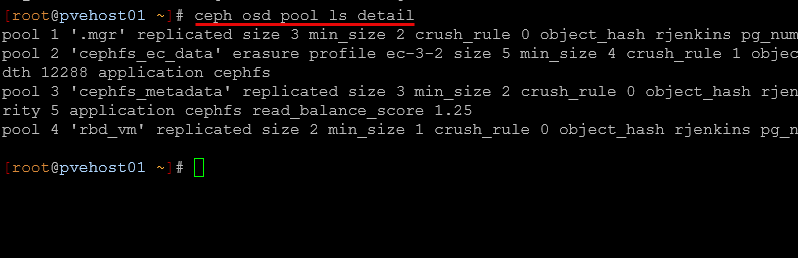
With this, you get details on your Ceph OSD pool like the following:
- replication or erasure coding
- size and min_size
- CRUSH rules
- autoscaling settings
This is really a helpful command when you have multiple pools for different purposes, like VM disks versus CephFS data (this is what I have). In my lab, I have separate pools for RBD and CephFS, and this command helps me confirm that each pool is configured like I expect or if I need to go back and look at its config I can do that.
Checking out CephFS issues
If you are using CephFS in your Ceph environment, this command is an important one to remember:
ceph fs status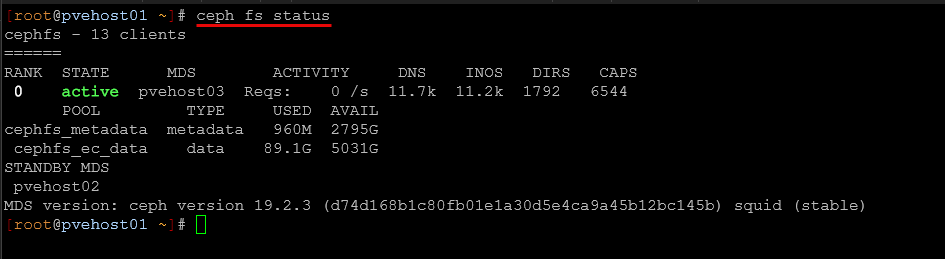
This shows:
- MDS status
- active and standby daemons
- client connections
If you are running CephFS, you can use this when troubleshooting odd behavior where files maybe are not appearing consistently across nodes. It can help you verify if metadata servers are healthy and which one is active. CephFS adds another layer of complexity on top of Ceph, so having a tool that gives you visibility there is very helpful.
Finding stuck clients in CephFS
This one is more advanced, but it is super useful and I have used it on a few occasions. Especially if you have a hung session or a session that is causing issues. This command will show you the details so you can then kill the session if needed.
ceph tell mds.<daemon> session ls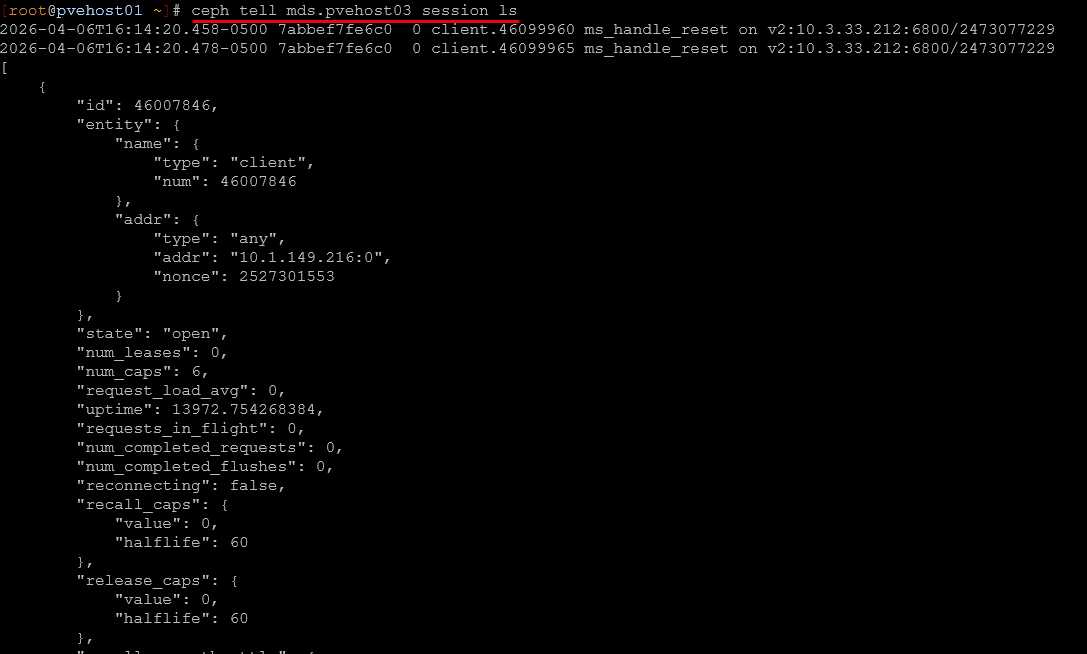
In my case, I used this to track down a Kubernetes node that was not responding to cache pressure. The client ID from ceph health detail matched what I saw here.
This is one of those commands you do not use every day, but when you need it, it is the only thing that gives you the visibility you need and the ability to track down the problem.
Performance benchmarking
There is a built-in command that I use for performance testing along with the quick ceph osd perf command. This command provides an actual benchmark of your environment. It is rados bench and you can use a quick command like the following to test writes:
rados bench -p <pool> 60 write --no-cleanupAnd then something like this as well:
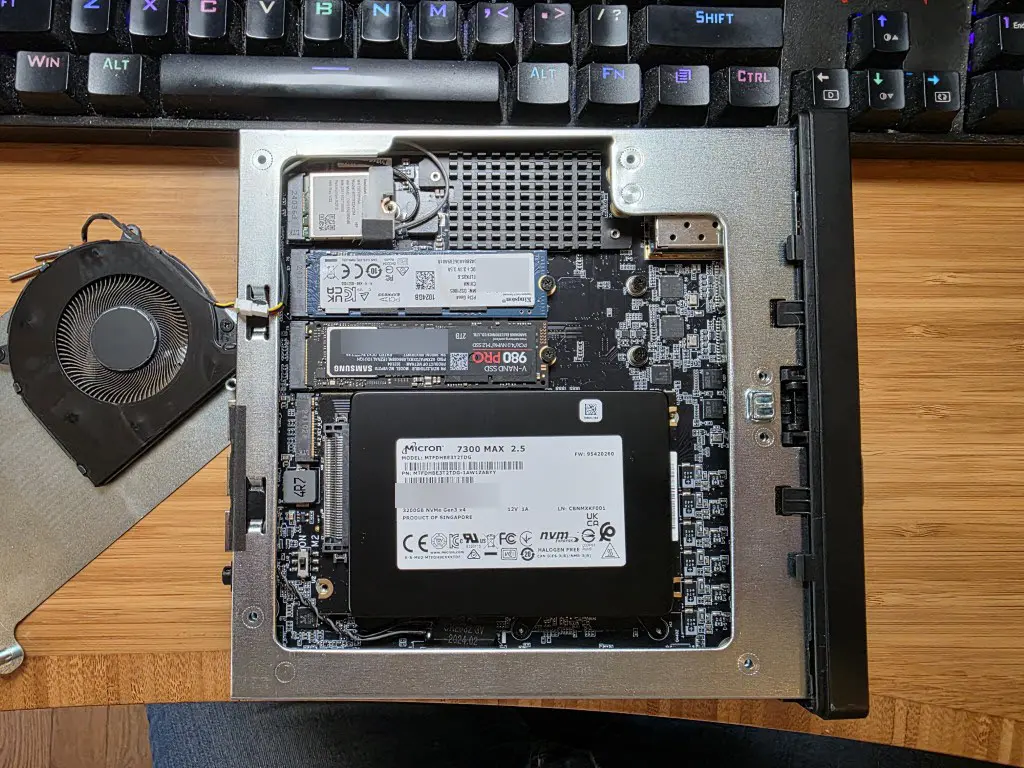
rados bench -p <pool> 60 seqThis tests object storage performance directly at the Ceph level. I have used this extensively when comparing consumer SSDs versus enterprise SSDs. The difference under sustained load was huge, and this command made it very clear when comparing the runs.
Read my post on that here: Consumer vs Enterprise SSDs in the Home Lab: I Benchmarked Both in Ceph.
This is also a great way to validate things like:
- network tuning
- MTU adjustments
- new disks
If you make a change and want to know if it actually helped, run this before and after.
Getting more detailed performance metrics
If you want even deeper troubleshooting and performance data, I use the following command:
ceph daemon osd.<id> perf dumpYou have to run this from the host that has the OSD you are getting the dump for. You will probably want to add the | more to the command to allow you to view all the output a page at a time.
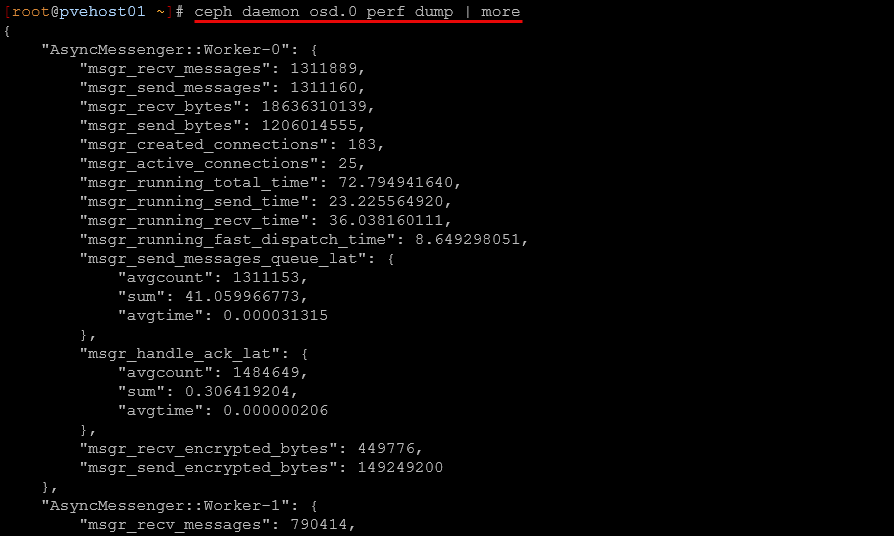
This is not something you use every day or wouldn’t want to. It outputs a lot of data. But when you are trying to understand what an OSD is doing internally, this is where you go.
I have used this when I suspected background operations or other issues were impacting performance. It gives insights into things like queues, operations, and internal metrics that you do not see anywhere else. This is definitely more advanced, but it is worth knowing it exists when you need it.
How these commands fit into my daily Ceph management
What I have found over time is that I do not run these commands randomly. Depending on what I see, I may run different commands. It always starts with ceph -s but goes from there. Note the following troubleshooting flows using the various ceph commands and when you might use them:
| Scenario | What to check | Commands |
|---|---|---|
| Quick health check | Get a high-level view of cluster state, PGs, and overall health | ceph -s |
| There is a warning or error | See exactly what is wrong and which component is affected | ceph health detail |
| Something feels slow | Identify slow OSDs and validate performance | ceph osd perf | rados bench |
| Checking storage usage | Understand actual used vs available space across pools | ceph df |
| Planning maintenance or node changes | Understand data placement and host distribution | ceph osd tree |
| Stopping rebalancing from happening during maintenance | Stop unnecessary data movement when taking nodes offline | ceph osd set noout | ceph osd unset noout |
| Reviewing pool configuration | Validate replication, EC settings, and autoscaling | ceph osd pool ls detail |
| CephFS acting weird | Check MDS health and active metadata server | ceph fs status |
| Finding problems with CephFS clients | Identify which clients are connected and causing issues | ceph tell mds.* session ls |
| Deep OSD troubleshooting | Inspect internal OSD performance metrics and behavior | ceph tell osd.<id> perf dump |
Wrapping up
I am loving running Ceph in my home lab. It “feels” very enterprise and has been rock solid stable and performant, especially since I introduced enterprise drives. But it also means you are the one responsible for understanding what is happening when things go wrong. Hopefully my proxmox ceph commands home lab notes will help anyone that is newly running Ceph to have the toolset they need for general management and configuration and troubleshooting when things don’t feel right. How about you? Are you running Ceph in the home lab? What tools have you found to be the best for your management needs? Let me know in the comments.
Google is updating how articles are shown. Don’t miss our leading home lab and tech content, written by humans, by setting Virtualization Howto as a preferred source.
About The Author