Storage is one of the absolutely critical aspects of any home lab and computing environment in general. And, unfortunately, storage issues can creep in without even having any signs of things going wrong in the lab. VMs may be up and running, containers are responding, backups are happening, etc. However, after recently ordering some “supposedly new” SSDs for home lab use, before putting them into production, I decided to run a quick health check. What I found is a change in how I approach disk validation in my home lab. In this post I will walk through the free tools i use to check disk health and validate things to catch problems early before they turn into data loss.
Wait, individual disk health is a thing?
If you haven’t really experienced a lot of storage failures and you may be beginning your home lab journey of learning, you may not have realized that you need to keep an eye on your individual disk health. And I will give you a tip that I learned recently. With all the price gouging and crazy prices out on the Internet now with enterprise level storage due to the AI boom, you definitely want to check drives that may be sold to you as “new” drives in the package (more on that below)
In the home lab, you are often running things like:
- Hypervisors (Proxmox, XCP-ng, Hyper-V, ESXi, etc)
- Distributed storage like Ceph
- Container workloads (Docker hosts, Swarm clusters, Kubernetes)
- Backup jobs and snapshots
All of these generate I/O activity. Especially if you are using SSDs for performance, the tricky part is that disks can degrade silently. You might not see any immediate errors, but under the surface you may have some of the following silent drive problems going on:
| Issue | What it means | Why it matters |
|---|---|---|
| Higher than expected wear | SSD has been used more than anticipated (high write cycles or wear level) | Shorter lifespan and possible early failure, especially in write-heavy workloads |
| Increasing reallocated sectors | Drive is remapping bad sectors to spare ones | This is a sign of physical degradation of the disk surface and growing failure risk |
| Rising error counts | Read/write or uncorrectable errors are being logged | Data integrity may already be at risk, even if the system still looks like it is stable |
| Performance degradation | Slower read/write speeds or inconsistent performance | This can be a warning sign of failing hardware or worn-out NAND cells |
Unfortunately, by the time you notice a real problem, your data may already be in danger of being lost due to hardware issues. This is why checking disk health in a proactive way with the right tools is one of the best things you can do to keep your storage healthy in the home lab.
Also, this is a great way to protect yourself from scammers who may be selling drives “new in the package” that have actually previously been used.
How can checking drives that you by with tools protect you?
Well, let’s just say there may be ones out there that are trying to pass off “used” drives as “new” or barely used drives. Granted, enterprise class drives usually have super high DWPD. DWPD stands for Drive Writes Per Day. It tells you how many times you can write the full capacity of the drive every day over its warranty period.
So if you have a 1 TB SSD rated at 1 DWPD, that means you can write, for the entire warranty period (usually 3 to 5 years), 1 TB per day, every day.
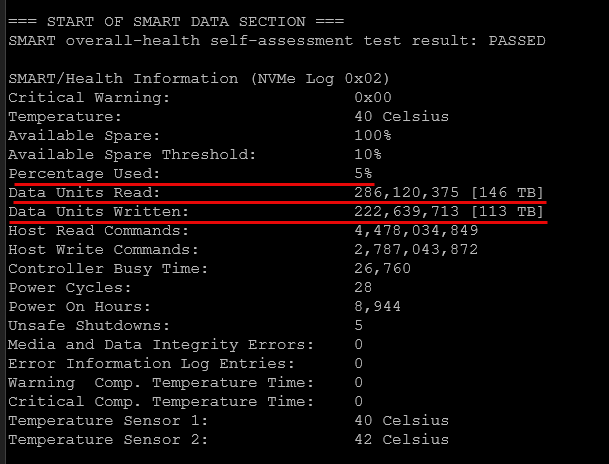
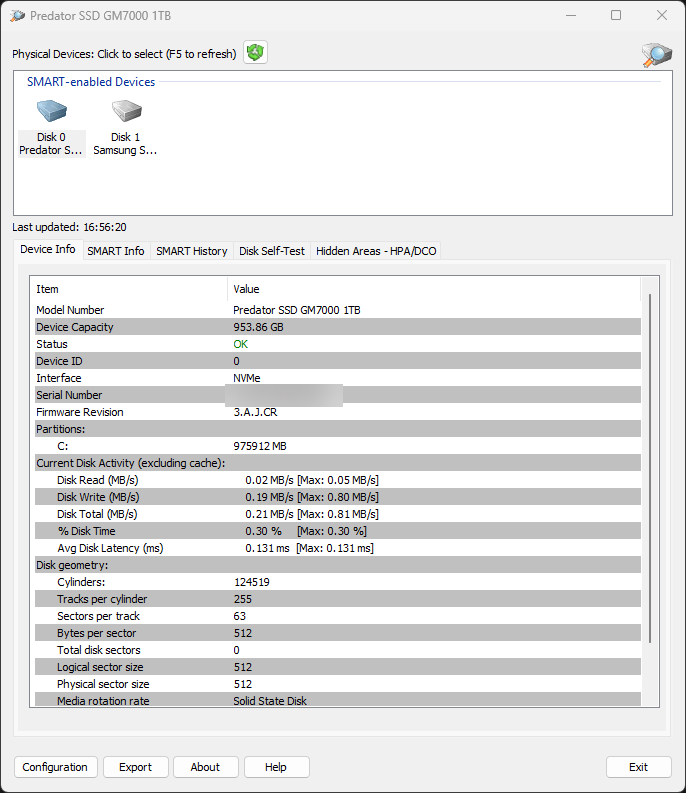
Still if you buy drives and expect these to be new and unused, you don’t want to see that your drive already has major use and not much runway left ahead of it. For instance, recently, I installed a drive that was sold as new that when I installed it, it looked like this. This told me that this drive was heavily used before I installed it.
SMART data uncovers potential disk issues
Most modern hard drives contain SMART data. SMART stands for Self-Monitoring, Analysis, and Reporting Technology. The SMART data exposes internal metrics for the drive that gives you a really good peek inside the overall health of the drive.
SMART data can also be misleading with some tools though. Tools may give you a big green OK that everything is healthy and fine while there may still be warning signs underneath if you look deeper into the SMART data. What are some things that you want to look for inside the SMART metrics and data? Take note of the following:
- Wear leveling count might be high
- Power-on hours might not match what you expect, especially if “new”
- Uncorrectable errors might be non-zero
- Total bytes written might show heavy usage
This is exactly what I saw with those “new” SSDs. On the surface, they looked fine. But once I dug into the SMART data, it was clear they had already seen significant use. So the goal is not just to check SMART status. It is to interpret the data behind it.
smartctl and smartd
If you are running Linux or anything like Proxmox, these tools can be your foundation of checking your disk health. The smartctl tool is part of the Smartmontools package and gives you direct access to SMART data.
A basic command looks like this:
smartctl -a /dev/sda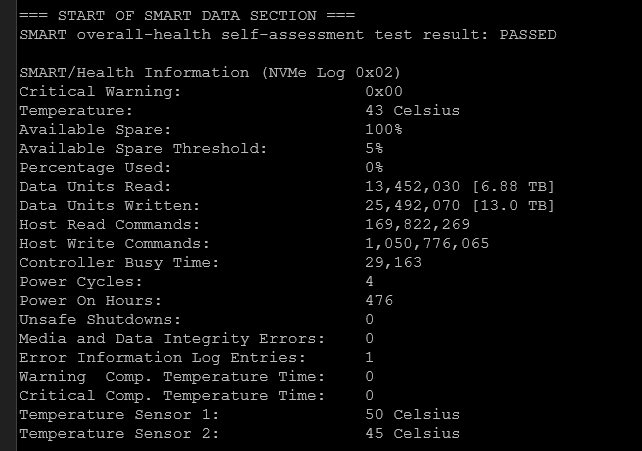
This will dump everything about the drive, including the following information.
- Health status
- Power-on hours
- Wear indicators (especially for SSDs)
- Reallocated sectors
- Temperature history
- Error logs
What makes smartctl a powerful tool is that it works on just about any environment that you would run in the realm of home lab. You can run it on the following:
- Linux servers
- Proxmox hosts
- NAS devices
- Many enterprise environments
You can also run short and long tests:
smartctl -t short /dev/sda
smartctl -t long /dev/sda
When you run these test, they can help you identify issues that may not visible in raw SMART data. The smartd tool complements the smartctl tool by running as a daemon and alerting you when something changes. Instead of manually checking disks, you can have your system notify you when a threshold is crossed, errors maybe are increasing, or the health status of a disk changes. For a home lab, this is a huge benefit. It turns disk monitoring into something proactive instead of reactive that you have to remember to run.
Using a GUI with GSmartControl
If you do not want to parse CLI output, GSmartControl is a great option. It uses the same backend as smartctl but gives you a graphical interface that makes it easy to see your disk health in a very quick way. You can view things like SMART attributes, run tests, see health summaries, or see warnings that may already be happening.
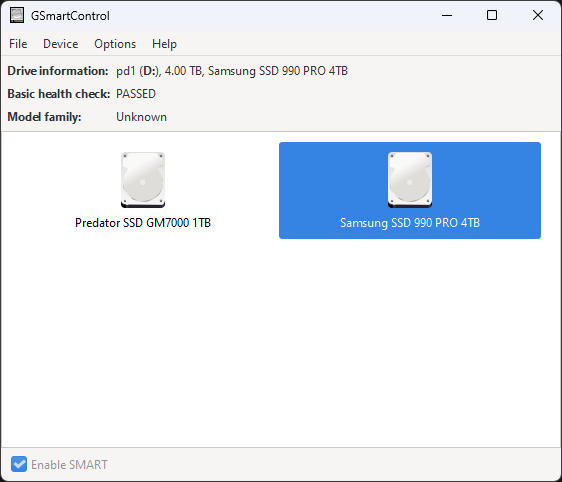
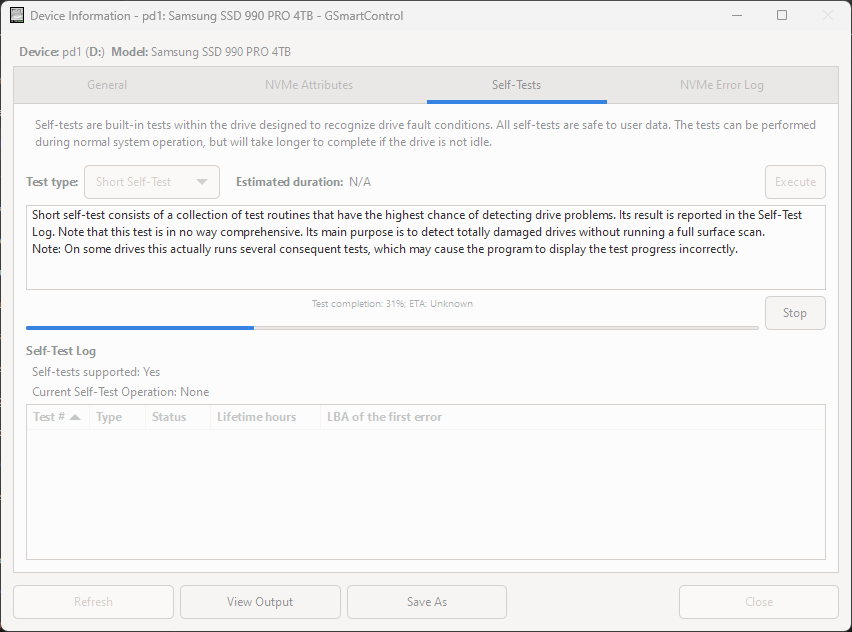
Below is an example of running the GSmartControl tool and the self-tests it includes.
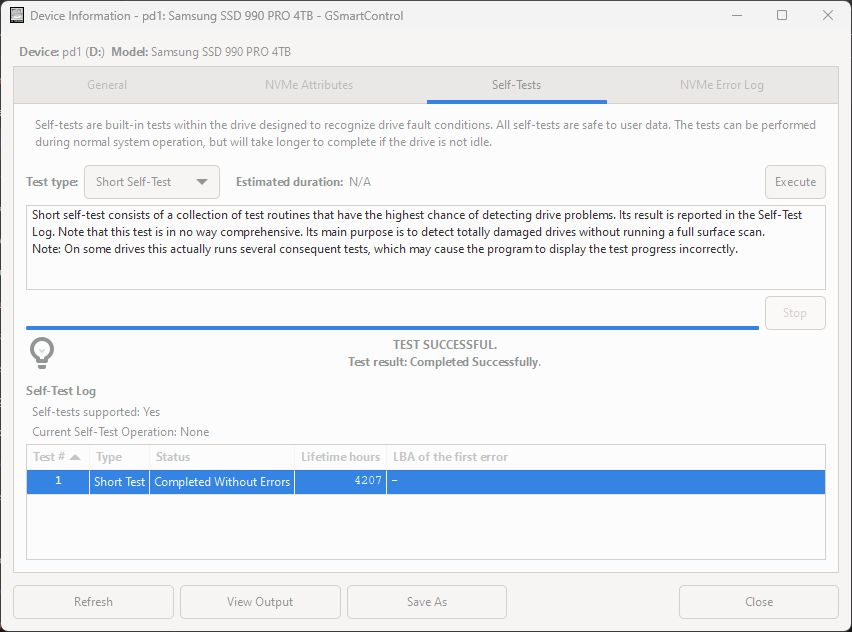
After running a successful health test.
Especially on GUI-based Windows or Linux hosts, this is a great tool that I often use when I want a quick overview without digging through command line output.
Easy Windows checks with CrystalDiskInfo
If you are running Windows systems in your lab or just want a quick check on a workstation, CrystalDiskInfo is a well-known tool that is super easy to use in Windows and it is free. It gives you a simple way to get a health rating on your disks. You can also see things like temperature readings, SMART attributes, and it will alert you when something isn’t quite right.
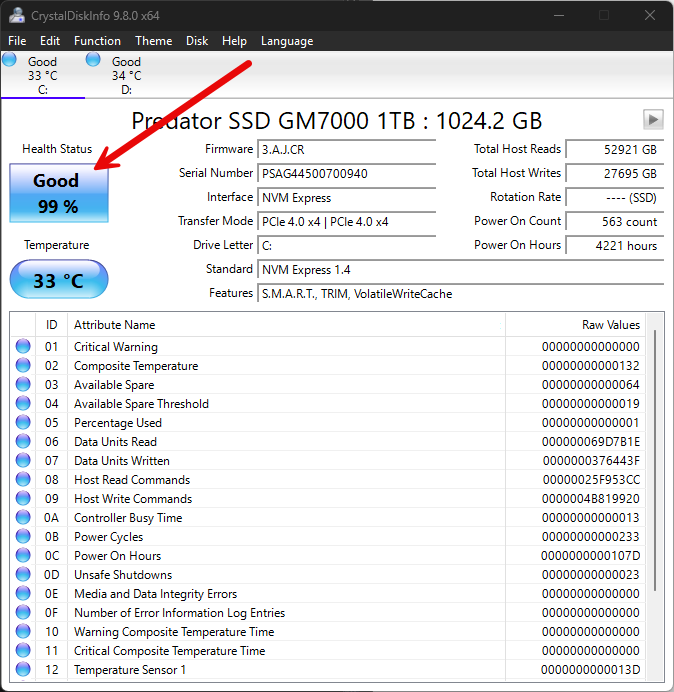
What I like about it is how quickly you will know if something isn’t quite right. If a drive shows “Caution” or “Bad,” you know immediately that you need to have a game plan to replace the disk or make sure your backups are good. It is also useful when testing drives outside your main lab before putting them into production.
PassMark DiskCheckup
Another simple and easy command to use is the PassMark DiskCheckup tool. It is free to download and use and it gives you a super simple and lightweight tool that focuses on getting you access to SMART monitoring data. It is not quite as rich in features as some of the other tools that we have talked about already but if you are looking for a tool that gives you quick checks, and access to SMART data, this is a easy and simple one to use.
Validating disks with badblocks
SMART data tells you what the drive reports about itself. There is also a tool called badblocks actually tests the disk. This is important when you get a new drive, or you suspect there may be physical issues if you are seeing some flakiness with a disk. It also allows you to stress the drive before you get it into a production environment.
You can do a basic read test with the badblocks command with the following:
badblocks -sv /dev/sda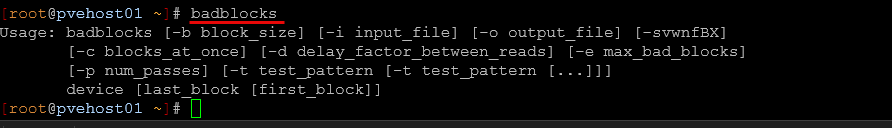
This will scan the disk and report any blocks that may be bad. Keep in mind that write tests are destructive, so use these with caution. This is one of the best tools for actually verifying that a drive is actually healthy, and it is not just reporting that it is.
What to look for in SMART data
As a recap, SMART monitoring data is a great place to start when looking at the overall health of your disks. What are some of the key pieces of information to look at? Notice below:
| SMART Attribute | What to check for | Why it matters |
|---|---|---|
| Power-on hours | Unexpectedly high hours on a “new” drive | Indicates it have been used and reduced lifespan |
| Wear indicators | High percentage used or wear leveling count | Shows how much of the SSD’s endurance has been used |
| Reallocated sectors | Any non-zero value | Shows you if there might be physical problems and sectors being remapped |
| Uncorrectable errors | Any non-zero value | Data could not be recovered, serious risk for data loss |
| Total bytes written | Higher than expected for the age of the drive | Reveals actual usage and helps estimate remaining lifespan |
| Temperature | Consistently high temps (especially under load) | Heat speeds up wear and will shorten the overall drive life |
Wrapping up
Disk health and silent failures are one of the most common causes of issues in a home lab and they are definitely problems that can easily get overlooked. Also, the recent experience I had with “new” SSDs that were sold to me is a reminder that you cannot assume anything about your hardware if you buy things secondhand. The good news is that we have access to a whole range of tools that give you a simple and easy way to look at the overall drive health and get information that gives you the whole story on whether a drive has been used previously or has potential issues. How about you? What tools do you use to keep on top of your drive health in the home lab?
Google is updating how articles are shown. Don’t miss our leading home lab and tech content, written by humans, by setting Virtualization Howto as a preferred source.
About The Author