For a lot of us, the weekend is really when the home lab comes alive. It is often the perfect time to try something new, break something safely, and learn new things. But, the great thing is, every experiment doesn’t need to turn into a full blown rebuild or multi-day project. This post is all about quick experiments that you can spin up and test and then tear down if you want. These can tie into your real-world setups too if you are using Proxmox, Docker, Ceph, or AI as these are getting more common. Let’s jump into six experiments that are easy, experimental, and interesting and I think are worth your time this weekend if you are looking for experiments that help with learning.
1. Benchmark your storage performance in Proxmox
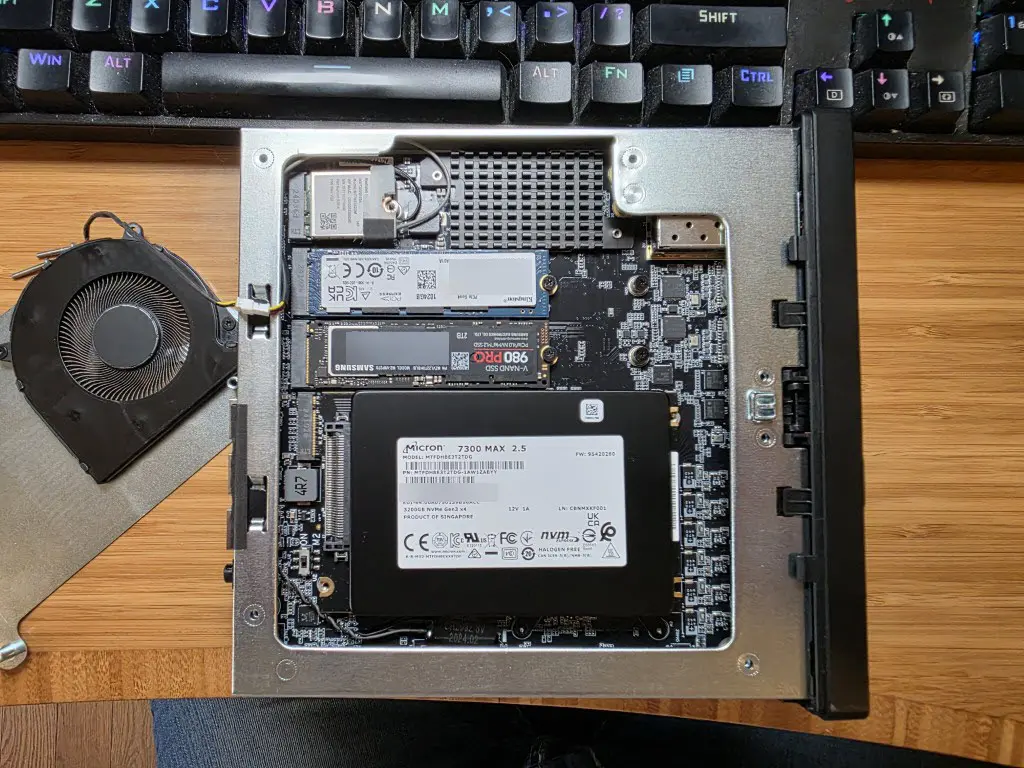
I have been having a blast lately testing performance of my storage in the home lab. If you have been following my recent blog posts, you will remember I just recently changed out my consumer NVMe drives for true datacenter class storage in the form of Micron 7300 MAX U.2 drives. These have taken my storage and stability of the storage layer to the next level.
Check out the full post on this topic here: Consumer vs Enterprise SSDs in the Home Lab: I Benchmarked Both in Ceph.
However, I really like benchmarking as a fun learning experience as unless you have a benchmark to go by, you are really just guessing at performance. I like to have real numbers to see where improvements are made.
Start by running a benchmark on your storage as it sits now. What tools are good to use for this testing? Below are some of the ones that I have used and recommend:
- fio – The most popular and flexible tool for disk benchmarking. Great for simulating real workloads like random read/write and mixed I/O
- ioping – Lightweight tool focused on measuring disk latency, similar to ping but for storage
- dd – Simple built-in utility for quick sequential read/write tests, good for a fast sanity check
- rados bench – Native Ceph benchmarking tool that tests performance directly at the cluster level
- sysbench – Can test CPU, memory, and disk performance, useful if you want a more complete system comparison
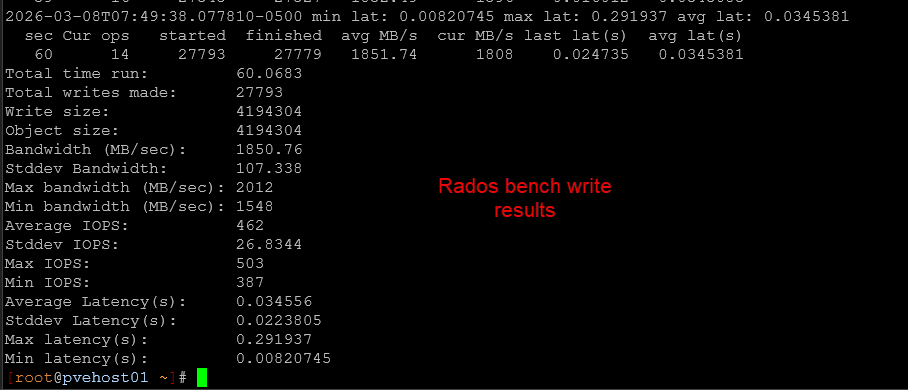
Once you get the baseline benchmark, this will provide you with the numbers that you are seeing currently. Even if you are not comparing your storage benchmarks with anything right now, you will have it as a baseline Baselines are good in general so you know if anything changes.
For instance, I was glad to get a benchmark of how things were performing on Ceph with consumer NVMe drives. Then once I had that benchmark of the storage subsystem, I was then able to see exactly what improvements to performance changing to enterprise drives made.
2. Try Proxmox NIC pinning and verify it actually works
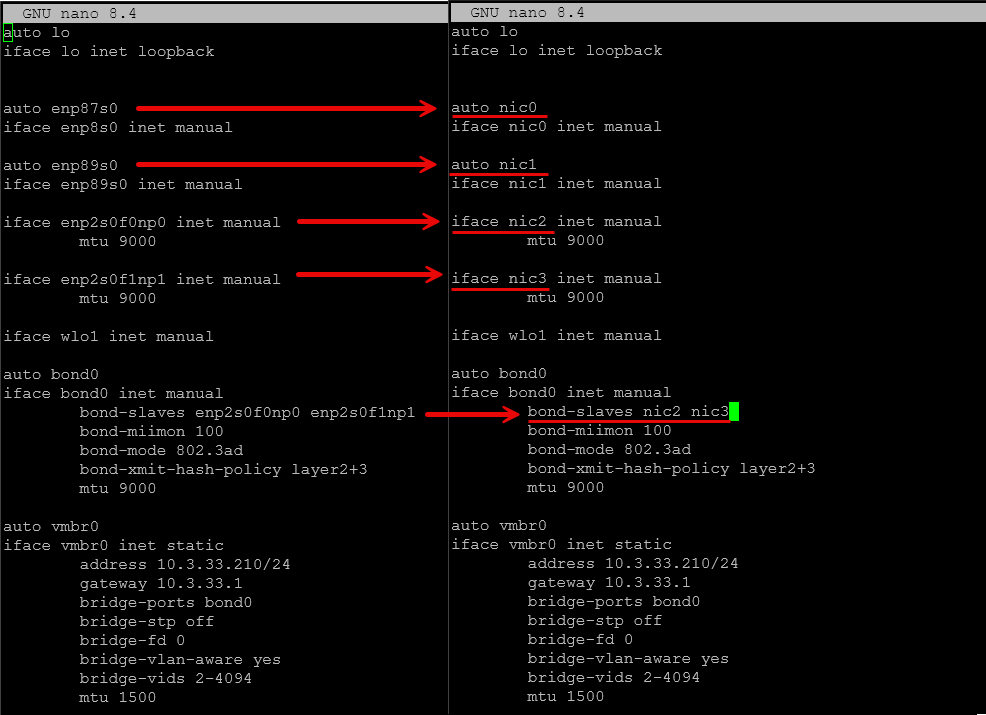
If you have ever had network interfaces rename themselves after a reboot, you know how painful that can be. Proxmox 9 introduced a much cleaner way to handle this with NIC pinning. I recently covered this in a detailed blog post on how you can use this new built-in tool to pin your network names to a specific name, the pve-networking-interface-pinning tool. Read that one here: The Proxmox 9 Feature That Finally Fixes NIC Renaming Problems.
For this particular experiment you can do the following:
- Configure NIC pinning using the .link files
- Assign friendly, predictable names like nic1, nic2, or similar
- Reboot the host
Then take it a step further (if you want to actually test your work, who does that?)
- Add or remove hardware like a GPU or additional NIC
- Change PCI slot population if possible
- Reboot again and observe your NICs and their numbering
In my opinion, this is a very low-effort experiment in the home lab that will keep returning results for years after since you won’t have any issues with your interfaces and their names changing afterwards. For me, as much hardware as I experiment with, this is a life saver not having to worry about having to rework the network interfaces config due to things getting renumbered.
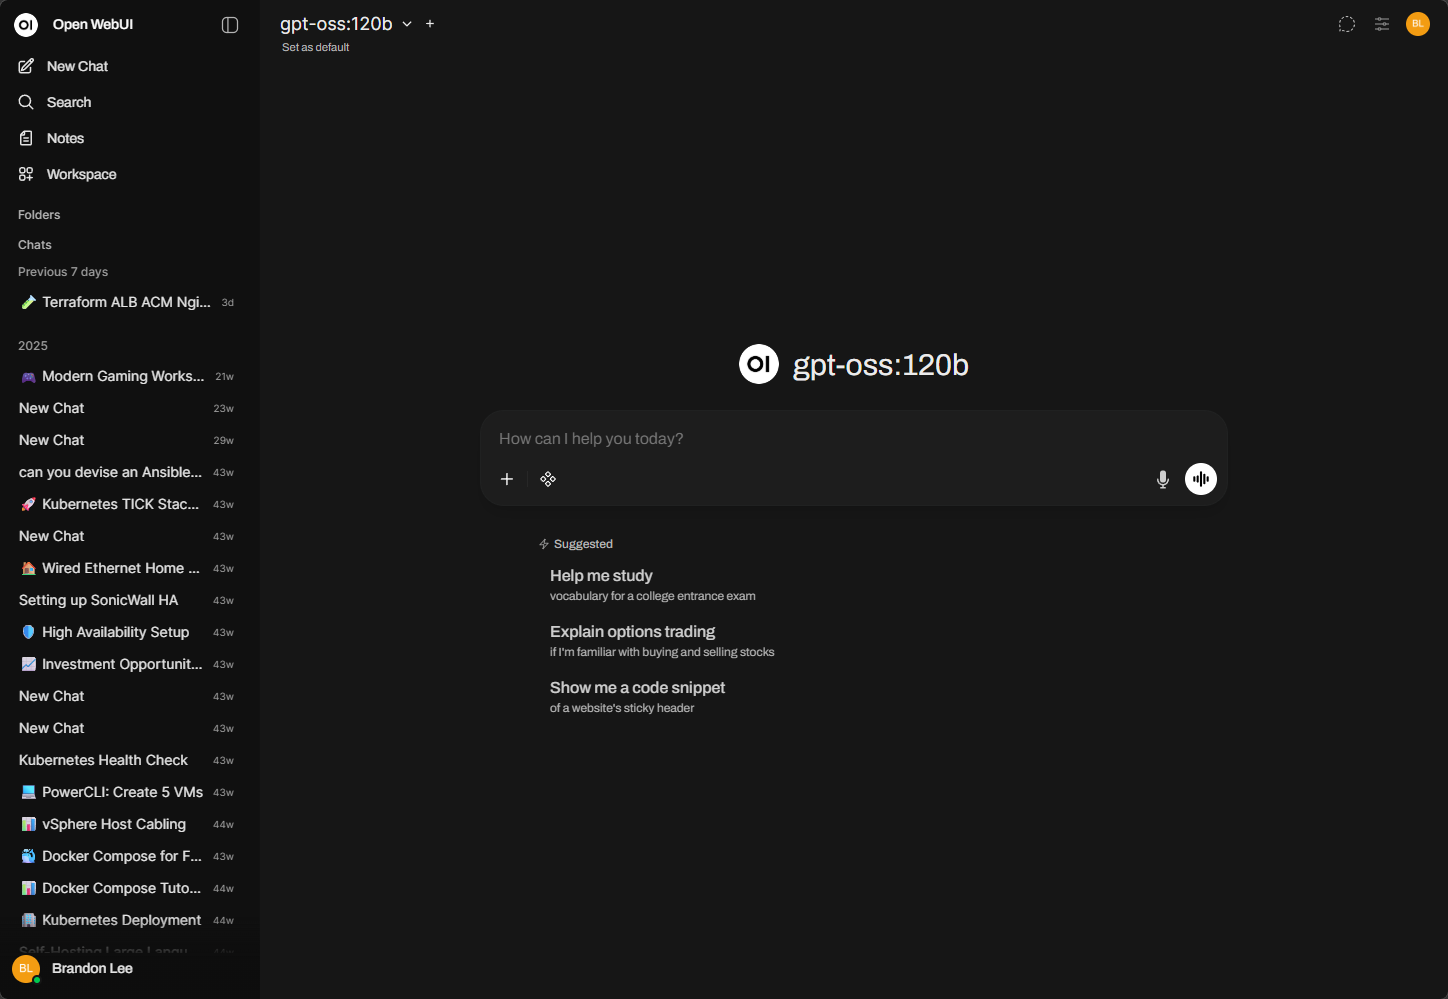
3. Spin up a local AI stack with Ollama and OpenWebUI
This is definitely an experiment that if you want to check out local large language models and experiment with AI at home, is worth the effort to spin up. AI in the home lab is one of the most exciting areas right now, and it is easier than ever before to get started just simply due to the wide availability of tools and software that make it work well.
For this experiment:
- Install an internal or eGPU in your Proxmox host
- Configure GPU passthrough in Proxmox (if using a GPU)
- Deploy Ollama on a Linux VM or container
- Install OpenWebUI as a front end
- Pull a small model to start with
If you have experimented with GPUs or even an eGPU setup, this becomes even more interesting. You can compare:
- CPU-only performance (which can be fairly good with modern CPUs)
- GPU-accelerated inference
Once you get a feel for how this all works, then you can start experimenting with things like n8n and OpenClaw to name a couple that many are excited to run in their home labs as of recently. The key takeaway here is not just that AI works locally, but how you can actually use it in your day-to-day home lab operations.
Read my posts here for reference:
- Run Ollama with NVIDIA GPU in Proxmox VMs and LXC containers
- How to Enable GPU Passthrough to LXC Containers in Proxmox
4. Migrate a VM from another hypervisor into Proxmox
I think this is a great experiment that surprisingly doesn’t take long to accomplish. There are so many great tools for migrating workloads to Proxmox now. There is the native built-in import utility that can migrate VMware ESXi VMs over to Proxmox. There is also migration tools found in PegaProx and Proxcenter to name a couple others. Veeam Backup & Replication and the community edition that is free, can do this as well.
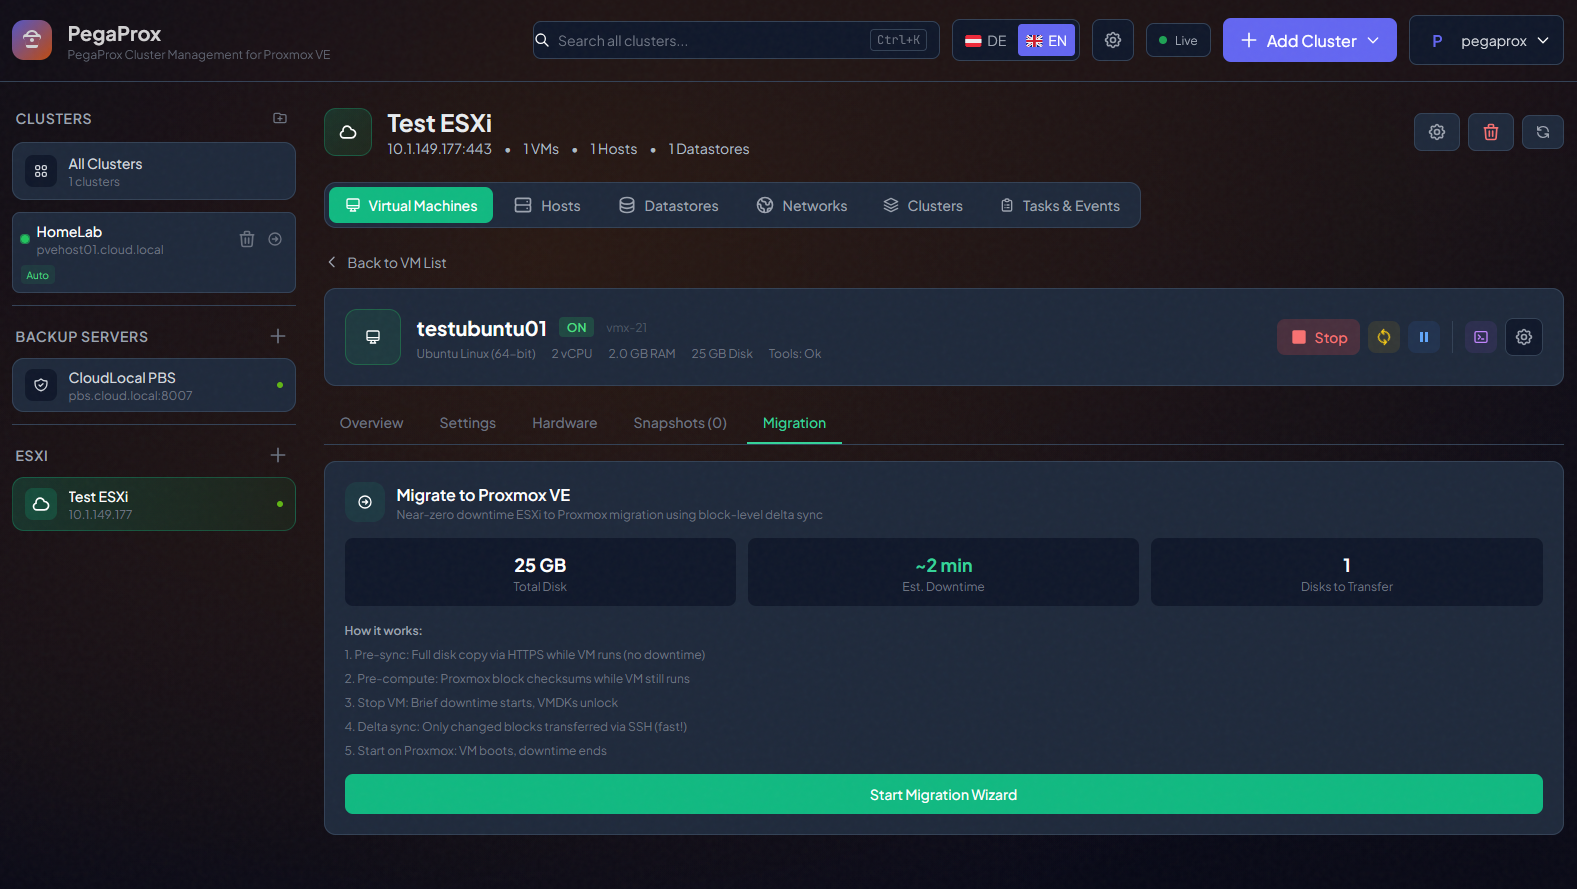
Check out my recent post here on PegaProx and its new functionality to migrate VMware ESXi virtual machines to Proxmox: PegaProx Now Adds Built-In ESXi Migration and Proxmox Backup Monitoring.
By getting your feet wet with the migration process, if you have been holding off migrating until now, you will feel much more comfortable after you have seen the process with just a single virtual machine. Once I had the momentum going in the direction of Proxmox, I didn’t slow down as it just worked so well and the experience has been fantastic so far.
5. Deploy a lightweight monitoring stack in under 30 minutes
Monitoring is something that historically has been hard to install, hard to configure, and took weeks to dial in. But there are now so many great purpose-built solutions that can give great visibility into your home lab environment quickly.
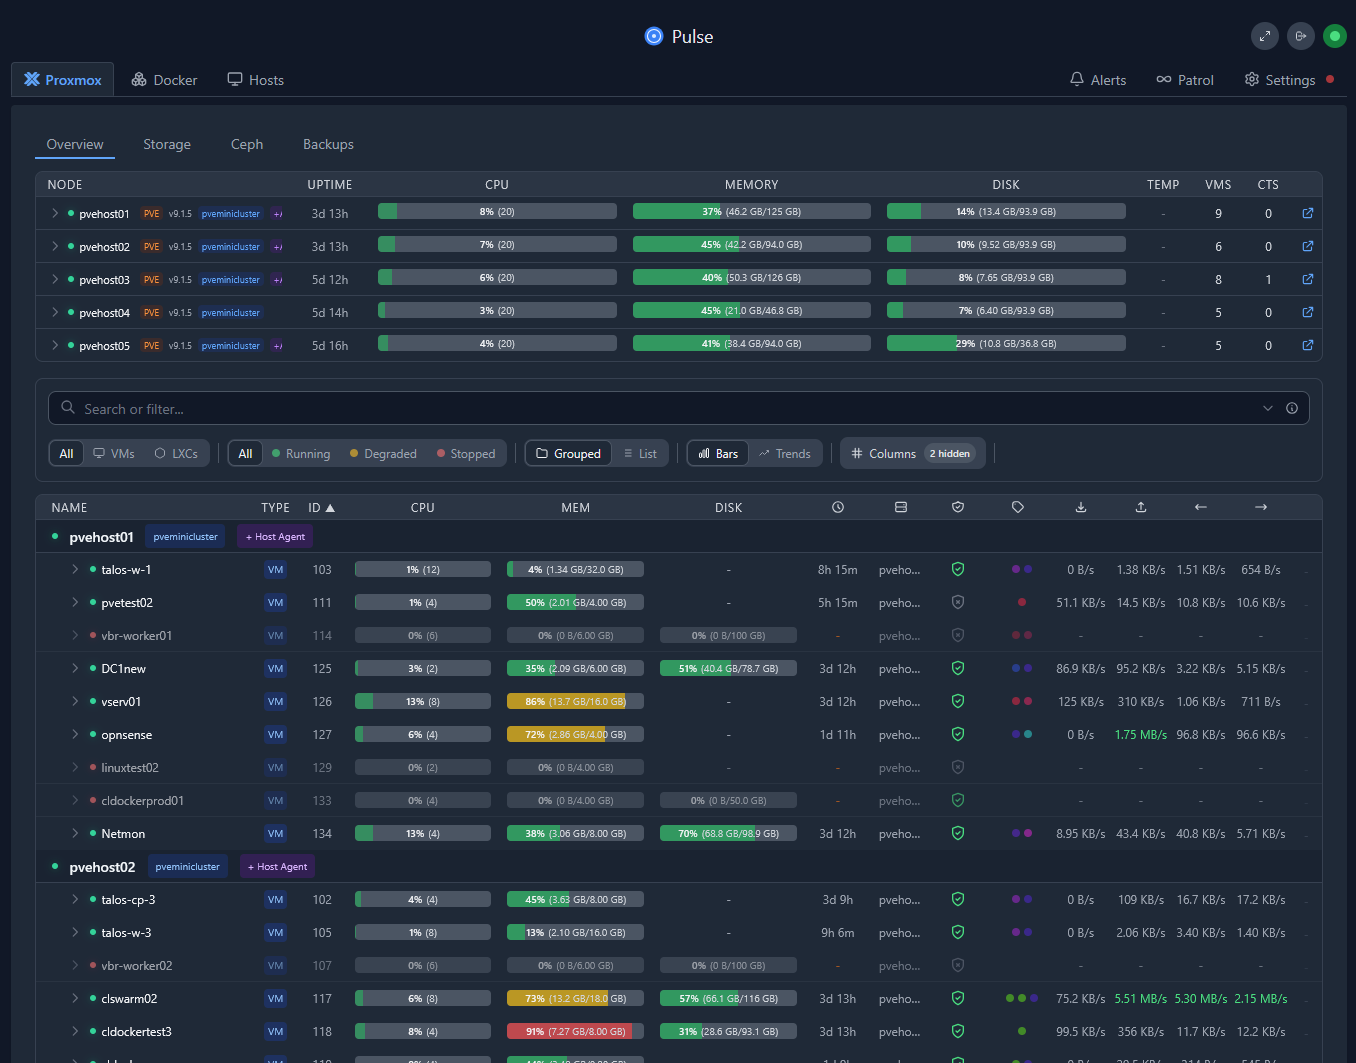
One of the best home lab experiments for the weekend you can run is standing up a purpose-built monitoring stack for your Proxmox or Docker environment and immediately see the results you get. Monitoring is something everyone knows they should have, but it often turns into a complicated project as we have mentioned and this keeps ones from implementing it. This experiment focuses on doing the opposite.
Pick one lightweight tool like the following are my recommendations:
- Netdata for full system visibility
- Dozzle for container logs
- Pulse or ProxMenux for Proxmox monitoring
- Node exporter with Prometheus if you want to go slightly deeper
Set a timer for 30 minutes and:
- Install the tool (most are containerized so this doesn’t take long)
- Connect it to at least one Proxmox host or Docker node
- View metrics or logs in real time
The goal is not perfection. The goal is visibility into your environment and what is actually happening on your hosts and in your containers. Once it is running, explore things like:
- CPU and memory trends
- Disk I/O patterns
- Network throughput
- Container logs
Check out my deep dive into the monitoring tools I use and how I am using them to monitor my home lab stack for 2026 here: Monitor Your Proxmox Home Lab Like a Boss: The Monitoring Stack I Actually Use.
6. Build and destroy a test environment with automation
Like so many of the other experiments here, this one can be intimidating until you actually do it. Automation has a lower barrier to entry than ever before, with the AI tools we have to help with code and scripting. Basically anyone can automate their home lab with a little patience and time working on it.
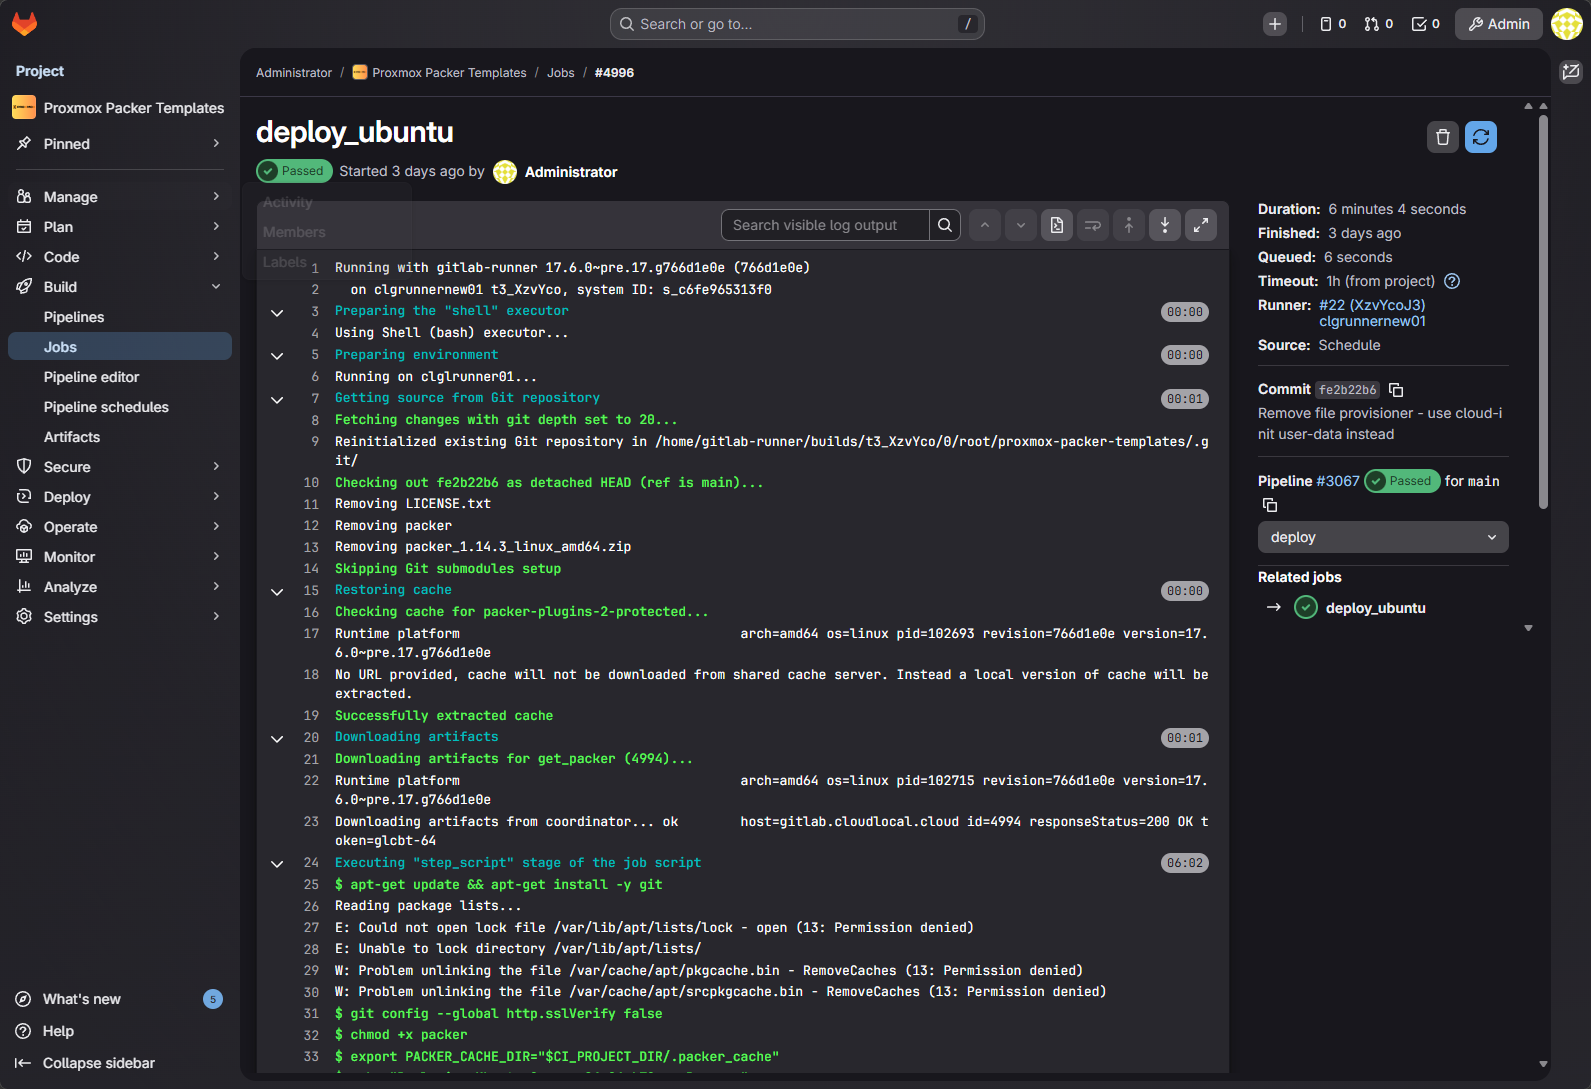
However, you don’t have to automate your ENTIRE home lab, just pick one thing, like VM deployments, and automate that. Learn how to use Packer to automate building your Proxmox templates. Then after you “manually” run Packer, start playing around with using a CI/CD pipeline to trigger the packer builds and have it run through the process of building the template on a schedule.
I have written numerous blog posts on this topic, but you will find a couple of great examples of how to do this on my blog posts showing how to build an Ubuntu 24.04 VM template and a Windows Server 2025 template in Proxmox.
Read these posts for information on the specific how-to’s and reference:
- Installing GitLab, Runner, and Container Registry on Your Home Server
- Proxmox Packer Template for Ubuntu 24.04
- Windows Server 2025 Proxmox Packer Build Fully Automated
Wrapping up
These experiments are small to begin with, just starting a single task and seeing it through, but the skills they teach and the confidence they build are much larger than the time and effort they individually take. by working through a list of experiments just in a single weekend or just a single experiment, you will be surprised at just how much you can learn and accomplish in a short amount of time.
Google is updating how articles are shown. Don’t miss our leading home lab and tech content, written by humans, by setting Virtualization Howto as a preferred source.
About The Author