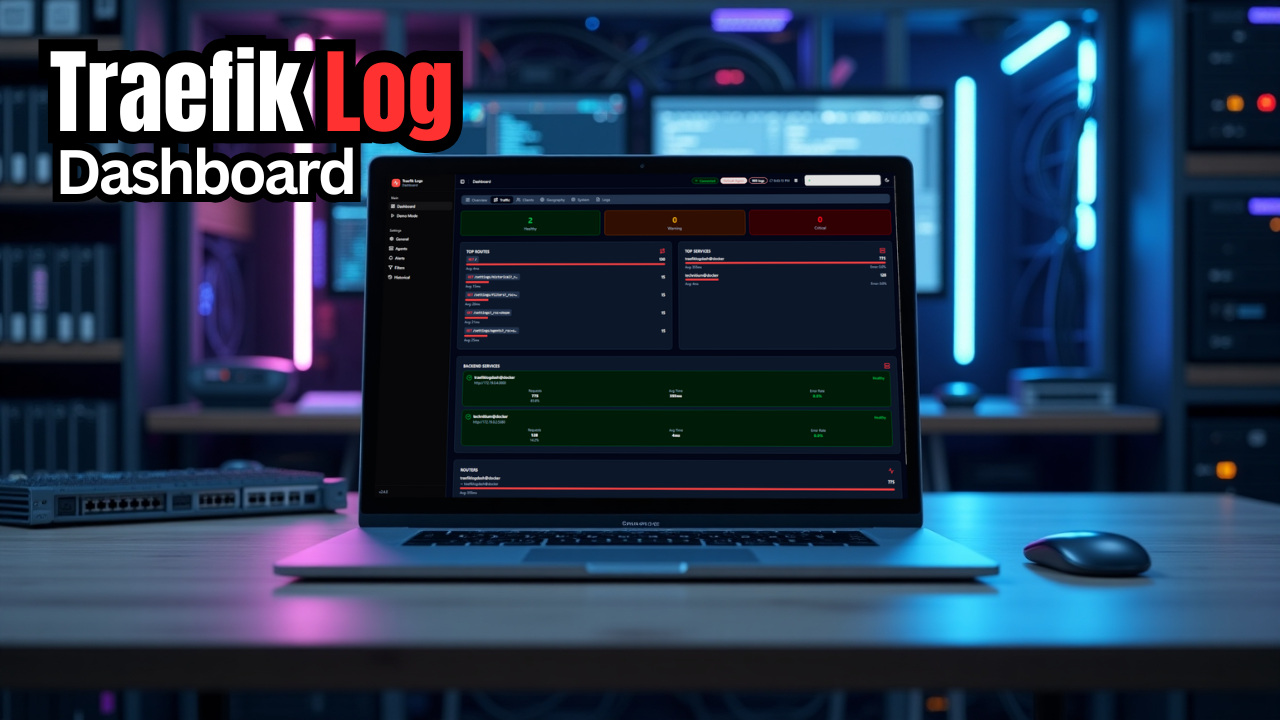
Traefik is ultimately my favorite reverse proxy for the homelab. In my opinion it has unsurpassed capabilities as a reverse proxy both for Docker and Kubernetes. It is extremely powerful especially if you are into infrastructure as code and keeping your configurations for self-hosted stacks in Git. However, one thing that Traeifk is not known for is ease of accessing your logs for observability and understanding “what is going on”. There is a Traefik Log Dashboard project that gives you visibility to your Traefik access logs for an awesome view of these and overall visibility to your environment. Let’s look at this new Traefik log dashboard and what it can do for your home lab.
Why Traefik logs are important
Since Traefik, or any reverse proxy you are using, is on the outside of your self-hosted apps and terminating SSL connectivity and routing traffic, it is the place where you can see status codes, errors, warnings, or spot suspicious traffic. Trying to look through your logs manually by grepping or manually trying to find suspicious traffic isn’t very easy to do. That’s where the new Traefik Log Dashboard project steps in and helps.
It effectively turns your Traefik access logs into a live, interactive dashboard that lets you see your traffic as it flows through your reverse proxy. It also makes you feel like this should be a default tool that is included with Traefik as part of the solution.
What is the Traefik Dashboard?
The Traefik Log Dashboard is a totally open source solution that is published by hhftechnology. The purpose of the project is to provide a real-time dashboard for analyzing Traefik logs with IP geolocation. It gives you effective status code analysis, and service metrics and it is built with React (Shadcn UI) and Node.js.
Check out the official project here: hhftechnology/traefik-log-dashboard
Basically what you do is turn on access logging in your Traefik container, then have the Traefik Dashboard access this log location and it reads the logs from there. This allows the Traefik Log Dashboard to be able to show you access and status information in real time. It turns the JSON formatted logs into structured data that can be searched and viewed in the web-based dashboard.
The dashboard gives you key information about the traffic coming in and many details, including:
- client IP address
- Traffic (top routes, top services, backend services, routers, etc)
- Clients (Client IPs, hosts, addresses, user agents)
- Geographic information for access sources
- Logs view where you can see the actual logs happening in real-time
- You get alerting (Webhooks and alert rules that are customizable)
It is not meant to be a replacement for a full metrics and logging stack but what it does do is give you a fast view of the metrics and information in the logs that matters.
Performance and resource usage
The new Traefik Logs Dashboard is an opinionated and very focused log tool. It has one job to do and it is does it well. It processes logs and shows these in the UI. So, it does this without needing heavy indexes or long-term storage.
So, in terms of resource usage, it has a very small footprint, compared to running a full observability stack would feel. You can also run this on the same host as Traefik as you won’t see any performance hit with your Traefik container.
Below is just a quick docker stats running the solution on one of my test docker hosts. You can see that it has very minimal resource usage.
What this dashboard helps us do in the home lab
When you have a reverse proxy like Traefik in front of your container workloads like GitLab, a media service, FreshRSS, and others and you are troubleshooting connectivity, or seeing if a specific client is getting an error routing to a specific internal service, you need logs for this. You want to know answers when services aren’t responding, etc. With something like the Traefik Log Dashboard, it is able to give you immediate answers to what is going on.
When you have this kind of visibility, you are able to see which services are being hit successfully, and maybe more importantly, which ones are returning errors. You can also see whether or not requests are coming from the clients that you are expecting.
Also, from the security side of things, this allows you to see incoming traffic and spot things that just don’t look right. If you are seeing repeated 401 or 403 errors, bursts of requests with unknown patterns or paths, this may stand out as suspicious traffic from an attacker.
You can quickly spot repeated failed authentication attempts, unusual request paths, or traffic spikes that may be from automated scanning. Keep in mind that this tool in itself doesn’t replace proper intrusion detection or firewall capabilities, it adds an important layer in the overall security “onion.
Installing Traefik Dashboard
There are really two parts to getting this up and running. The first part is the actual docker compose stack code that you use to stand up the traefik log dashboard stack. Be sure to replace the AGENT API TOKEN with one of your own.
services:
  traefik-agent:
    image: hhftechnology/traefik-log-dashboard-agent:latest
    container_name: traefik-log-dashboard-agent
    restart: unless-stopped
    ports:
      - "5000:5000"
    volumes:
      - ./data/logs:/logs:ro
      - ./data/positions:/data
    environment:
      - TRAEFIK_LOG_DASHBOARD_ACCESS_PATH=/logs/access.log
      - TRAEFIK_LOG_DASHBOARD_ERROR_PATH=/logs/traefik.log
      - TRAEFIK_LOG_DASHBOARD_AUTH_TOKEN=your_secure_token_here
      - TRAEFIK_LOG_DASHBOARD_SYSTEM_MONITORING=true
      - TRAEFIK_LOG_DASHBOARD_LOG_FORMAT=json
    healthcheck:
      test: ["CMD", "wget", "--no-verbose", "--tries=1", "--spider", "http://localhost:5000/api/logs/status"]
      interval: 2m
      timeout: 10s
      retries: 3
      start_period: 30s
    networks:
      - traefik

  traefik-dashboard:
    image: hhftechnology/traefik-log-dashboard:latest
    container_name: traefik-log-dashboard
    restart: unless-stopped
    ports:
      - "3000:3000"
    volumes:
      - ./data/dashboard:/app/data
      - ./data/positions:/data
    environment:
      # Agent Configuration - REPLACE WITH YOUR TOKEN
      - AGENT_API_URL=http://traefik-agent:5000
      - AGENT_API_TOKEN=d41d8cd98f00b204e9800998ecf8427e
      - AGENT_NAME=Default Agent

      # Node Environment
      - NODE_ENV=production
      - PORT=3000

      # Display Configuration
      - NEXT_PUBLIC_SHOW_DEMO_PAGE=true
      - NEXT_PUBLIC_MAX_LOGS_DISPLAY=500
    depends_on:
      traefik-agent:
        condition: service_healthy
    networks:
      - traefik

networks:
  traefik:
    external: true
After this, you need to enable your Traefk container to have access and application logging enabled and tell it where to write the logs:
command:
  # Enable access logs for all routed traffic
  - --accesslog=true
  - --accesslog.format=json
  - --accesslog.filepath=/logs/access.log
  - --accesslog.bufferingsize=0

  # Enable Traefik application logs
  - --log.level=INFO
  - --log.filepath=/logs/traefik.log
In my Traefik container, I used the following bind mount to bind where the log files for Traefik were written to so I could read these into my traefik-dashboard container:
volumes:
  - /home/linuxadmin/homelabservices/traefik-dashboard/logs:/logs
Once you have your files in place, just bring up your Docker compose stack:
docker compose up -dCheck to see if the compose stack is running with the following:
docker compose psAdding a label to your traefik logs dashboard
You can of course also add labels to your Traefik logs dashboard so that you can issue certificates for your dashboard as well. You can add a labels section to your traefik-dashboard section of your Docker compose:
labels:
      - "traefik.enable=true"
      - "traefik.http.routers.traefiklogdash.rule=Host(`traefiklogs.yourdomain.com`)"
      - "traefik.http.routers.traefiklogdash.entrypoints=websecure"
      - "traefik.http.routers.traefiklogdash.tls=true"
      - "traefik.http.services.traefiklogdash.loadbalancer.server.port=3000"
Navigating around the dashboard and features
Once you browse out to the Traefil Log Dashboard, you will see the dashboard screen that looks like this. you can view Demo data if you want, or you can click the Launch Dashboard button to navigate out to see your own log data.
You will be able to see the Overview dashboard that shows you a general overview of the environment, status codes, average response times, etc.
Below is a view of the Traffic tab. This shows you things like top routes, top services, backend services, etc.

The clients view shows you a list of IP addresses of clients connecting to your environment through your Traefik proxy.

On the Geography tab, you have a great view of the sources of the connections. So, you get a very good visual representation of where your traffic is coming from. I think especially if you have an externally facing proxy that is serving out public resources, this is a great feature that you can use to see where hits are coming from.

The logs tab is a great real-time view of the log entries with Traefik. It shows you the entries, methods, paths, statuses, services, etc. I think this is a simple view but extremely important. Just being able to see your traffic coming in and what status you are getting for incoming requests.

How this will complement your other tools you are using?
I don’t think this is going to replace other tools you are using that are dedicated to monitoring like Netdata, Prometheus, Grafana, and others. However, I don’t see this conflicting with these other tools. It provides something very specific that allows you to have visibility into the logs of your reverse proxy solution. In fact, it complements them nicely. Metrics you gather from these other tools (monitoring tools you are using) tell you how your system is performing. Logs tell you what is actually happening at the request level in Traefik. Having both gives you a more complete picture.
For an overview of using Netdata, check out my post here: Netdata Docker Monitoring for Home Lab.
Wrapping up
All in all, I think the Traefik Logs Dashboard is a great dashboard to monitor your Traefik installations and other reverse proxy solutions like Pangolin that use Traefik underneath the hood. For the most part, we don’t need to see low-level requests and logs in the reverse proxy. However, when you do, you don’t want to have to start digging in container logs and other command line tools to get the information you are looking for.
This Traefik Logs Dashboard gives you a human friendly and readable view of your traffic that helps to fill the gaps that if you are running Traefik, you probably have. It will give you better troubleshooting, better security, and a better understanding of how your self-hosted services are actually being accessed.
How about you? Are you using this project or have you tried it? Are you going to try it? What other tools are you currently using to monitor and have visibility to the logs of your reverse proxy?
Google is updating how articles are shown. Don’t miss our leading home lab and tech content, written by humans, by setting Virtualization Howto as a preferred source.


