
Keeping your network diagrams up to date can be a chore. You already probably know how this story ends. You start out having good intentions and use something like draw.io to sketch out your switches, routers, VLANs, and servers, and everything looks good. Then the network evolves and changes. You add and remove things. The diagram quietly drifts out of date. This is where a tool called Scanopy comes in. It provides automated network diagramming by scanning your environment and building diagrams based on what is actually there. Let’s see how.
Manual network diagrams are a challenge
Just as a brief call out here at the problem we are trying to solve, manual network diagrams are a challenge to not only create, but also maintain. It requires strict discipline to remember to update the diagram every time you make a change. In a home lab changes often happen constantly. I know they do in my lab. Changes can happen late at night, early in the morning, or at other odd times. Documentation might be the last thing on your mind.
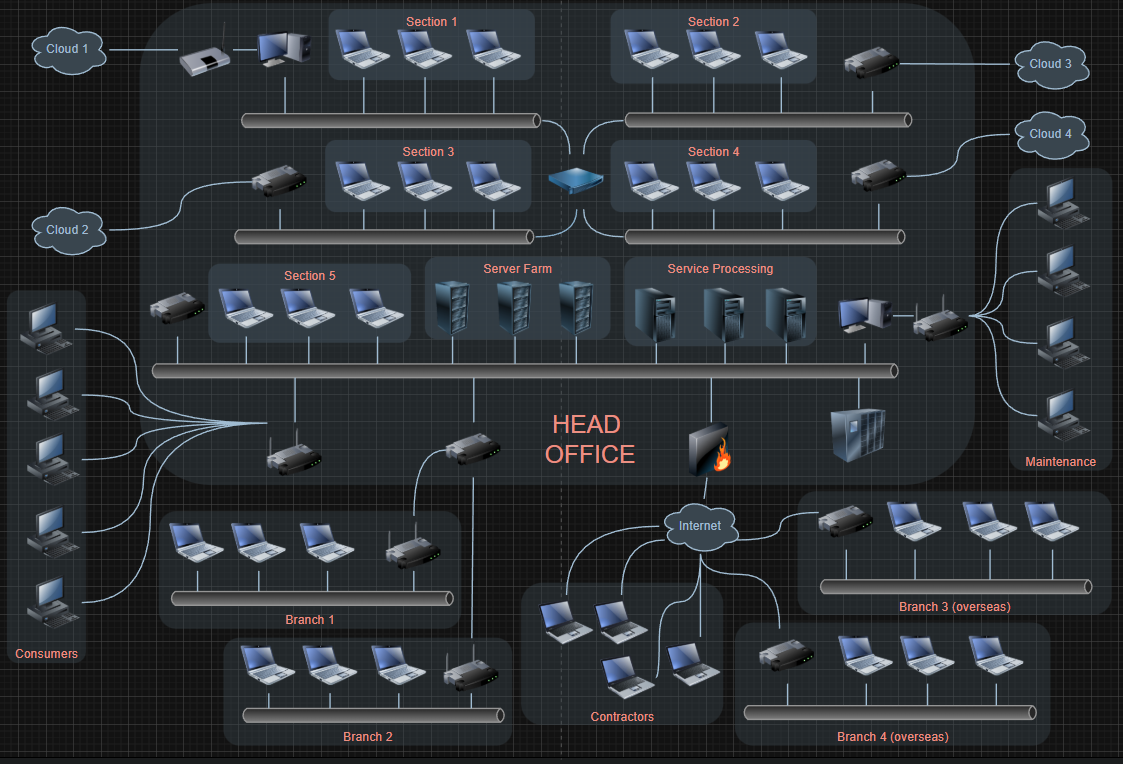
Also, if you are like me, you tell yourself, I will update that “tomorrow”. Tomorrow never comes when it relates to documentation. We forget or other things get in the way. Also, these diagrams are time consuming to first of all create, and to keep them updated. And, then finally, the challenge that Scanopy helps with – automated network diagramming and keeping your network diagrams up to date.
What Scanopy is and why it is a different diagramming tool
Scanopy provides automated network diagramming. It scans you rnetwork and builds interactive topology diagrams based on what it finds. So, instead of you drawing your network, Scanopy scans and observes it. It connects to the network, discovers hosts and services, and sees how they are related. It then turns this information into a visual map that you can actually use.
So, as a result, you don’t get just a static image that is a snapshot in time. But instead, you get a living diagram that shows your network and all the hosts and devices it contains. Pretty cool!
Check out the official project here: GitHub – scanopy/scanopy. For those that would like to have a SaaS version of the tool, there is also a cloud-hosted version that you can sign up for here: scanopy.net.
How Scanopy Works at a High Level
Scanopy works by scanning your network to discover devices, services, and relationships. You point it at a network range or environment, provide any required credentials or access details, and let it do the heavy lifting.
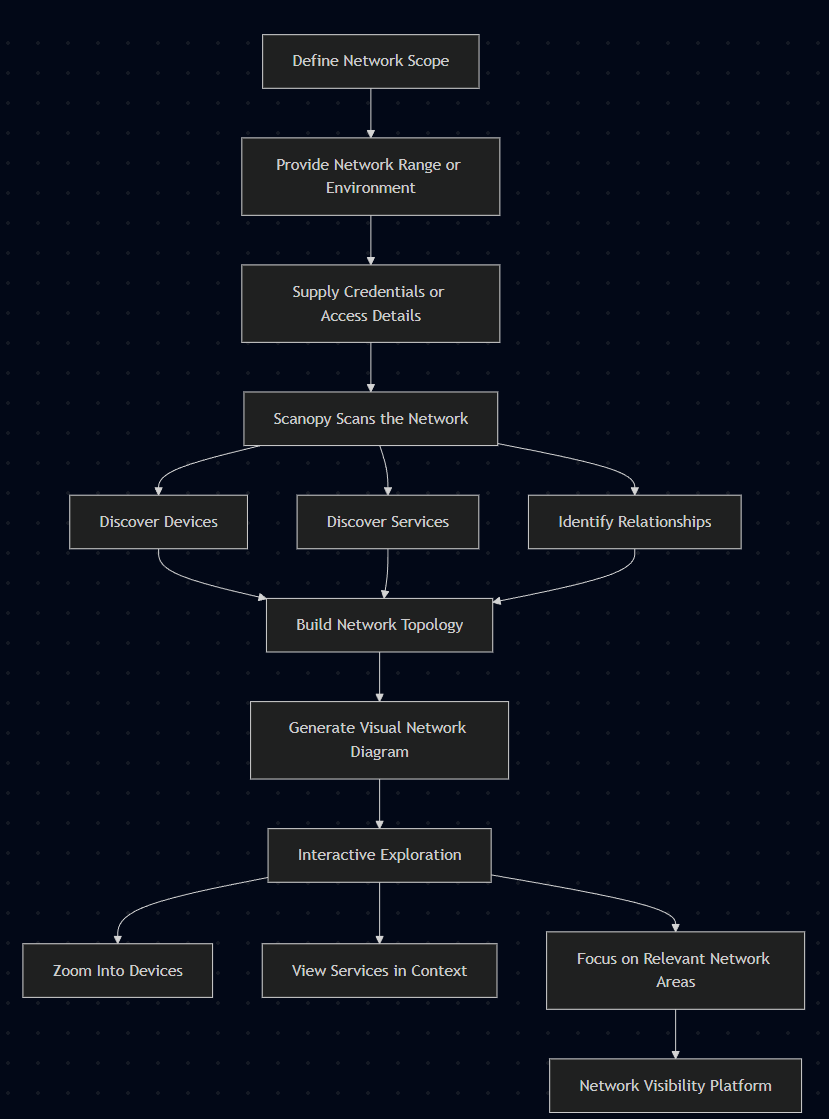
Once the scan completes, Scanopy then will build you a visual topology that represents what it found. Your devices appear as nodes and also connections are mapped. Services can be visualized in context rather than as isolated lists.
The diagrams are interactive, meaning you can explore different parts of the network, zoom in on specific devices, and focus on what matters most to you.
This approach makes Scanopy feel less like a diagramming tool and more like a network visibility platform.
Deployment strategies for Scanopy
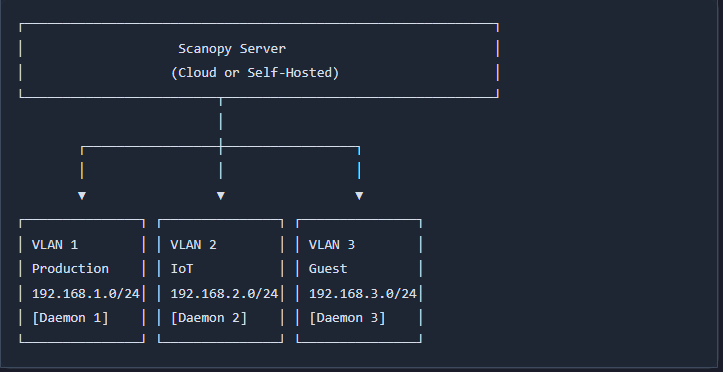
There are a few different scenarios to note in how you can deploy Scanopy for automated network diagramming. Since the tool uses scans to create the network topologies and perform service discovery, you need to think about how your networks are connected. The deployment strategies include the following three ways to deploy the tool:
- One daemon per VLAN – (this is their recommended approach)
- Central daemon with routing – (this is the default and how it is installed)
- Hybrid approach – You are not locked into a central daemon or one for every VLAN, you can mix and match these as you need for scanning accuracy and discovery information
| Scenario | One Daemon Is Enough When | You Need Multiple Daemons When |
|---|---|---|
| Network reachability | All hosts exist on the same subnet as the daemon | VLANs or subnets are isolated by firewall rules |
| Routing | A management host has routes to all VLANs | No routing exists between network segments |
| Firewall policy | Firewall rules allow the daemon to reach all required subnets | Firewalls block cross VLAN or inter subnet access |
| MAC address visibility | MAC address collection is not required from isolated networks | MAC address collection is required and needs Layer 2 access |
| Security requirements | All networks share the same security and access requirements | Different networks have policies that restrict access |
| Deployment complexity | Centralized deployment is acceptable | Distributed deployment is necessary for visibility |
One Daemon per VLAN
This is the preferred way to deploy Scanopy if you have a multi-VLAN environment as it provides the highest level of information, including MAC addresses and ARP information. Also, you don’t have to worry about inter-VLAN firewall rules being needed. This gives you the best discovery accuracy.
Central daemon with routing
Use a single daemon on a host that can route to all VLANs. When you deploy the solution by default, you are getting the first daemon as part of the Docker installation. And, if you have inter-VLAN routing enabled on your firewall where the Docker container can route to other VLANs, this works out of the box. Just keep in mind that you won’t get MAC addresses for remote subnets and it does require that you have firewall rules and routing in place.
Hybrid Approach
You can also use a hybrid approach. You can just rely on the central daemon for VLANs that have routable networks and that you might not necessarily need MAC address information for and then you can also use dedicated daemons for isolated segments.
Install Scanopy using Docker
The installation of Scanopy Server in a self-hosted environment is very easy. Using a Docker host that you have running on your Promxox host or something else, you just curl down the Docker Compose file using the command here:
curl -O https://raw.githubusercontent.com/scanopy/scanopy/refs/heads/main/docker-compose.ymlThen you just run a typical docker compose up -d command:
docker compose up -d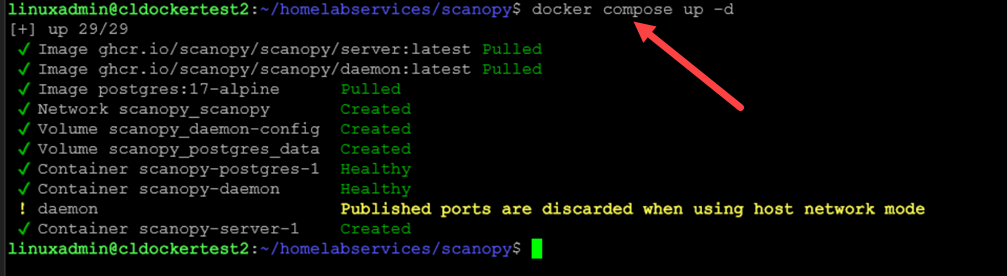
Once you have the Scanopy server up and running, it defaults to running at an extremely high port. Navigate to: http://<your docker host IP or FQDN>:60072
Initial setup wizard
When you browse out to the URL above, you will be presented with the initial wizard. First, you will be asked how will you use scanopy? It is cool there is a Homelab option already built-in.
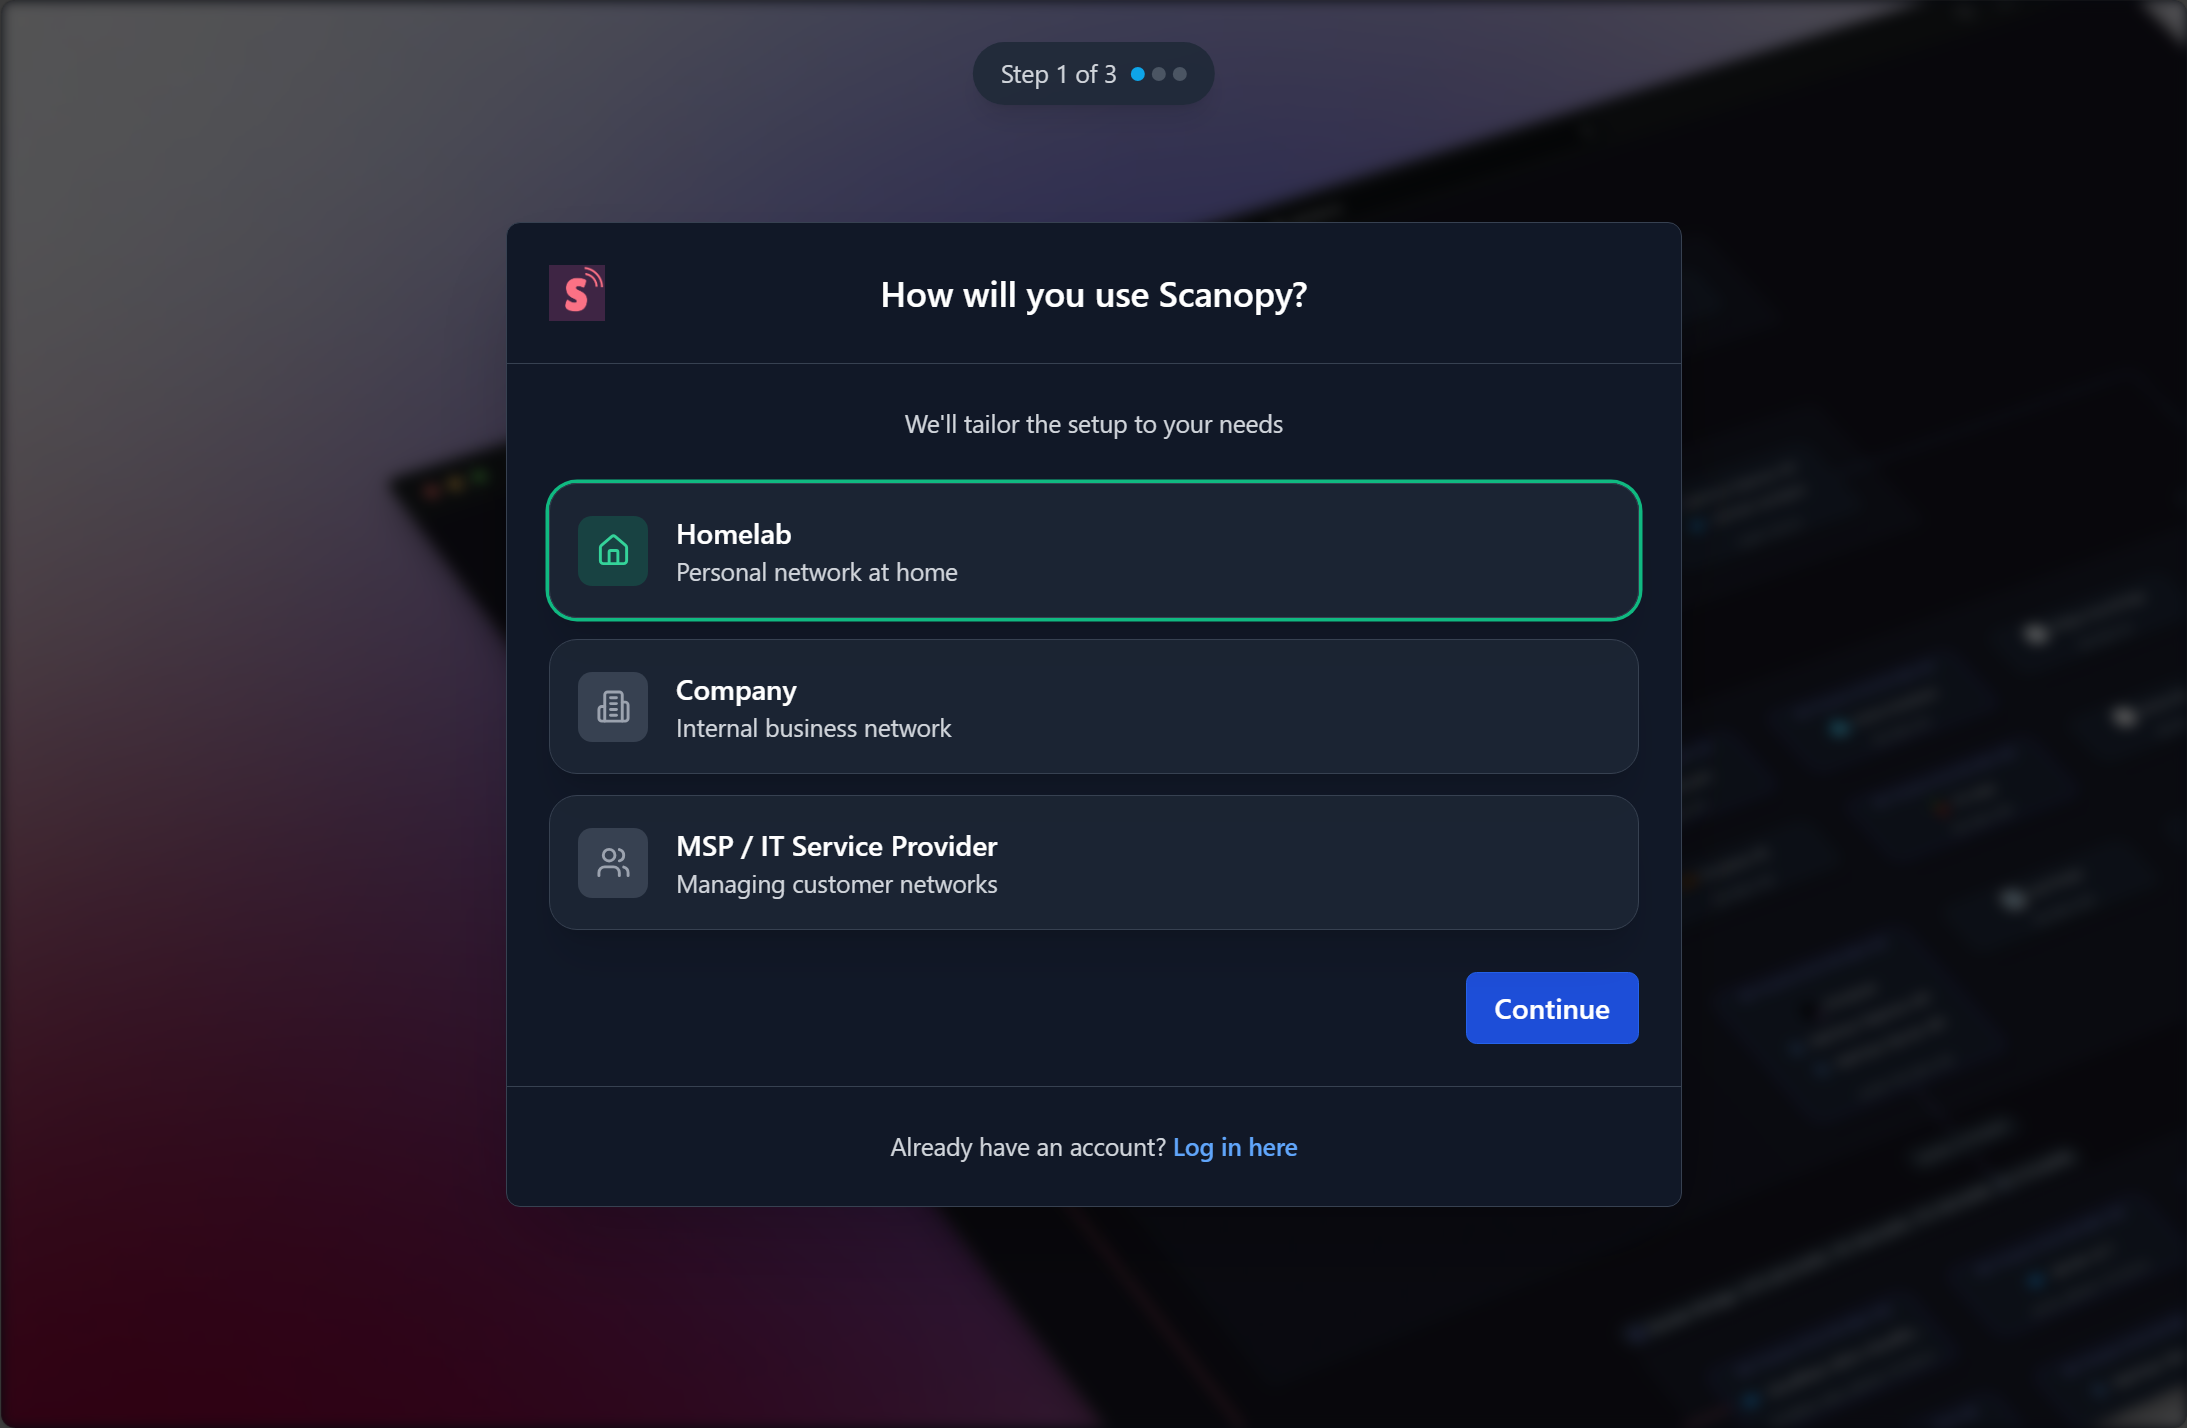
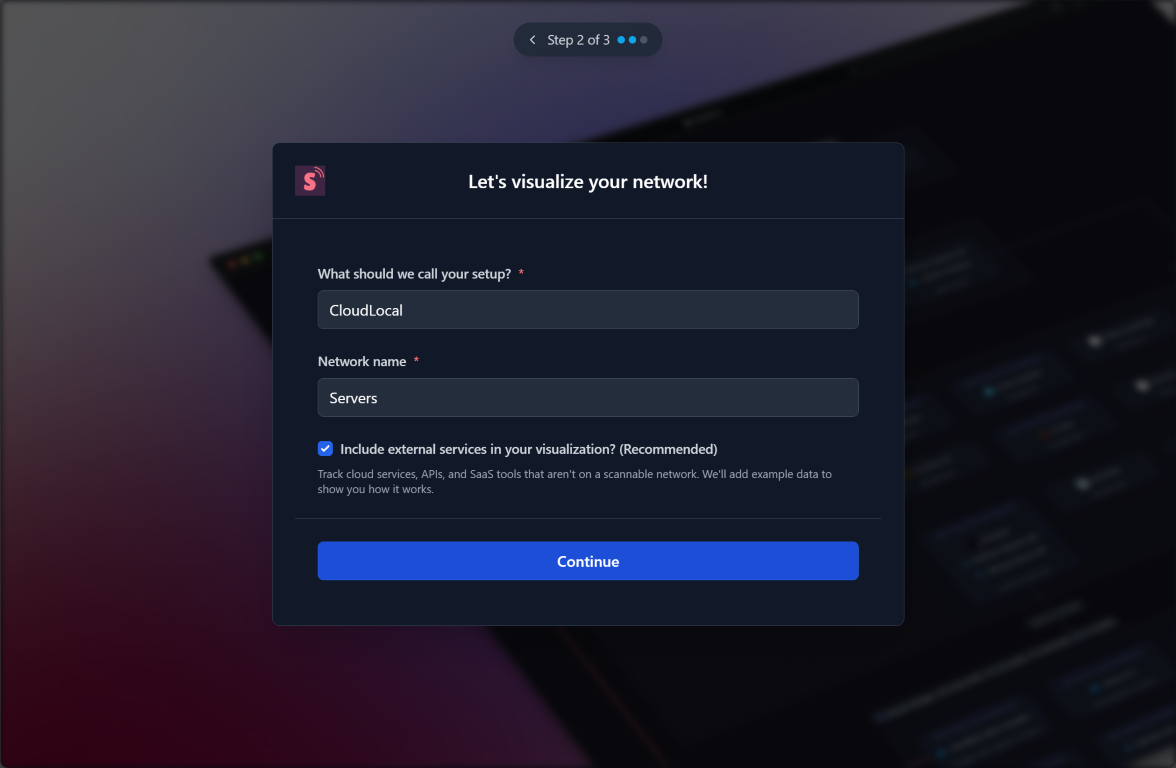
Next, you will name your setup and also your first network.
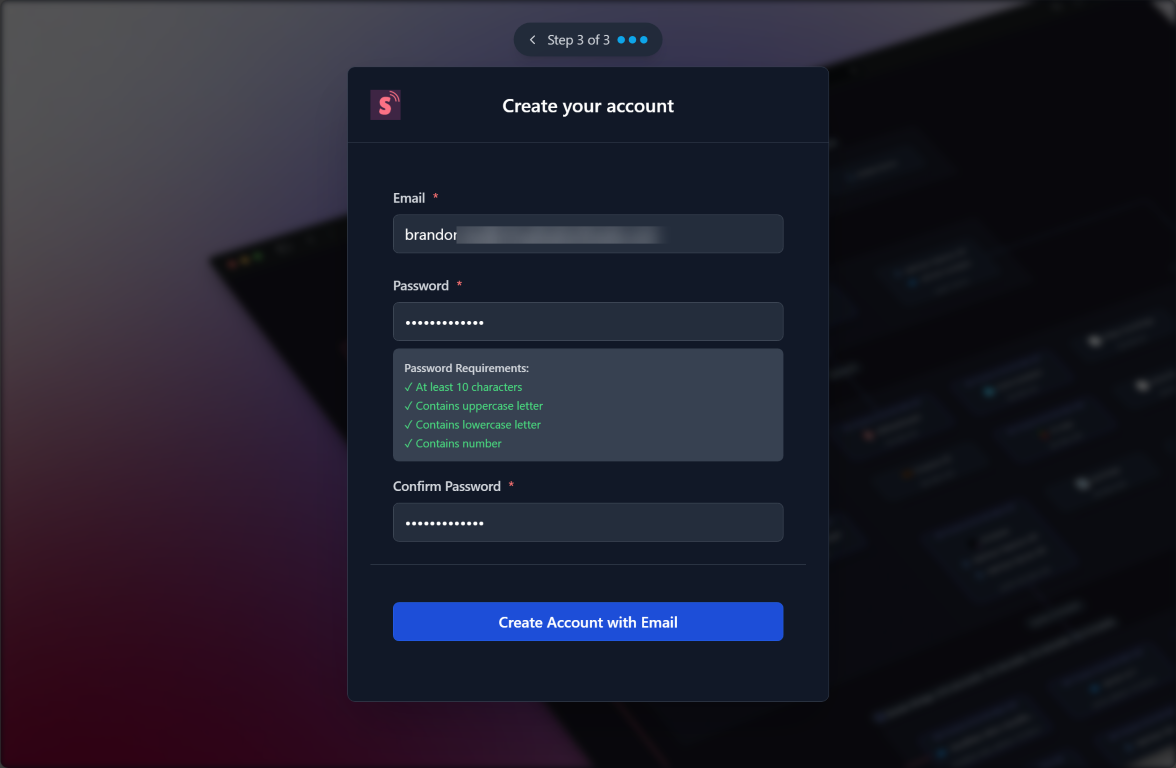
Finally, we will use an email to create an account and password.
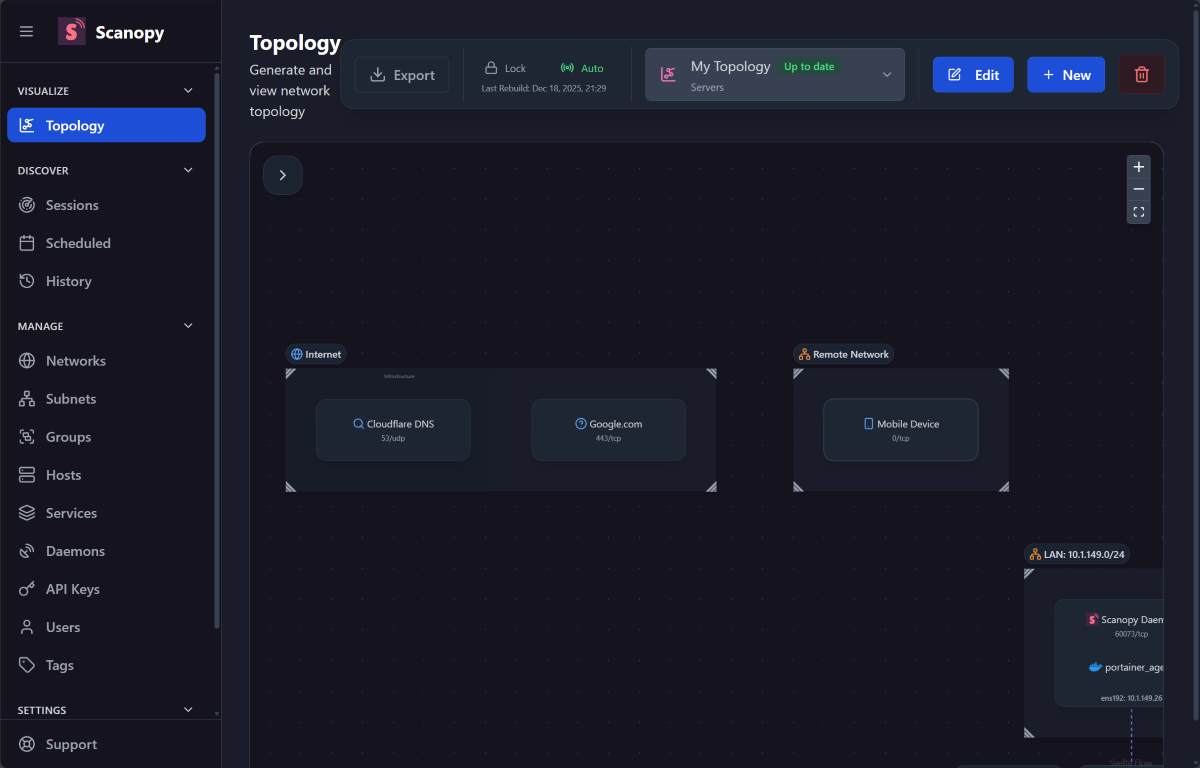
After running through the initial wizard above, you will be taken to the Scanopy dashboard. As you can see, it will already get started adding services. I saw External services added first as the initial network scan began behind the scenes.
Multi-VLAN deployment with multiple daemons
This section goes along with the deployment strategies and gets into the realm of the scenario where you have multiple VLANs and need MAC address information or have restricted access to certain VLANs. If you have VLANs that are protected or isolated from other VLANs with firewall rules, you will need to install multiple daemons. Do reference the section above on deployment strategies.
Installing a Scanopy daemon
If you need to install a new Scanopy daemon on a Docker host that is in the other network, you can use the following Docker Compose code:
services:
  scanopy-daemon:
    image: ghcr.io/scanopy/scanopy/daemon:latest
    container_name: scanopy-daemon
    network_mode: host
    environment:
      - SCANOPY_SERVER_URL=https://your-server-url
      - SCANOPY_DAEMON_API_KEY=your-api-key
      - SCANOPY_MODE=pull
    volumes:
      - /var/run/docker.sock:/var/run/docker.sock:ro  # Optional: for Docker discovery
    restart: unless-stopped
Or you can run the Docker run command directly:
docker run -d \
--name scanopy-daemon \
--network host \
-e SCANOPY_SERVER_URL=https://your-server-url \
-e SCANOPY_DAEMON_API_KEY=your-api-key \
-e SCANOPY_MODE=pull \
-v /var/run/docker.sock:/var/run/docker.sock:ro \
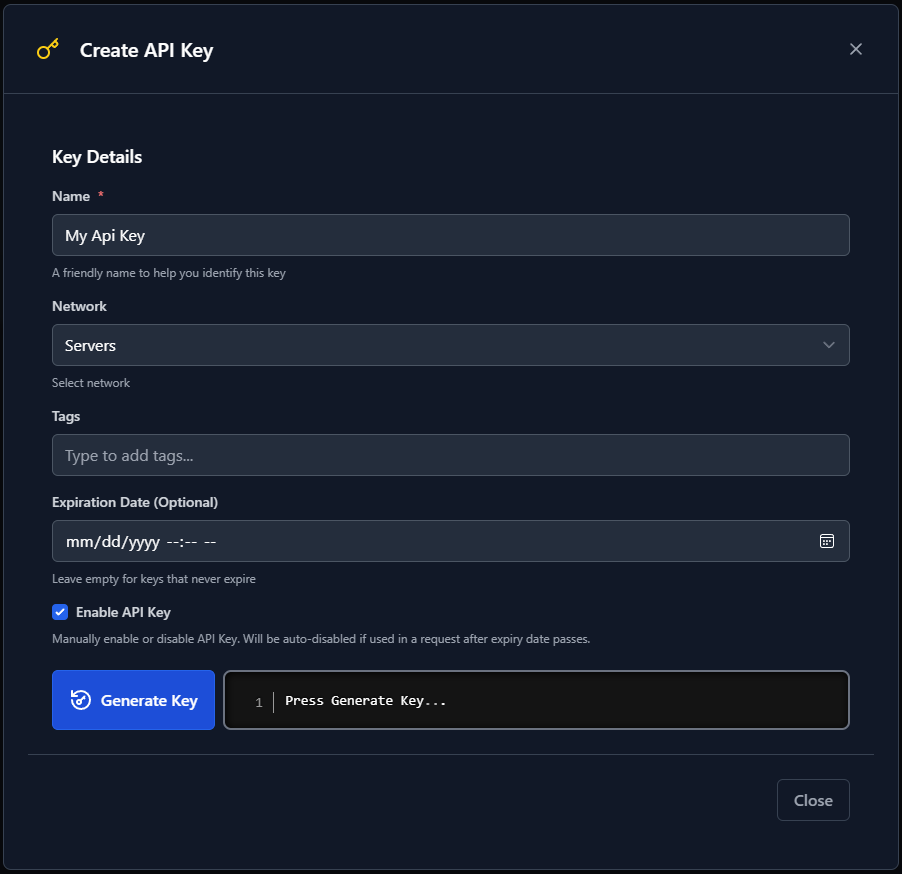
ghcr.io/scanopy/scanopy/daemon:latestIf you wonder where you get the API key, you can create a new API key for your daemons under Manage > API keys.
Quality visualizations
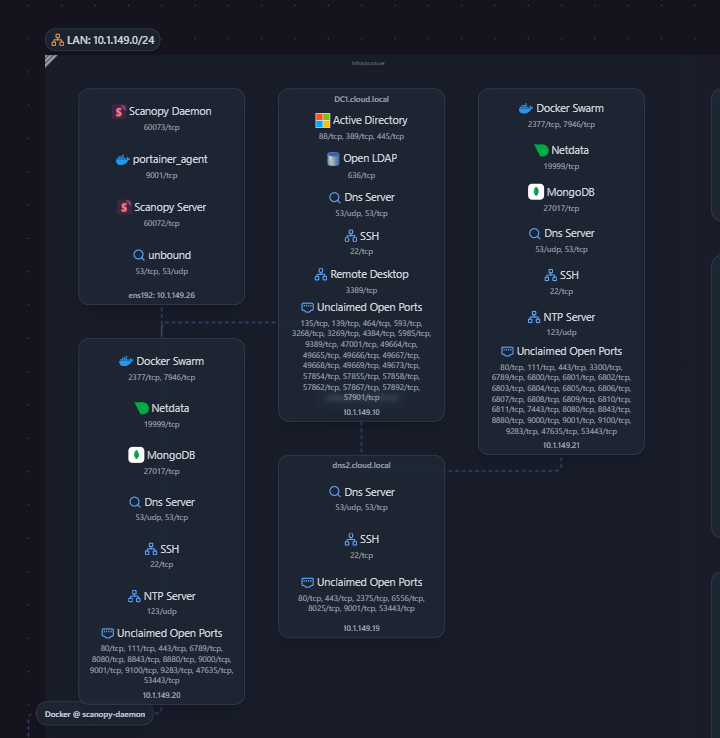
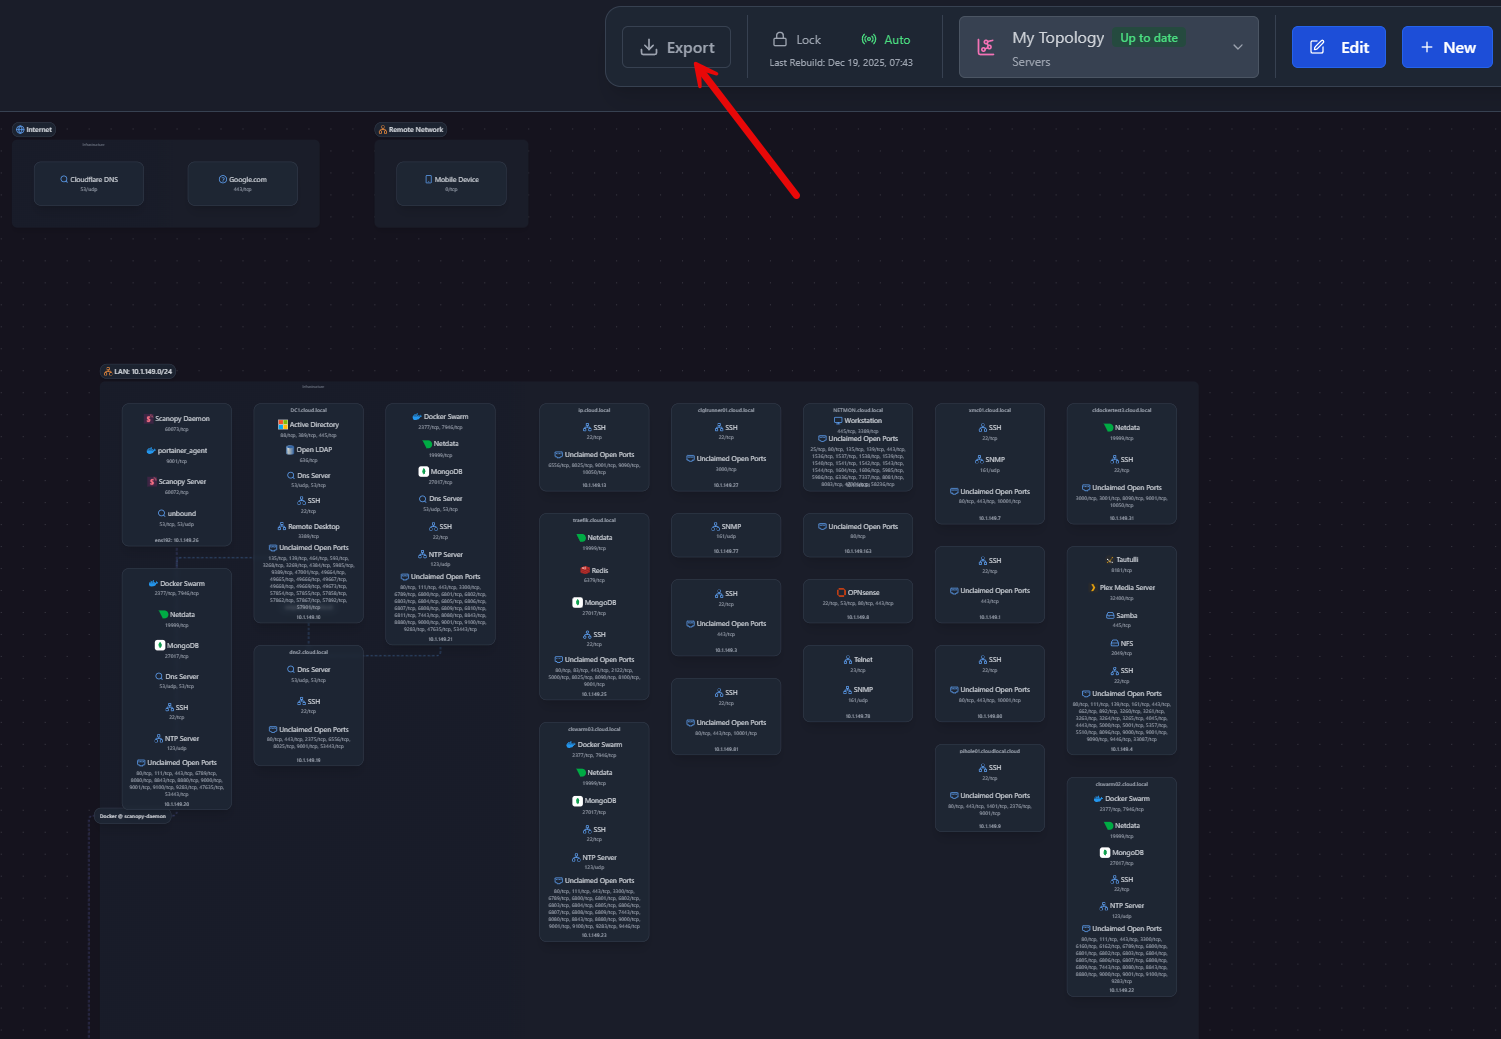
I think one of the benefits with Scanopy that I see is not just the automated network diagramming, but the quality of the generated diagrams and visuals. These don’t look like just rough diagrams or Mermaid sketches. The visuals are clean and modern. And they have the actual icons for services that are discovered and represented. Connections are readable and layouts are not messy.
For all of us that have created diagrams manually, this is a big deal. The details I think with the solution are represented clearly. You can also Export the diagrams and these export to a PNG file. One small tweak here that I think would make the solution much better here is to include Export options where you can choose to export not just to a PNG file but to something like a PDF format.
Service discovery
One of the areas or features that I think is great with Scanopy is the fact that we get service discovery with it. With Scanopy, you are not just getting a simple “hey host 10.1.149.26 is alive and it is running Linux”. You are getting an actual scan that has intelligence to say, this host is a Docker host, and it is running the following containers that we have discovered based on the ports listening, etc.
When it comes to network diagrams, we know that a single host might represent 20 different critical services we have running. Having a tool that understands this and is able to identify those services is a powerful feature.

Limitations to be aware of
Scanopy is a great tool. But as always, no tool is perfect. There are a few things to be aware of with the tool, and keep in mind that many of the limitations are limitations for any network discovery tool and not just Scanopy.
Scanopy may have a hard time getting information for networks that are heavily locked down and this is just something to be expected. Also, large networks with lots of clients and other devices will look complex. But this is the nature of the beast. Also, there are around 200 or so services that it recognizes currently. So, it is not going to capture everything. There will likely be services you are running that are unknown to Scanopy at this stage.
One limitation that I surfaced and already mentioned above is the inability to export in any format other than PNG. It would be great if there were other formats here that could be chosen for the export or options for the export process itself like including or excluding certain things. That said, I am really looking forward to seeing how the product matures.
Video
Check out my video overview of the solution here:
Wrapping up
Network diagrams are something that I have never really “enjoyed” creating. However, they can be exceptionally useful if you want to have something that is meaningful and helps you to visualize what is going on. Part of what makes them such a drag is the time involved creating them and then also the updating them aspect. Scanopy’s automated network diagramming can take these really negative aspects of creating network diagrams and documentation and make it automatic in a way that makes them ease to keep up to date. What tools are you using for your network diagrams? Do you already have some type of automated network diagramming and if so, what tool are you using?
Google is updating how articles are shown. Don’t miss our leading home lab and tech content, written by humans, by setting Virtualization Howto as a preferred source.
About The Author


Very nice looking tool….going to check this out. Network maps and documentation are things I haven’t done very well at keeping up, so this could be helpful.
jdodd14,
Definitely, you will love the fact that the diagrams are just set it and forget it with the tool. I think this will help a lot of us out with our documentation needs.
Brandon
Great job! Have you done a video of this one? I completed the install on a simple home network. So far, it see the internet, Google and a mobile device, but nothing else. Looking forward to learning more about the settings and options.
Shay,
This will definitely be an upcoming video so stay tuned on this. Also, you have to create a new “network” for it to start scanning. I didn’t mean to leave this out of the blog post, but will go back and add. Go down to the “Network” option in the left hand menu and “create network”. This is where you define the network you want it to discover, which by default is the subnet it is on. Hope this helps!
Thanks Shay!
Brandon