
I feel like the pieces of Docker monitoring with recent tools brought online in the home lab has finally started to fall into place. For a long time in my home lab, my approach to Docker monitoring was pretty basic. If the container was running and seemed to be responding, that was good enough. And, for the most part, this approach works for many others for basic sanity checks. However, as I have started running more and more of my critical services inside Docker containers, I realized these basic checks aren’t really eough. Let me share the three tools, Pulse, Uptime Kuma, and LoggiFly, that I think are the almost perfect trifecta of Docker container monitoring.
Why basic Docker container monitoring may not be enough
Basic monitoring will get you the basics. But, case in point. A container can be running but starved for resources. A service can be reachable but returning errors. Logs can be filling with warnings hours or days before something finally crashes. By the time you notice the problem, you are probably already behind.
Instead of trying to find one specific tool that did everything that I wanted it to do, I focused on covering three specific questions:
- Is the underlying platform healthy?
- Are my applications actually reachable?
- What is happening inside the containers themselves?
Over the past few weeks, I have reviewed and tested out many new tools that have a lot of great features that when combined with one another, they make an almost perfect solution for Docker container monitoring.
Why layered monitoring matters for Docker environments
Docker has literally changed how I deploy things in the home lab and run critical applications. Containers make things quick and easy to deploy. However, it also means there is a lot going on underneath the hood.
If you only monitor a container to make sure it is up, you will probably miss issues like CPU contention on the host or memory pressure that slowly builds up and causes performance issues. Monitoring your host is a great place to start as your hypervisor host holds the key to all the performance and stability of your virtualization environment. But this is only one aspect.
There is also the service layer to make sure the application is responding, even if the host metrics are good. You might have another issue that is unrelated to performance metrics on the host that takes your application down. So you need to know if the application is responding like it needs to.
Each layer that I am using helps to answer a different question and this helps me tell the whole store when it comes to my Docker containers and the applications they run.
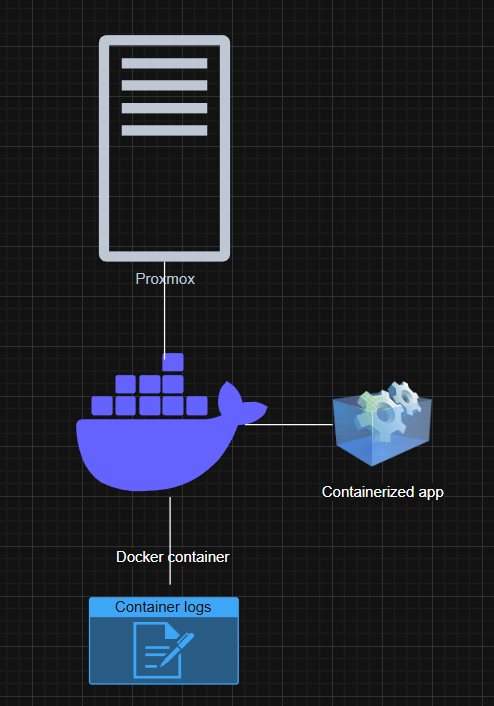
- Pulse covers the platform layer (Proxmox host, VMs, LXCs)
- Uptime Kuma covers the service layer (Checks applications to make sure responding)
- LoggiFly covers the application internals (notifies on specific keywords in Docker logs)
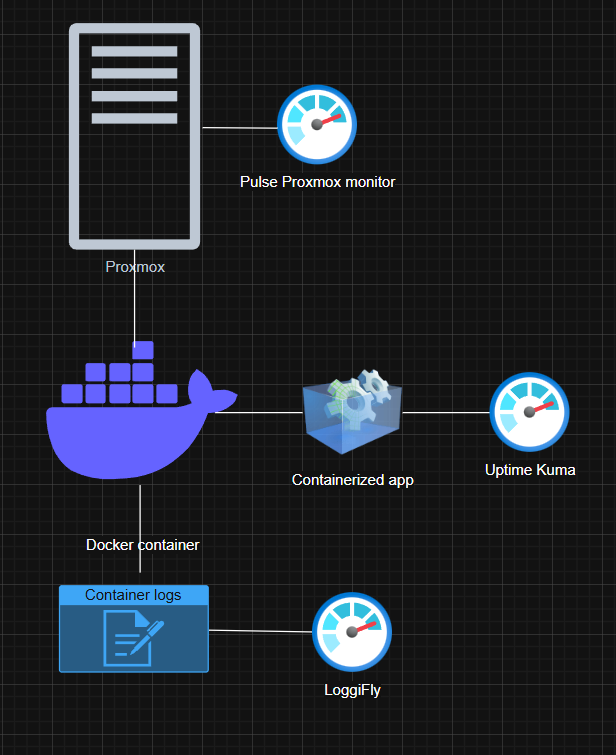
Let’s walk through how each one fits into the overall workflow.
Pulse for Proxmox host and container awareness
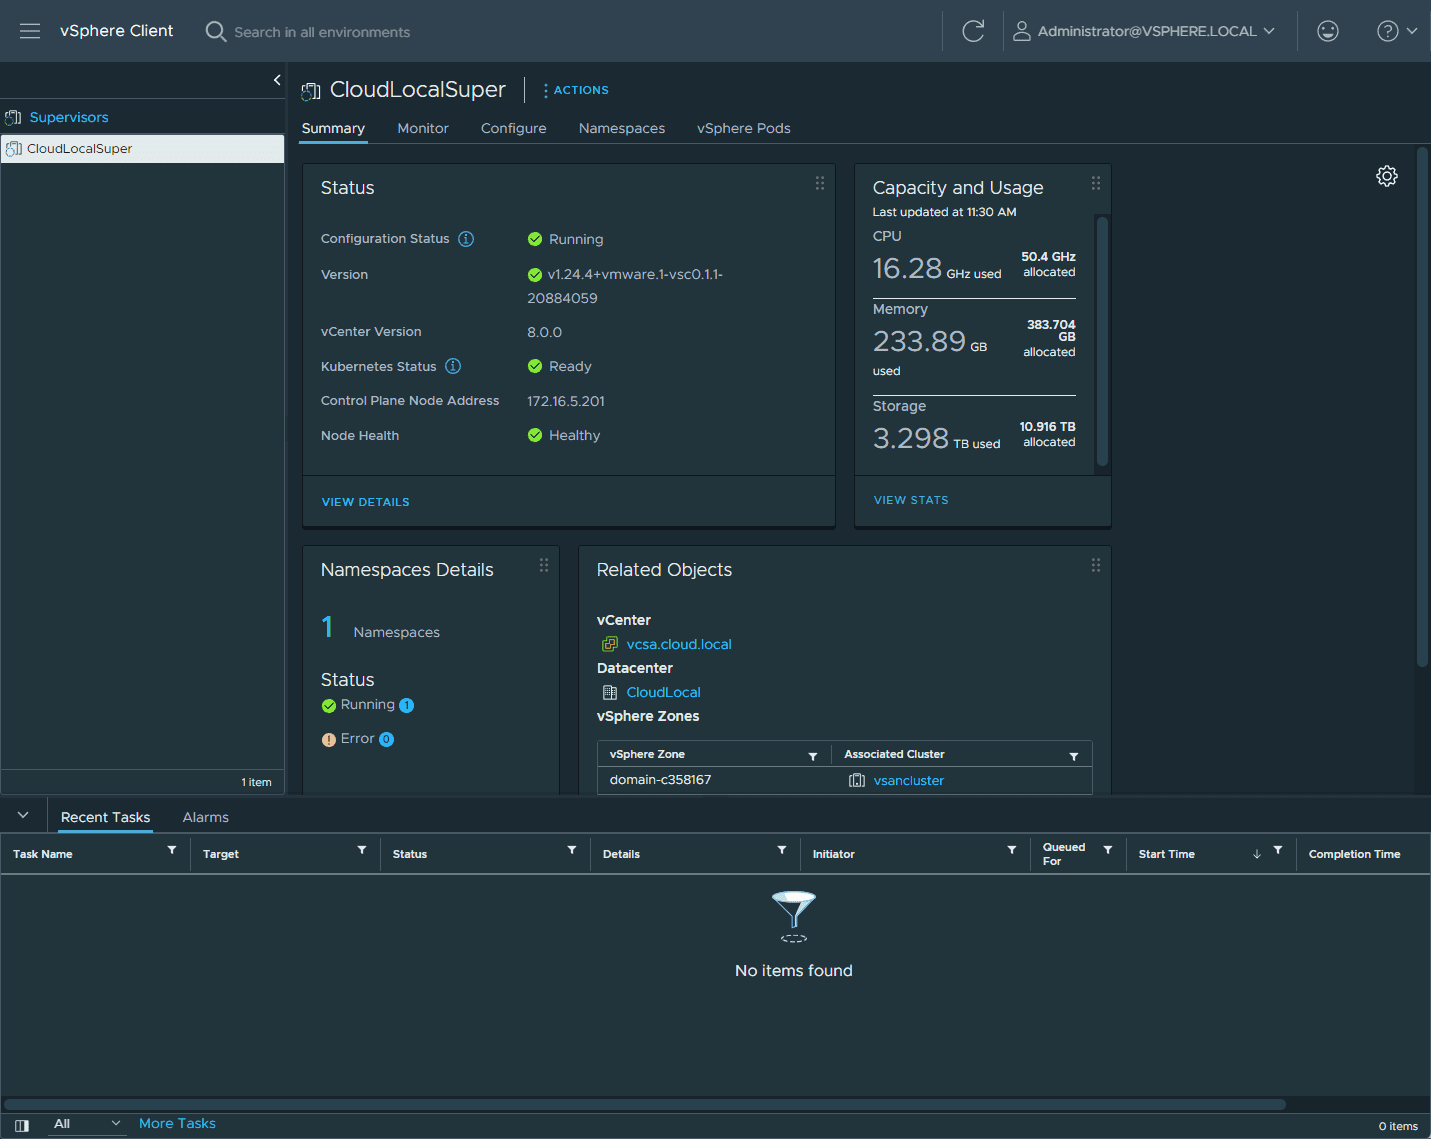
In my home lab, I am not running any of my Docker hosts on bare metal. They live inside virtual machines and Linux containers that are running on top of Proxmox. This makes both the Proxmox host and the virtual machine health extremely important.
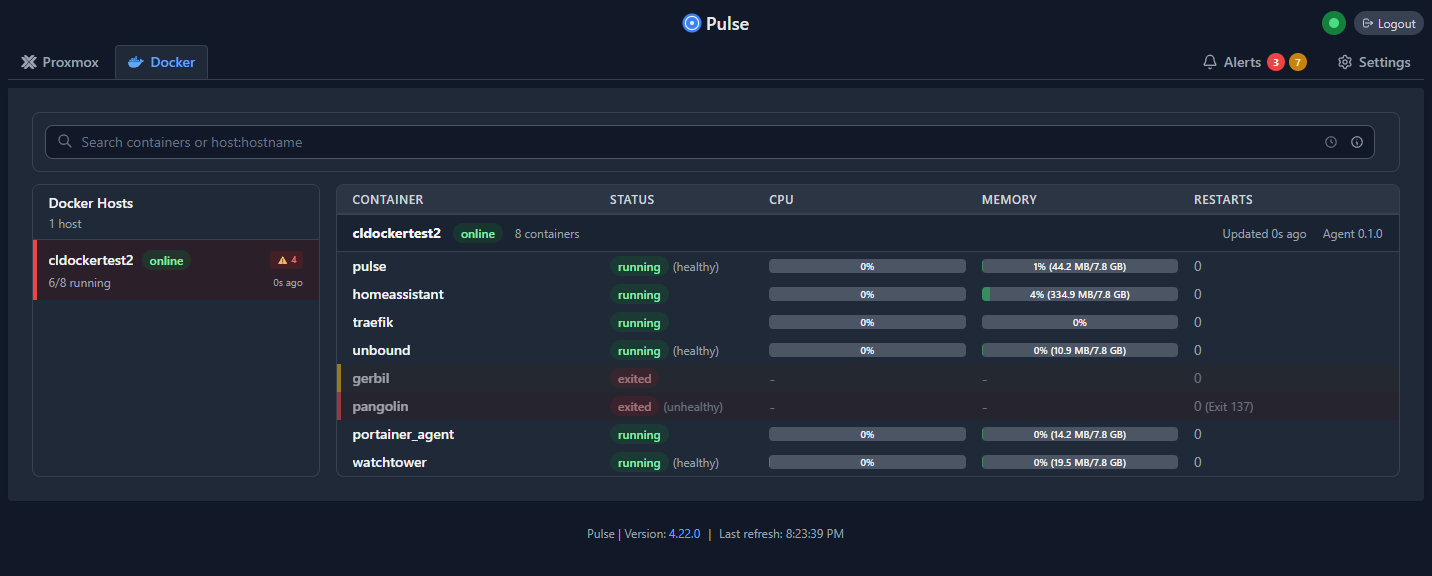
Pulse has become my go to dashboard for quick metrics on my Proxmox host, VMs, and LXCs and even Docker monitoring. It gives me an overall look at the health of the environment and resource usage across the various components of the virtualized stack.
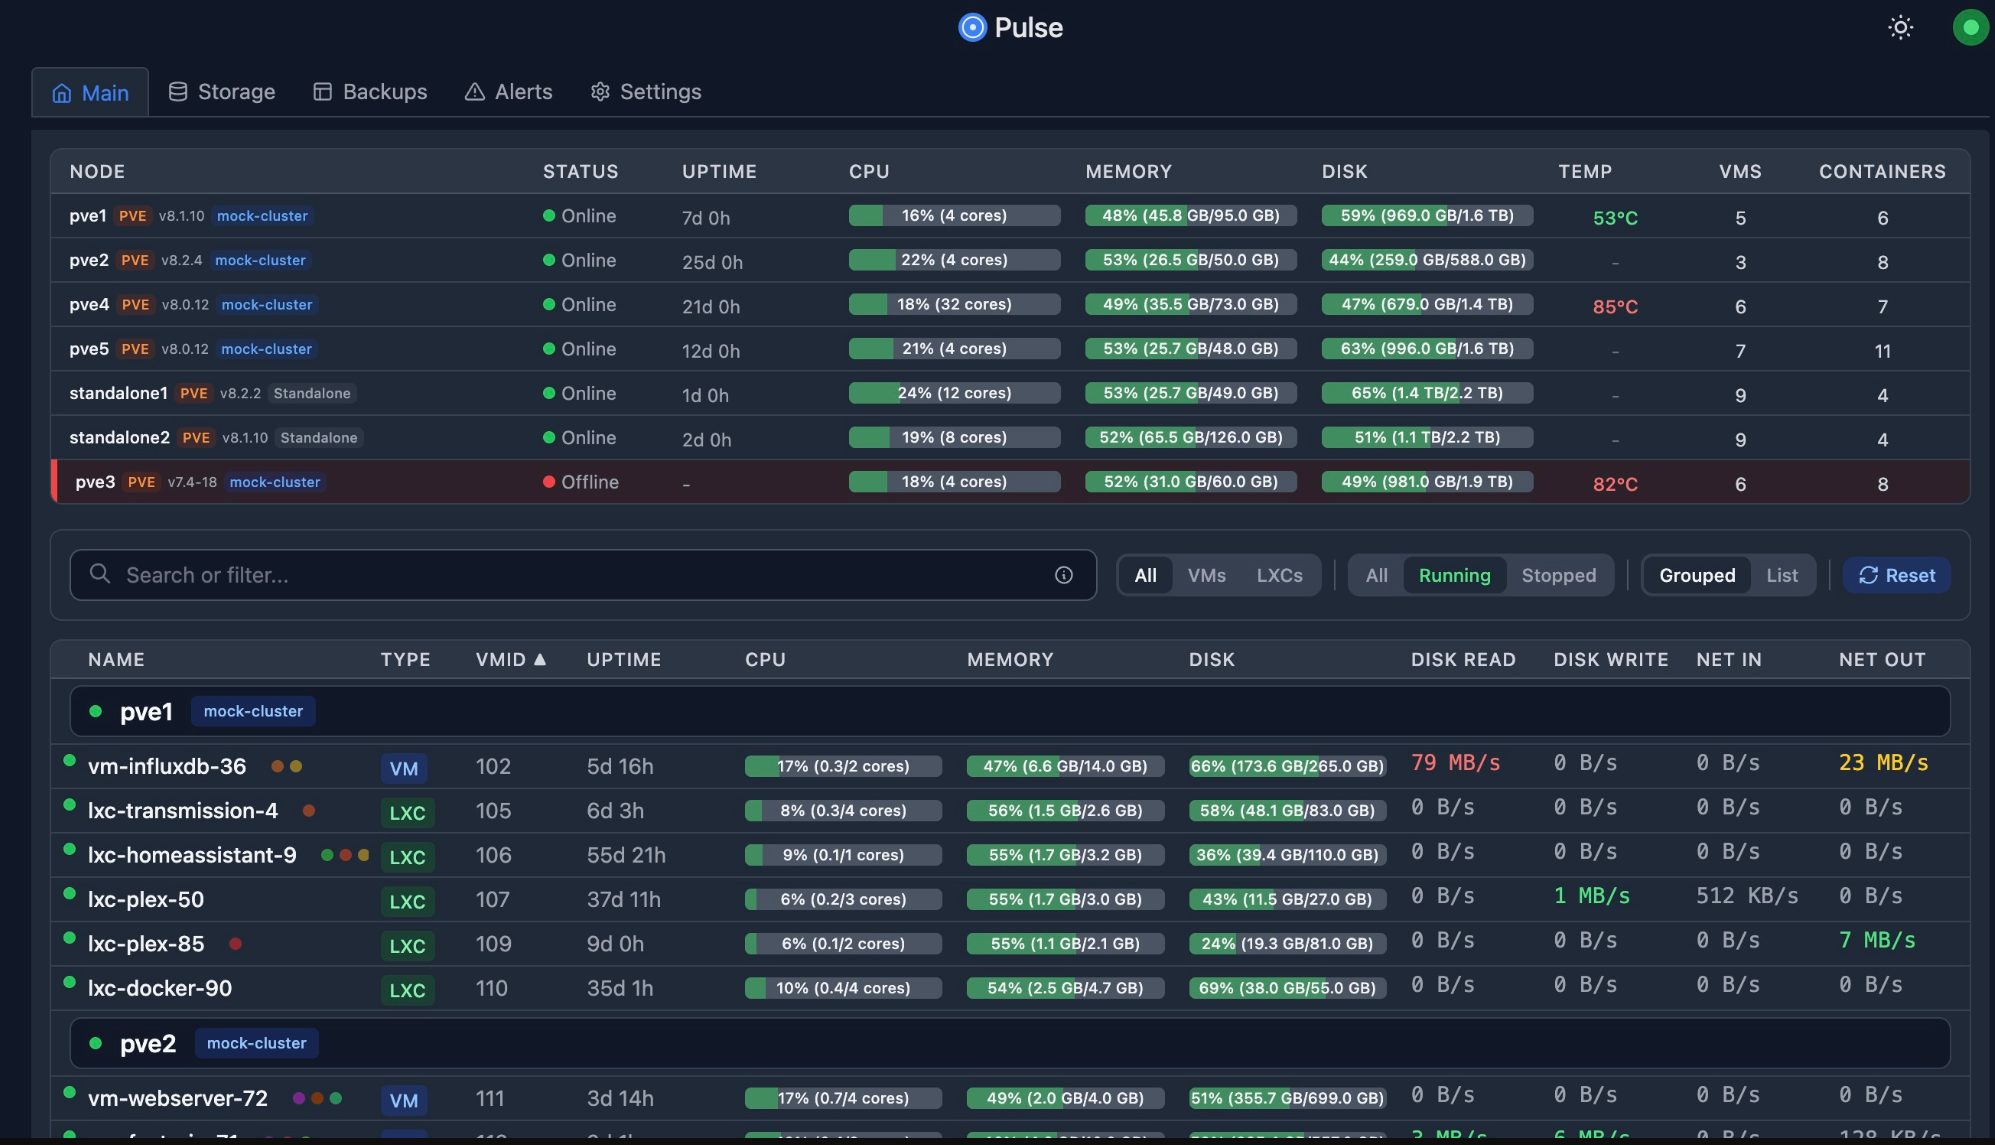
Most of my Docker containers do not run directly on bare metal. They live inside virtual machines and Linux containers managed by Proxmox. That makes host and VM visibility just as important as container visibility.
Pulse helps me to answer the questions of whether or not the platform itself is healthy that is actually running the Docker containers.
Pulse can show you if you have CPU load issues, memory pressure, disk IO sluggishness and saturated network issues. If you have a virtual machine that is hitting memory limits or the Proxmox host itself is overloaded, you can see this before you even get to the point of opening a Docker container log.
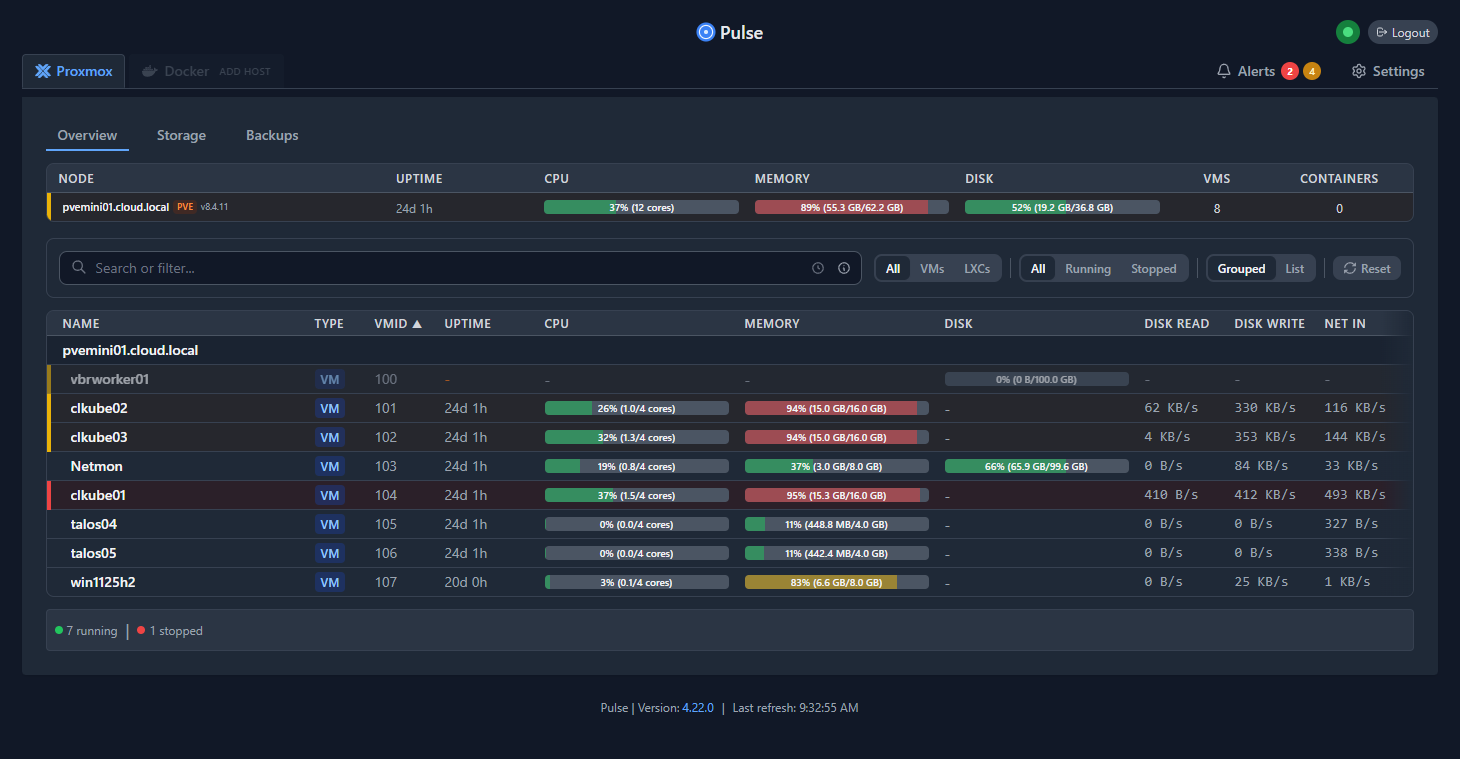
This has changed how I troubleshoot issues in the environment. So now, before I dive straight into running various Docker commands, I start by looking at the Proxmox host itself. Many issues that look like application failures may turn out to be resource contention, so this is definitely something Pulse allows you to see very quickly.
So, for anyone running Docker on Proxmox VMs or LXCs, Pulse is the starting point for solid monitoring and can monitor your containers as well.
See my dedicated post on Pulse here: This Free Tool Gives Proxmox the Monitoring Dashboard It Always Needed.
Uptime Kuma for application level monitoring
If your physical Proxmox host is ok resource wise and Pulse doesn’t surface any other issues with the platform, including the Docker host virtual machine, there is another tool that can help tell you about the service itself. That is Uptime Kuma.
Uptime Kuma is an oldie but a goodie at this point. I think all home labbers now know of or are aware of Uptime Kuma. It does a specific thing very well: show you if a service is “up” or not. It then can notify you if the service goes offline.
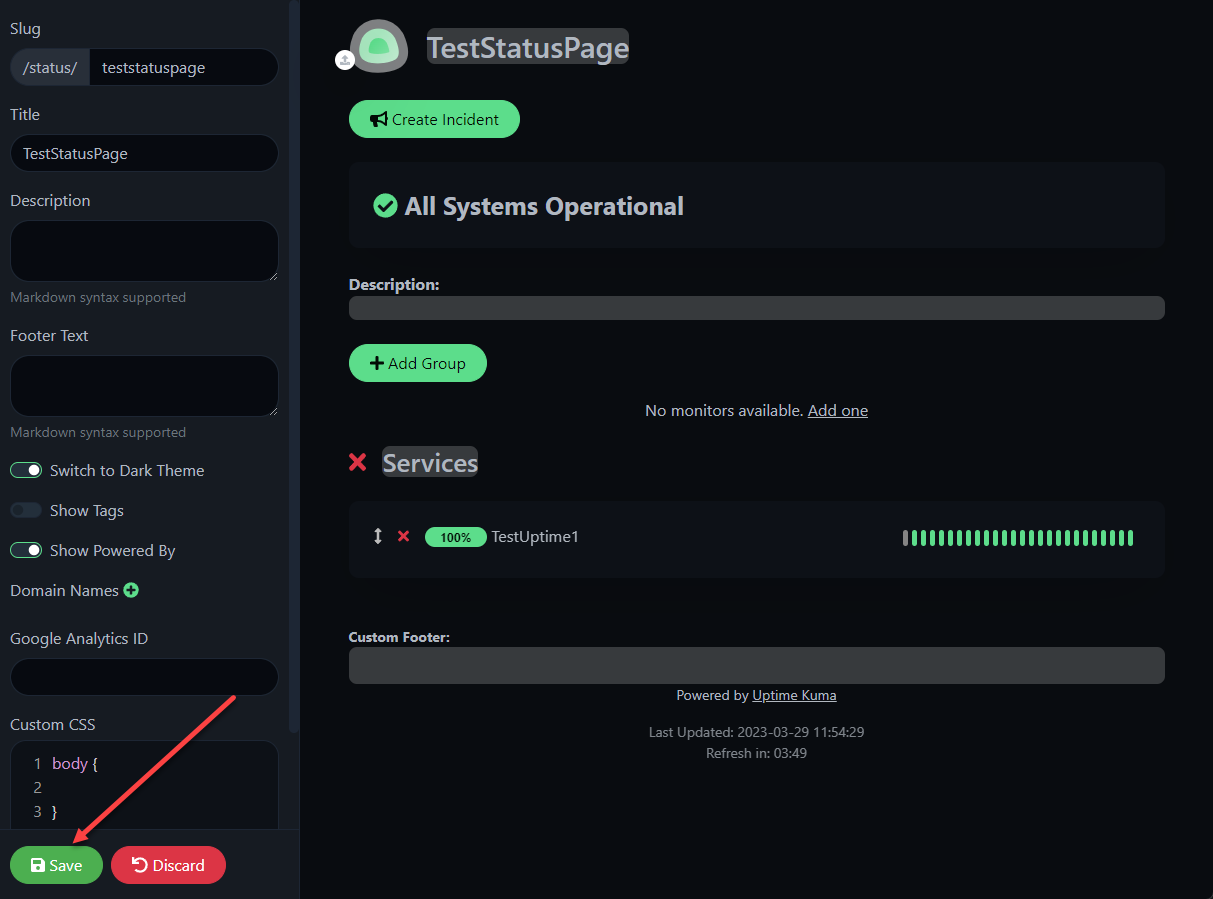
When you think about this next layer, a container can be running fine and using normal resources without any other failures, and your service could go down. This might be due to proxy misconfigurations, DNS issues, certificate problems, or some other dependency being down. Uptime Kuma will help you catch these kinds of failures.
There are a wide range of checks you can do with it as well. You can do things like checking HTTP applications and web ports, TCP ports of various numbers, and even keyword validation. For example, I can check HTTP and validate certain response codes come back or I have specific content in the response body.
Uptime Kuma lets you know that something that a user or yourself may depend on is currently “down” and not working. In contrast, platform monitoring and alerts might be early warnings of problems or performance issues, but the service may still be available.
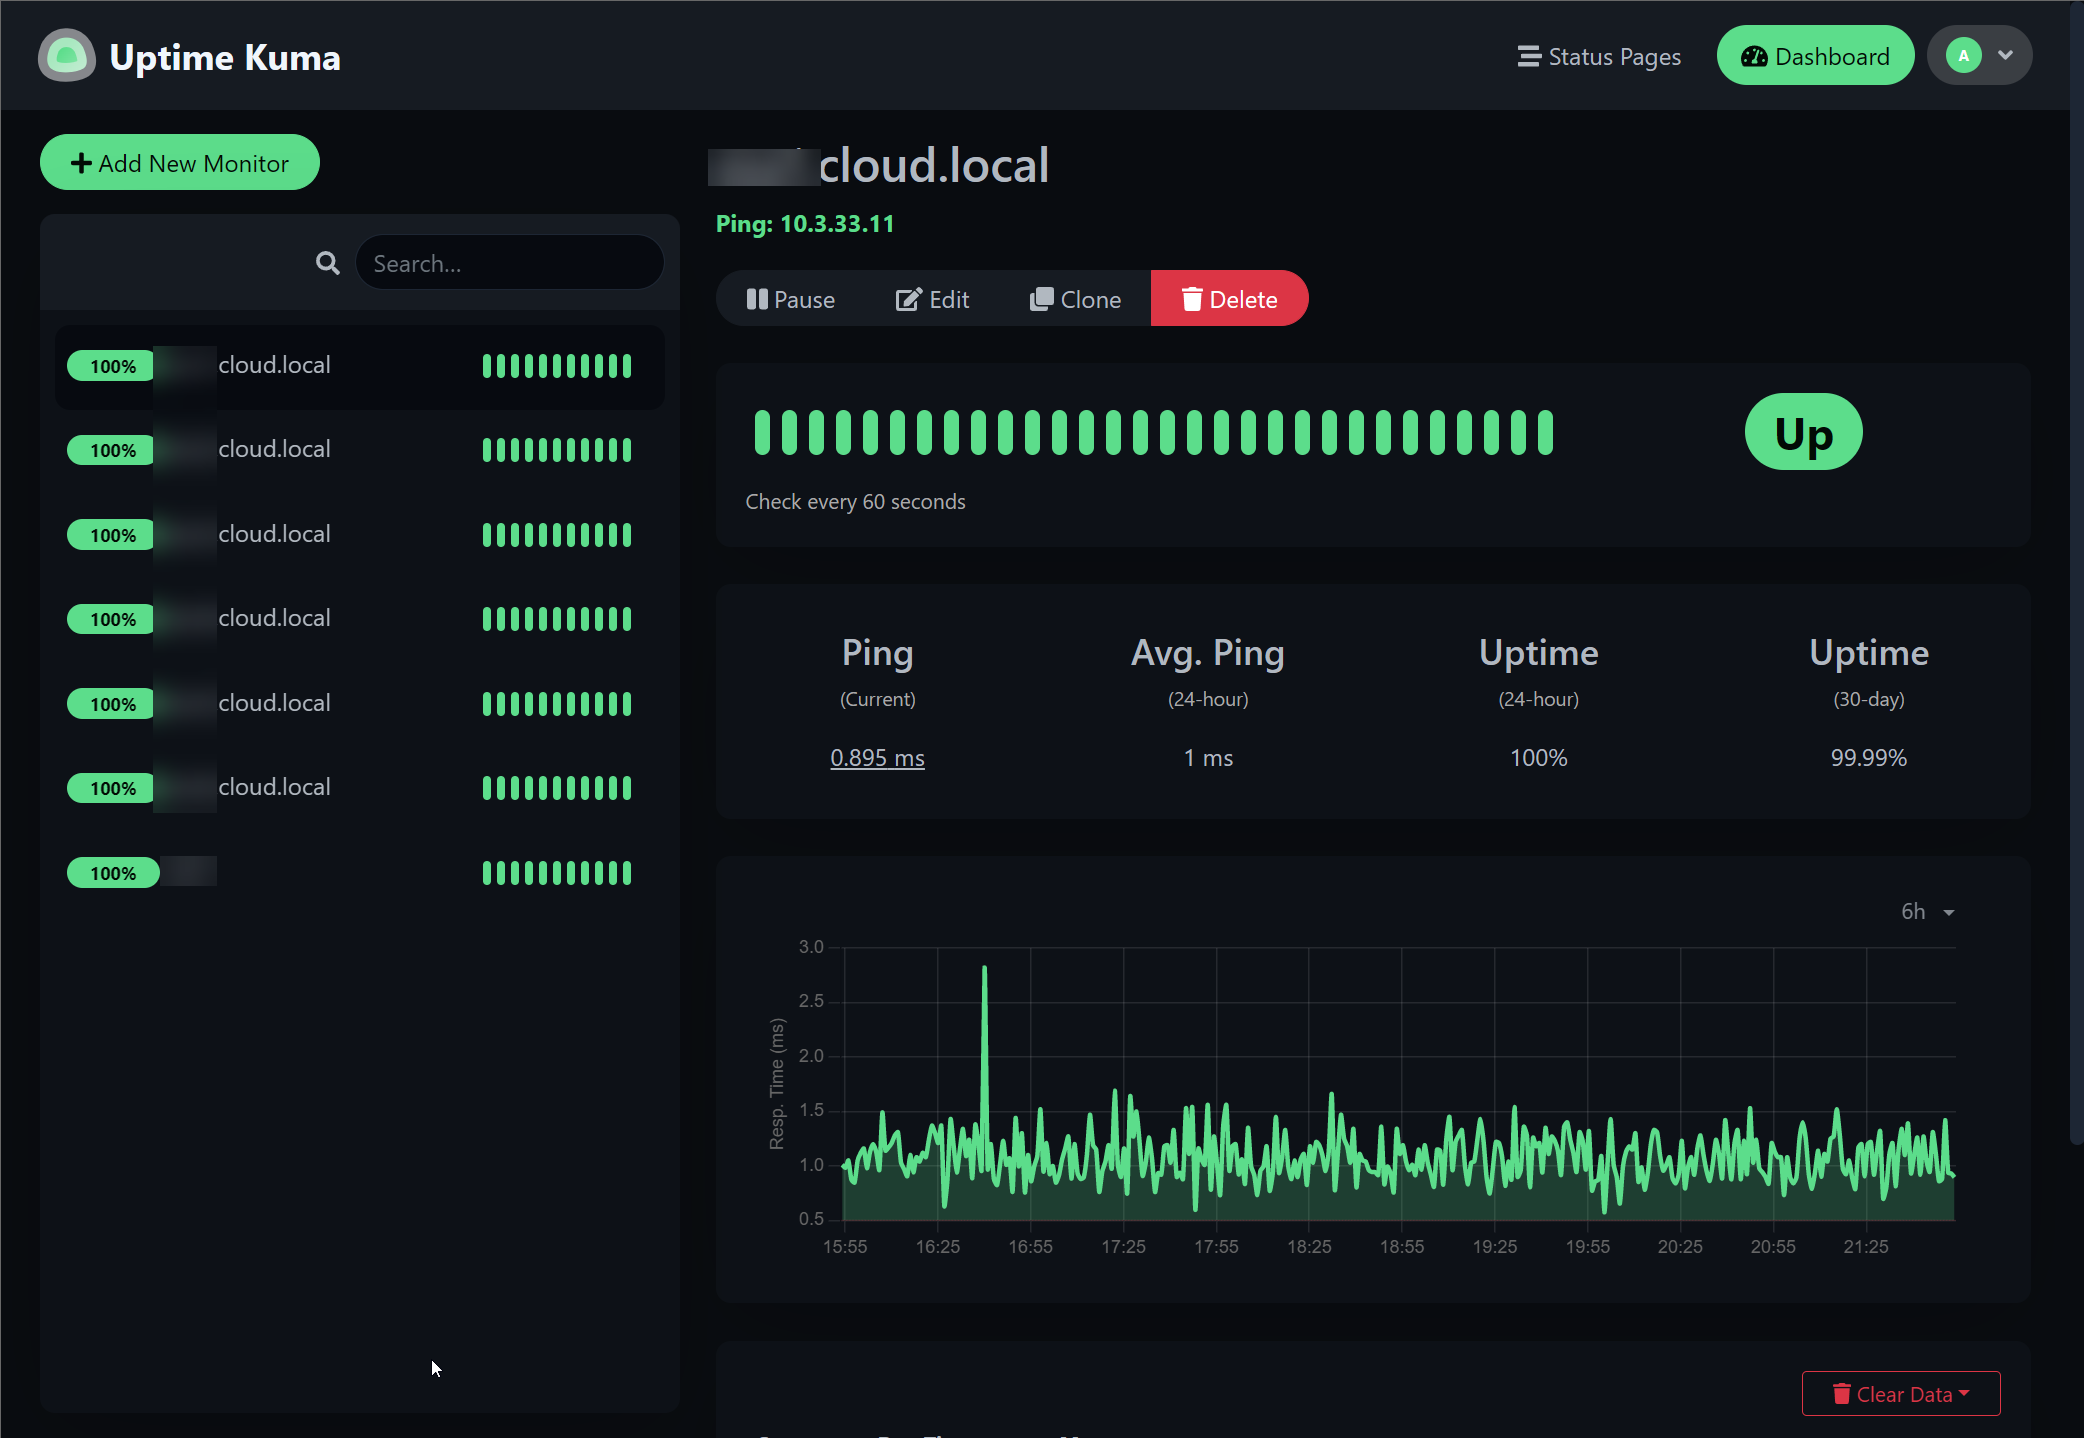
Uptime Kuma is my go to tool that helps me to know if the application or service I am self-hosting is reachable and the application is working as expected, regardless of whether or not the platform is ok and resources are within the range of what is normal.
See my dedicated post on Uptime Kuma here: Uptime Kuma Self-hosted application and server monitoring.
LoggiFly tells me what is going on inside the container
When I discovered and tested LoggiFly, I knew it was something special as it allowed me to see and be alerted to things happening inside my container logs that I would have otherwise missed completely. And, it honestly helped to round out my container monitoring. It is really the piece that I have been missing in my lab environment.

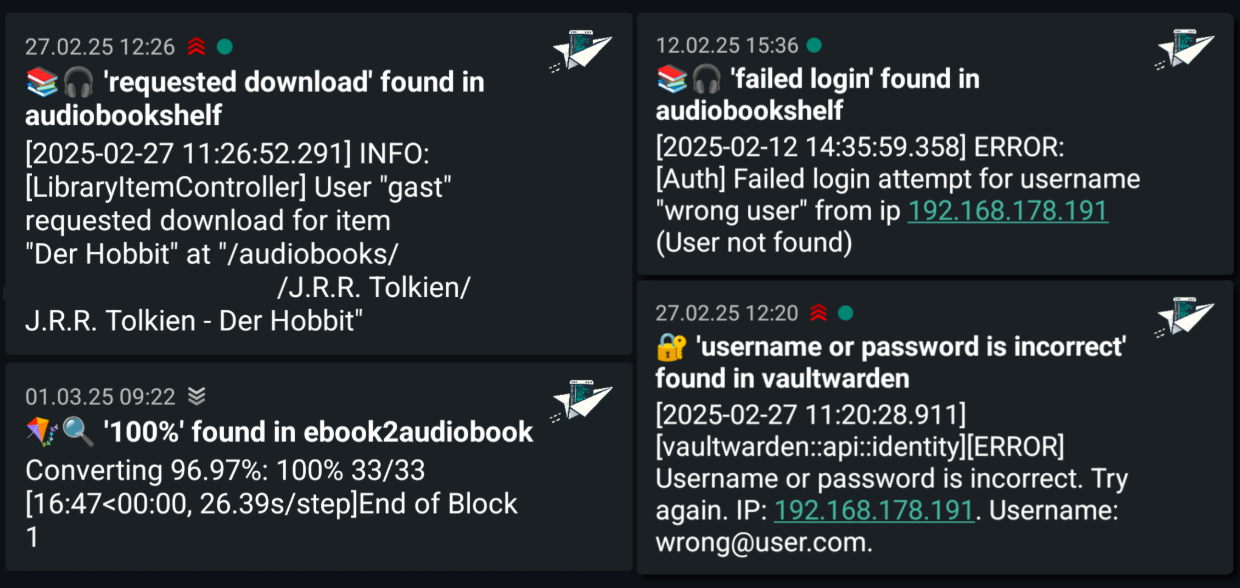
Docker logs are where you will likely find the earliest evidence that something is not right. But, it is one fo the places that you check “after” your service is down and you want to start troubleshooting. However, LoggiFly helps to turn container logs into a proactive resource where you can get proactively alerted when certain keywords appear in your Docker logs. You can trigger an alert on keywords like “error”, “failed”, “connection refused”, and so on.
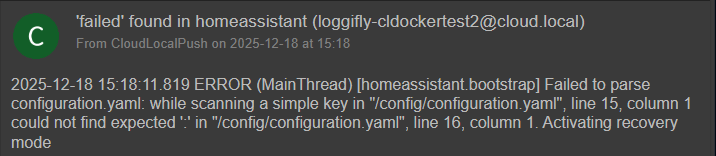
So, instead of me scanning the logs of my Docker container hosts manually, I now configure LoggiFly to watch for specific keywords and patterns inside those container logs. When those keywords appear in the logs, I get notified immediately.
I had an event just a few days back that helps to illustrate this in action. One of my Technititum containers ran out of memory. This was due to some arbitrary resource limits I was playing around with the other day. But, instead of having to troubleshoot why DNS wasn’t working on this specific segment of my network, LoggiFly sent me an alert before things stopped working saying that the container was “out of memory”.
What I appreciate most about LoggiFly is that it stays focused. It does not try to be a full log aggregation platform. It is designed to answer a simple but powerful question: did something happen inside this container that I should know about right now?
I think LoggiFly makes a perfect complement to what Uptime Kuma does. By the time an uptime alert kicks off from Uptime Kuma, LoggiFly has already been alerting me to errors that are happening.
See my dedicated post on LoggiFly here: LoggiFly Is the Docker Log Alerting Tool I Didn’t Know I Needed.
Why this approach works with home labs of all sizes
These Docker container monitoring tools scale as your lab grows. Even as you add more and more containers, or more hosts, the model and the tools stay the same.
- Pulse continues to cover the platform
- Uptime Kuma grows with your services
- LoggiFly focuses on the containers that matter most
You do not need to redesign your monitoring every time your lab evolves. You can just add checks and patterns/keywords as needed. Keep in mind too, not every container needs deep log monitoring. Not every service needs external uptime checks. So, you can prioritize your lab services that actually matter.
Wrapping up
I am getting more and more satisfied with the level of Docker container monitoring I am able to do in the home lab. With great community tools and projects, I have been able to take my docker container monitoring to the next level this year and get visibility that I haven’t had before. This has helped me go from being reactive learning that things are down to proactive, knowing there is something going on before I really see the effects in the lab. For me, there isn’t a single tool that makes this possible but the three tools I have covered in this post: Pulse, Uptime Kuma, and LoggiFly. What about you? What is currently in your Docker container monitoring stack? Let me know in the comments.
Google is updating how articles are shown. Don’t miss our leading home lab and tech content, written by humans, by setting Virtualization Howto as a preferred source.
About The Author

Brandon, you are my most favorite author for home labbing. Thank you for your contributions! This article is nice too. It would be great to mention what other options are there for non-docker environments, as some services of every home labber will be running directly on VMs.
And of course, Happy New Year 2026!
Jan,
Thank you so much for your kind words! Really appreciate that and your support. Great feedback as well. Take care and looking forward to what this year holds!
Brandon