Feb 11, 2026 11:09 am
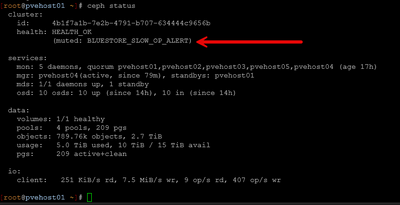
I have been working a ton with Ceph lately in the home lab. Just some notes on how to check if you have a Ceph disk that is showing to have slow disk. You can see your Ceph health with the command:
ceph status

or

ceph -s
Step 1: Identify the Problem OSD
# Check overall cluster health
ceph status
# Get detailed health information (shows which OSD has issues)
ceph health detail
```
**Example output:**
```
[WRN] BLUESTORE_SLOW_OP_ALERT: 1 OSD(s) experiencing slow operations in BlueStore
osd.6 observed slow operation indications in BlueStore
Note the OSD number (in this case: osd.6)
Step 2: Locate the OSD's Host
# Find which physical host contains the OSD
ceph osd find <osd-number>
# Example:
ceph osd find 6
Example output:
json
{
"osd": 6,
"addrs": {
"addrvec": [
{
"type": "v1",
"addr": "10.3.33.204:6804",
"nonce": 1234
}
]
},
"osd_fsid": "900daf28-d681-4637-90db-9764bcfd2f11",
"host": "pvehost04",
"crush_location": {
"host": "pvehost04",
"root": "default"
}
}
Note the hostname (in this case: pvehost04)
Step 3: Connect to the Host
# SSH to the host containing the problematic OSD
ssh root@pvehost04
Step 4: Identify the Physical Disk
# Find the OSD's logical volume
ceph-volume lvm list | grep -A 10 "osd.<number>"
# Example:
ceph-volume lvm list | grep -A 10 "osd.6"
```
**Example output:**
```
====== osd.6 =======
[block] /dev/ceph-46ed1f42-7685-4bfd-b64f-ad525bddc935/osd-block-900daf28...
block device /dev/ceph-46ed1f42-7685-4bfd-b64f-ad525bddc935/osd-block-900daf28...
block uuid f94nrL-KRDg-D648-Ia7B-F3Yx-hjwQ-HppqAT
Note the VG name (in this case: ceph-46ed1f42-7685-4bfd-b64f-ad525bddc935)
Find the underlying physical disk:
# Show the complete disk hierarchy
lsblk -o NAME,SIZE,TYPE,MOUNTPOINT,FSTYPE
# Or find the physical volume for the VG
pvs | grep <vg-name>
# Example:
pvs | grep ceph-46ed1f42-7685-4bfd-b64f-ad525bddc935
```
**Example output:**
```
/dev/nvme1n1 ceph-46ed1f42-7685-4bfd-b64f-ad525bddc935 lvm2 a-- <953.87g
Note the physical device (in this case: /dev/nvme1n1)
Step 5: Check Disk Health
For NVMe Drives:
# Install nvme-cli if not present
apt install nvme-cli -y
# Check SMART health summary
nvme smart-log /dev/nvme1n1
# Or using smartctl
smartctl -a /dev/nvme1n1
# Check for errors
nvme error-log /dev/nvme1n1
For SATA/SAS Drives:
# Install smartmontools if not present
apt install smartmontools -y
# Quick health check
smartctl -H /dev/sdX
# Full SMART information
smartctl -a /dev/sdX
# Check for specific error indicators
smartctl -a /dev/sdX | grep -E "Reallocated|Pending|Current_Pending|Offline_Uncorrectable|UDMA_CRC_Error"
Step 6: Interpret Health Results
Critical Values to Check:
For NVMe:
-
critical_warning: Should be 0 (anything else is bad)
-
temperature: Should be < 70°C (< 158°F)
-
available_spare: Should be > 10%
-
percentage_used: Wear indicator (100% = end of life)
-
media_errors: Should be 0
-
error log entries: Review for I/O errors
For SATA/SAS:
-
SMART overall-health: Should be PASSED
-
Reallocated_Sector_Ct: Should be 0 (or very low)
-
Current_Pending_Sector: Should be 0
-
Offline_Uncorrectable: Should be 0
-
UDMA_CRC_Error_Count: High values indicate cable/connection issues
-
Temperature: Should be < 55°C
Step 7: Check OSD Performance Metrics
# From any Ceph node, check OSD performance
ceph osd perf
# Check OSD utilization
ceph osd df
# Check for current slow operations (run on the OSD's host)
ceph daemon osd.<number> dump_ops_in_flight
# Check historic slow operations (run on the OSD's host)
ceph daemon osd.<number> dump_historic_slow_ops
Step 8: Monitor I/O Performance (Optional)
# Install sysstat if not present
apt install sysstat -y
# Monitor real-time I/O stats (watch for high await times or %util)
iostat -x <device> 2 5
# Example for NVMe:
iostat -x nvme1n1 2 5
# Example for SATA:
iostat -x sda 2 5
Key metrics to watch:
%util: > 90% consistently = saturated disk
await: > 10ms = slow responses
r_await / w_await: Read/write latency separately
Step 9: Check System Logs
# Check for disk-related errors in dmesg
dmesg -T | grep -i "<device>" | tail -50
# Example:
dmesg -T | grep -i nvme1n1 | tail -50
# Check systemd journal for Ceph or disk issues
journalctl -u ceph-osd@<number> --since "1 hour ago"
# Example:
journalctl -u ceph-osd@6 --since "1 hour ago"
Step 10: Common Issues and Resolutions
Issue: Slow Operations During Rebalancing
Cause: Normal during data migration
Solution: Wait for rebalancing to complete or mute the warning:
ceph health mute BLUESTORE_SLOW_OP_ALERT --sticky
Issue: High Media Errors or Reallocated Sectors
Cause: Failing disk
Solution: Replace the disk:
# Mark OSD out (triggers data migration)
ceph osd out <osd-number>
# Monitor rebalancing
watch ceph -s
# Once complete, remove OSD
ceph osd down <osd-number>
ceph osd rm <osd-number>
ceph auth del osd.<osd-number>
ceph osd crush rm osd.<osd-number>
Issue: High Temperature
Cause: Poor cooling or failing fan
Solution: Improve airflow, check datacenter HVAC
Issue: Disk Full
Cause: Imbalanced data distribution
Solution: Check weight and rebalance:
ceph osd df tree
ceph osd reweight <osd-number> <weight>
Quick Reference Checklist
# 1. Identify problem OSD
ceph health detail
# 2. Find host
ceph osd find <osd-number>
# 3. SSH to host
ssh <hostname>
# 4. Find physical disk
lsblk -o NAME,SIZE,TYPE,MOUNTPOINT,FSTYPE
# 5. Check health (NVMe)
nvme smart-log /dev/<device>
# 5. Check health (SATA)
smartctl -a /dev/<device>
# 6. Check OSD performance
ceph osd perf
ceph daemon osd.<number> dump_historic_slow_ops
# 7. Monitor I/O
iostat -x <device> 2 5
# 8. Check logs
journalctl -u ceph-osd@<number> --since "1 hour ago"


