There is always a set of tools that most of us become familiar with and rely on when it comes to different types of operating systems or platforms. I am finding myself increasingly using Linux for most things in my home lab as my platform of choice. It powers my Docker server hosts, Kubernetes nodes, and now hypervisors with Proxmox being my main workhorse in the home lab. There is a set of tools that I have come to rely on when installing a Linux server. In this post, we will talk through seven things that I always insall on a new Linux server in my home lab. These tools help with system monitoring, disk management, security, automation, and much more. Let’s dive in.
htop for real-time system monitoring
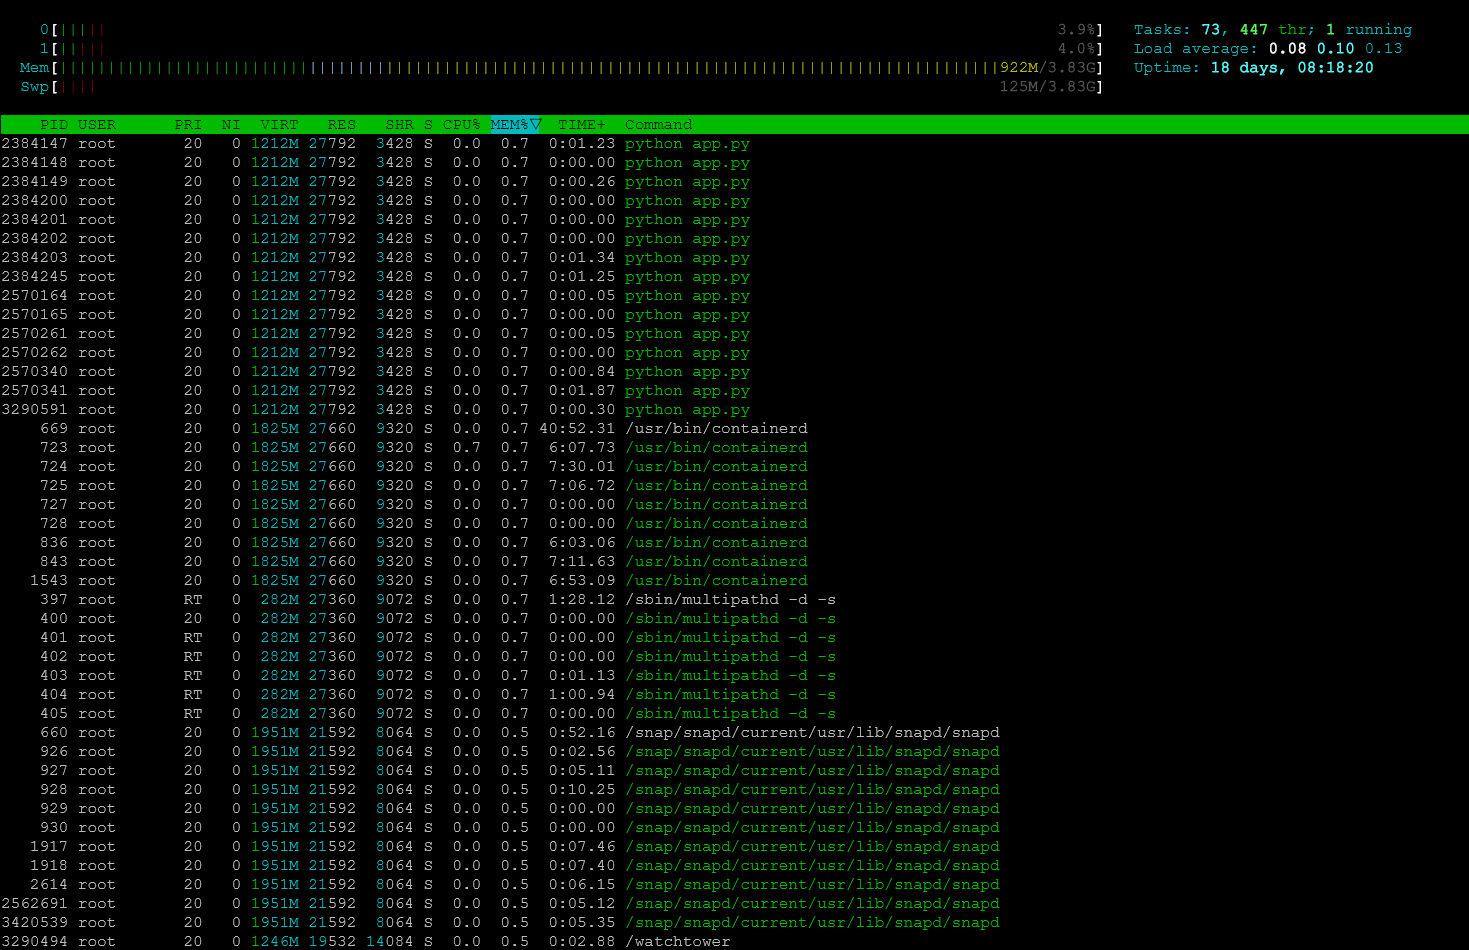
One of the first tools I install on any Linux system is htop. It is a powerful interactive system monitoring tool that gives you a real-time view of lot of important information at your fingertips. Things like CPU usage, memory consumption, running processes, and system load are all easy to see using htop.
Most Linux distributions include the classic top command, but htop is even easier to read and navigate. If you don’t have it installed alreayd, you can install it with the following in Debian/Ubuntu:
sudo apt install htopOnce installed, you can launch it simply by running:
htopYou will immediately see a visual dashboard showing CPU cores, memory usage, swap usage, and active processes.
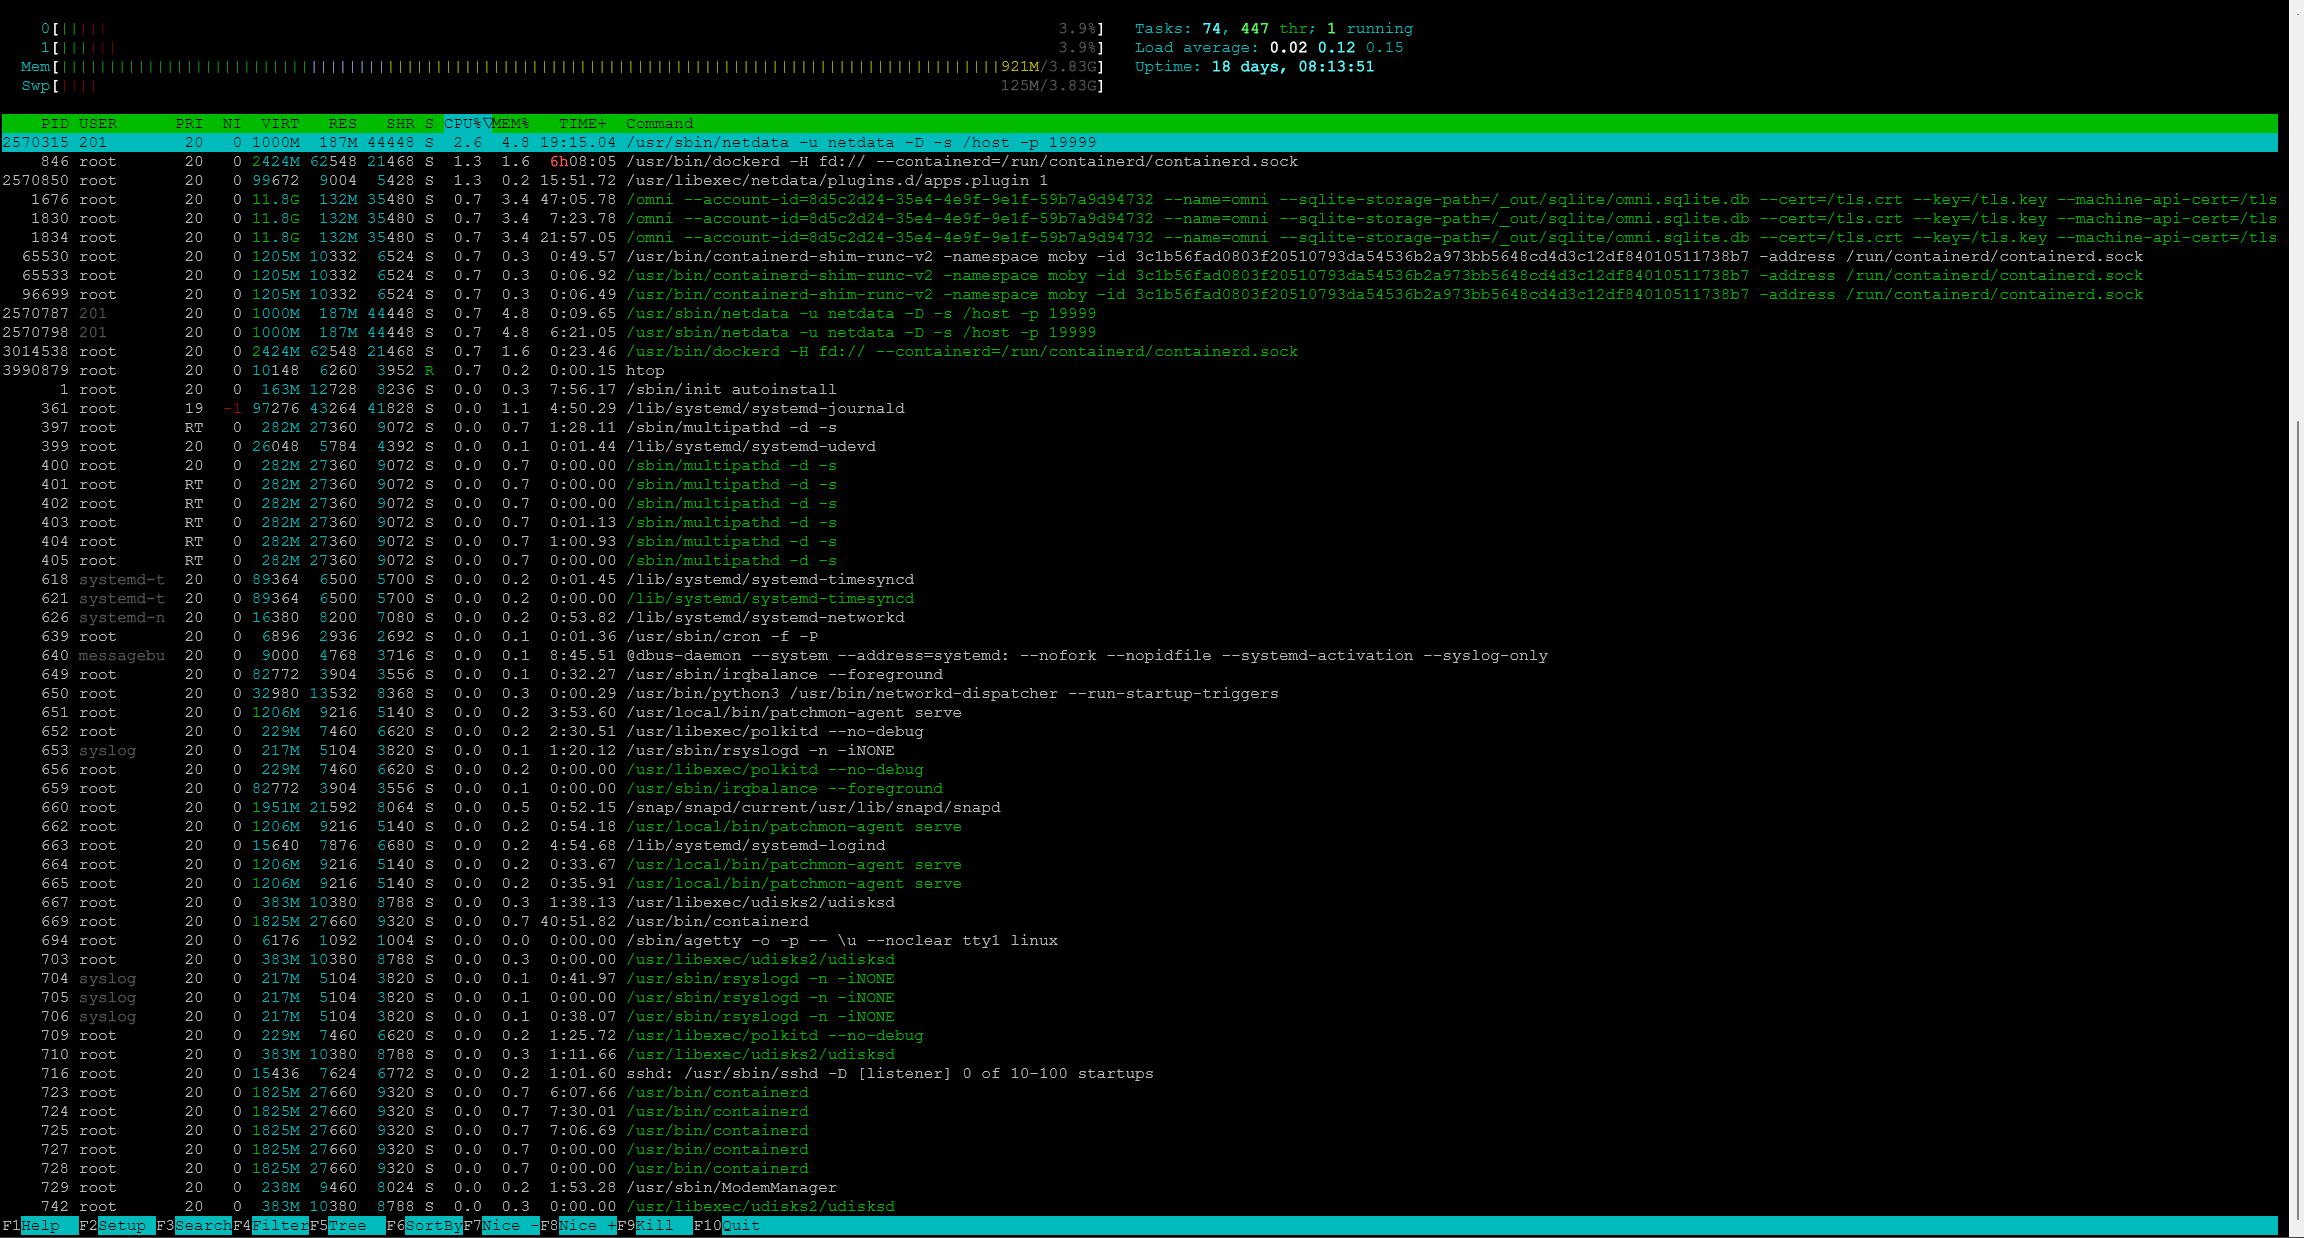
One of the most useful features of htop is that you can sort processes by resource usage. I like that you have easy button presses to do certain things. You can press F6 to select a sorting column such as CPU or memory.
For example, if a server suddenly becomes slow, I can quickly run htop and see whether a process is taking excessive CPU or memory.
You can also:
- search for processes with F3
- kill processes with F9
- filter processes by user or name which is cool
In a home lab environment where multiple services might be running on the same node, htop gives you the ability to have instant visibility into what the system is doing.
ncdu for disk usage analysis
One of the other areas of a Linux server that you want to have the right tools for is the disk subsystem and specifically storage space. Disk usage problems are common in a home lab, especially when we are trying to do more with less. Log files grow larger than expected, container images can accumulate over time. Also, backups can fill up storage very quickly.
My goto tool of choice is ncdu. It stands for NCurses Disk Usage. You can install it with:
sudo apt install ncdu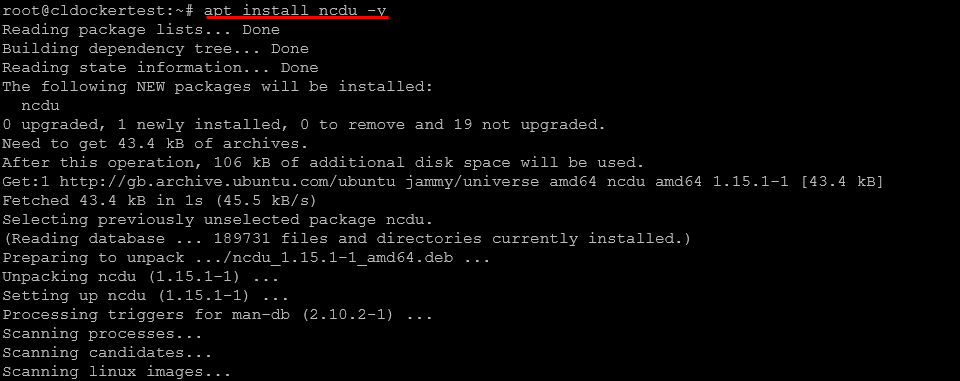
To analyze disk usage on the root filesystem:
sudo ncdu /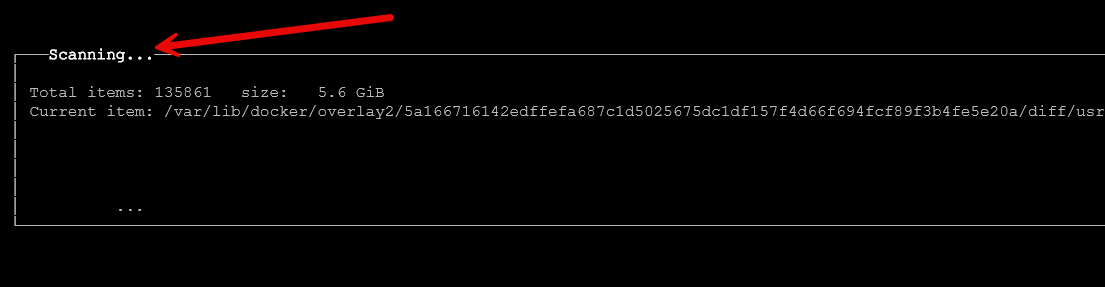
The tool scans the filesystem in a terminal GUI and presents an interactive interface showing which directories are consuming the most space. You can then use the arrow keys and enter to drill into different directories if you want.
For example, if I suspect a Docker host is running out of disk space, I might run:
sudo ncdu /var/lib/docker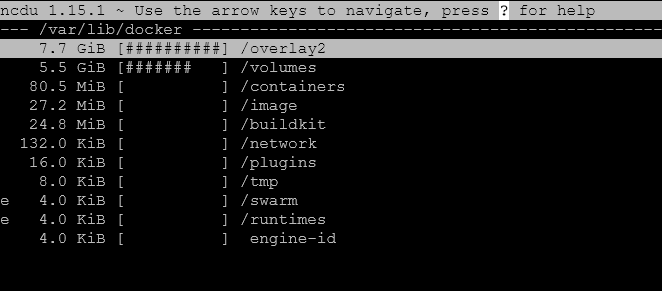
This allows me to quickly see which images, volumes, or layers are taking up storage.
You can navigate through directories using the arrow keys and drill down into folders to locate large files. Press d to delete files directly from the interface if you want to do your cleanup within the tool.
Compared to using the traditional du command manually, ncdu makes identifying disk usage problems much easier and faster.
UFW for basic firewall protection
Security is important even in a home lab environment. While many home lab networks sit behind a router or firewall, you can still bolster this further with host level firewall rules. Keep in mind that a router/firewall only protects your resources from routed traffic, not line of sight traffic on the same VLAN. So, you can microsegment your network with host firewalls by preventing specific hosts on the same subnet from being able to communicate with your server.
One of the easiest ways to do this on Linux is with UFW, which stands for Uncomplicated Firewall.
You can install it with:
sudo apt install ufwOnce installed, you can enable the firewall with:
sudo ufw enableBefore enabling it, you should allow SSH access so you do not accidentally lock yourself out of the server.
sudo ufw allow sshYou can also allow specific ports for services such as web servers:
sudo ufw allow 80
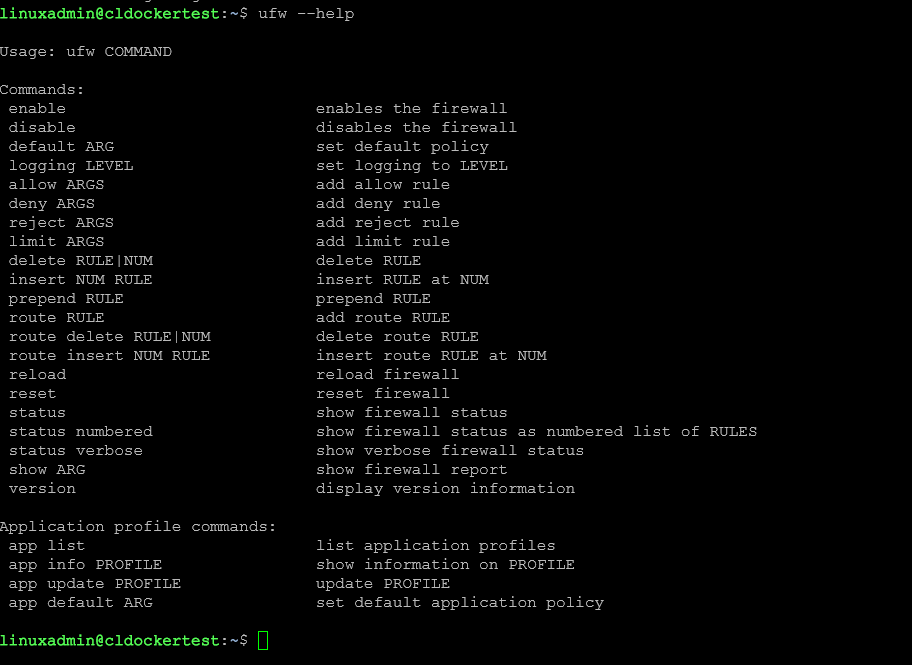
sudo ufw allow 443To view current firewall rules:
sudo ufw statusI like UFW because it provides a simple way to limit which services are accessible on your server and it isn’t super complicated (hence the name). Even basic rules like allowing only SSH and necessary application ports can majorly reduce the attack surface on a server.
For home lab servers that may occasionally be exposed through reverse proxies or VPN connections, having host level firewall protection is a smart extra set of configuration.
Fail2Ban for basic intrusion protection
Another security tool I frequently install is Fail2Ban. This tool monitors log files and automatically blocks IP addresses that show malicious behavior such as repeated failed login attempts. This is one that I even install on my Proxmox hosts.
Install it with:
sudo apt install fail2banAfter installation, the service will start automatically. Fail2Ban works by watching log files and applying firewall rules when suspicious activity occurs. For example, if someone repeatedly attempts to brute force SSH credentials, Fail2Ban can block that IP address automatically.
After you get it installed, you can check the status of the service with:
sudo systemctl status fail2ban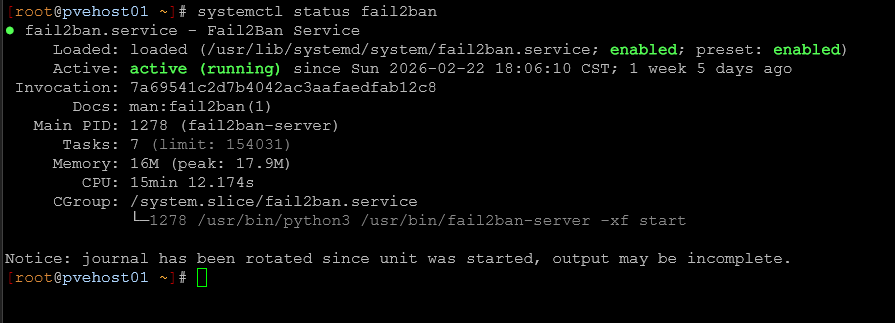
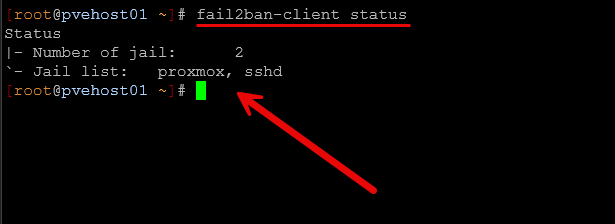
To see active jails and blocked IP addresses:
sudo fail2ban-client statusIn the below, this is on a Proxmox host that I have. You can see the jails of SSH and then the “proxmox” jail is the web UI that is protected.
The SSH jail is usually enabled by default, but you can customize settings using configuration files located in:
/etc/fail2ban/For home labs that expose SSH or web services to the internet through VPNs or reverse proxies, Fail2Ban provides an additional layer of protection.
unattended-upgrades for automatic security updates
One of the best things you can do for the security and stability of your Linux servers is to keep them up to date with patches and security updates. It is easy to forget to patch your servers when you have to do this manually. This is especially true when you have multiple servers. This is why I install unattended-upgrades on nearly every Linux server.
You can install it with:
sudo apt install unattended-upgradesIf you want to see the options available, you can pass in the –help parameter:
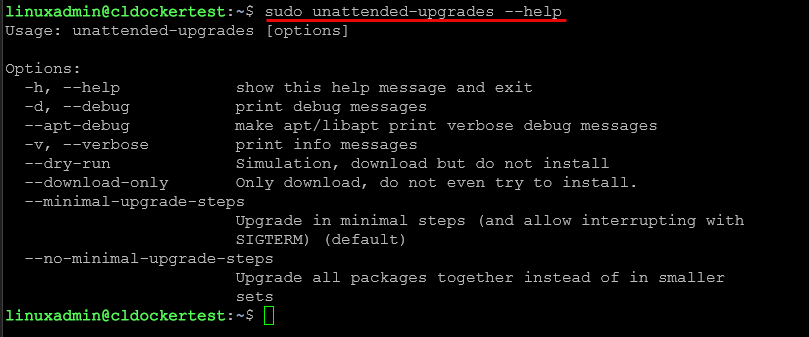
Then enable automatic updates:
sudo dpkg-reconfigure unattended-upgradesYou can verify configuration files located here:
/etc/apt/apt.conf.d/The key configuration file with all the options you will want to configure is located at:
/etc/apt/apt.conf.d/50unattended-upgradesThere are lots of great customizable configuration options in this file like the following:
//Unattended-Upgrade::MailReport "on-change";

// Remove unused automatically installed kernel-related packages
// (kernel images, kernel headers and kernel version locked tools).
//Unattended-Upgrade::Remove-Unused-Kernel-Packages "true";

// Do automatic removal of newly unused dependencies after the upgrade
//Unattended-Upgrade::Remove-New-Unused-Dependencies "true";

// Do automatic removal of unused packages after the upgrade
// (equivalent to apt-get autoremove)
//Unattended-Upgrade::Remove-Unused-Dependencies "false";

// Automatically reboot *WITHOUT CONFIRMATION* if
//  the file /var/run/reboot-required is found after the upgrade
//Unattended-Upgrade::Automatic-Reboot "false";

// Automatically reboot even if there are users currently logged in
// when Unattended-Upgrade::Automatic-Reboot is set to true
//Unattended-Upgrade::Automatic-Reboot-WithUsers "true";

// If automatic reboot is enabled and needed, reboot at the specific
// time instead of immediately
//  Default: "now"
//Unattended-Upgrade::Automatic-Reboot-Time "02:00";
With automatic updates enabled, critical security patches are applied to your Linux server automatically. Again, this helps to reduce the risk of vulnerabilities on long running systems. For home lab environments where servers may run continuously for months, this automation helps to make sure your systems stay updated and secure.
Docker for running applications
Containers have become a major part of most home lab environments. I run most of my services and apps today using Docker. In fact, I would say that most of the Linux server hosts that I have running in the home lab are for running containers, either as Docker hosts or using Kubernetes. It makes deploying these so drop-dead simple and easy. And, it has the side benefit of supporting all things DevOps since they are lightweight and small.
You can install Docker with the simple command:
sudo apt install docker.ioStart the service:
sudo systemctl enable docker
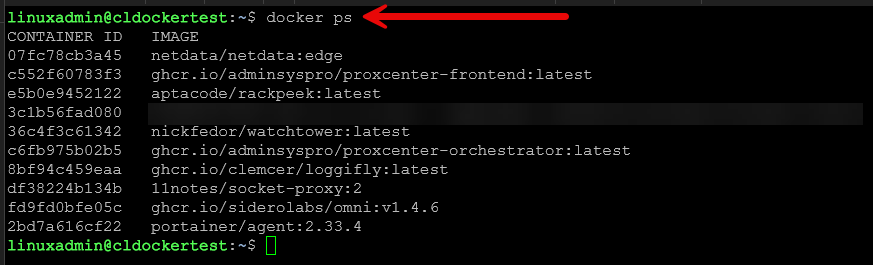
sudo systemctl start dockerYou can test your installation on your Linux server with:
sudo docker run hello-worldAlso, when it comes to home lab environments, most home lab services are distributed as Docker containers and this makes it so easy to try new things. You can find containers for most all types of apps, including:
- monitoring platforms
- dashboards
- automation tools
- development environments
- databases
- media services
For example, if you want to deploy a container like Nginx, you can do that with the command:
sudo docker run -d -p 8080:80 nginxThis launches a web server in just a couple of seconds.
Netdata for monitoring
One of my favorite tools right now for quick and easy monitoring is Netdata. They offer a $90 home lab license, or you can just run the community edition for free. I personally think the home lab license is a great deal.
Netdata makes it where monitoring is super easy and you don’t have to stand up a bunch of your own self-hosted infrastructure just to get good monitoring across your home lab environment. It provides real-time monitoring with almost no configuration.
Netdata has really good metrics out of the box for:
- CPU usage
- memory usage
- disk activity
- network traffic
- processes
- system load
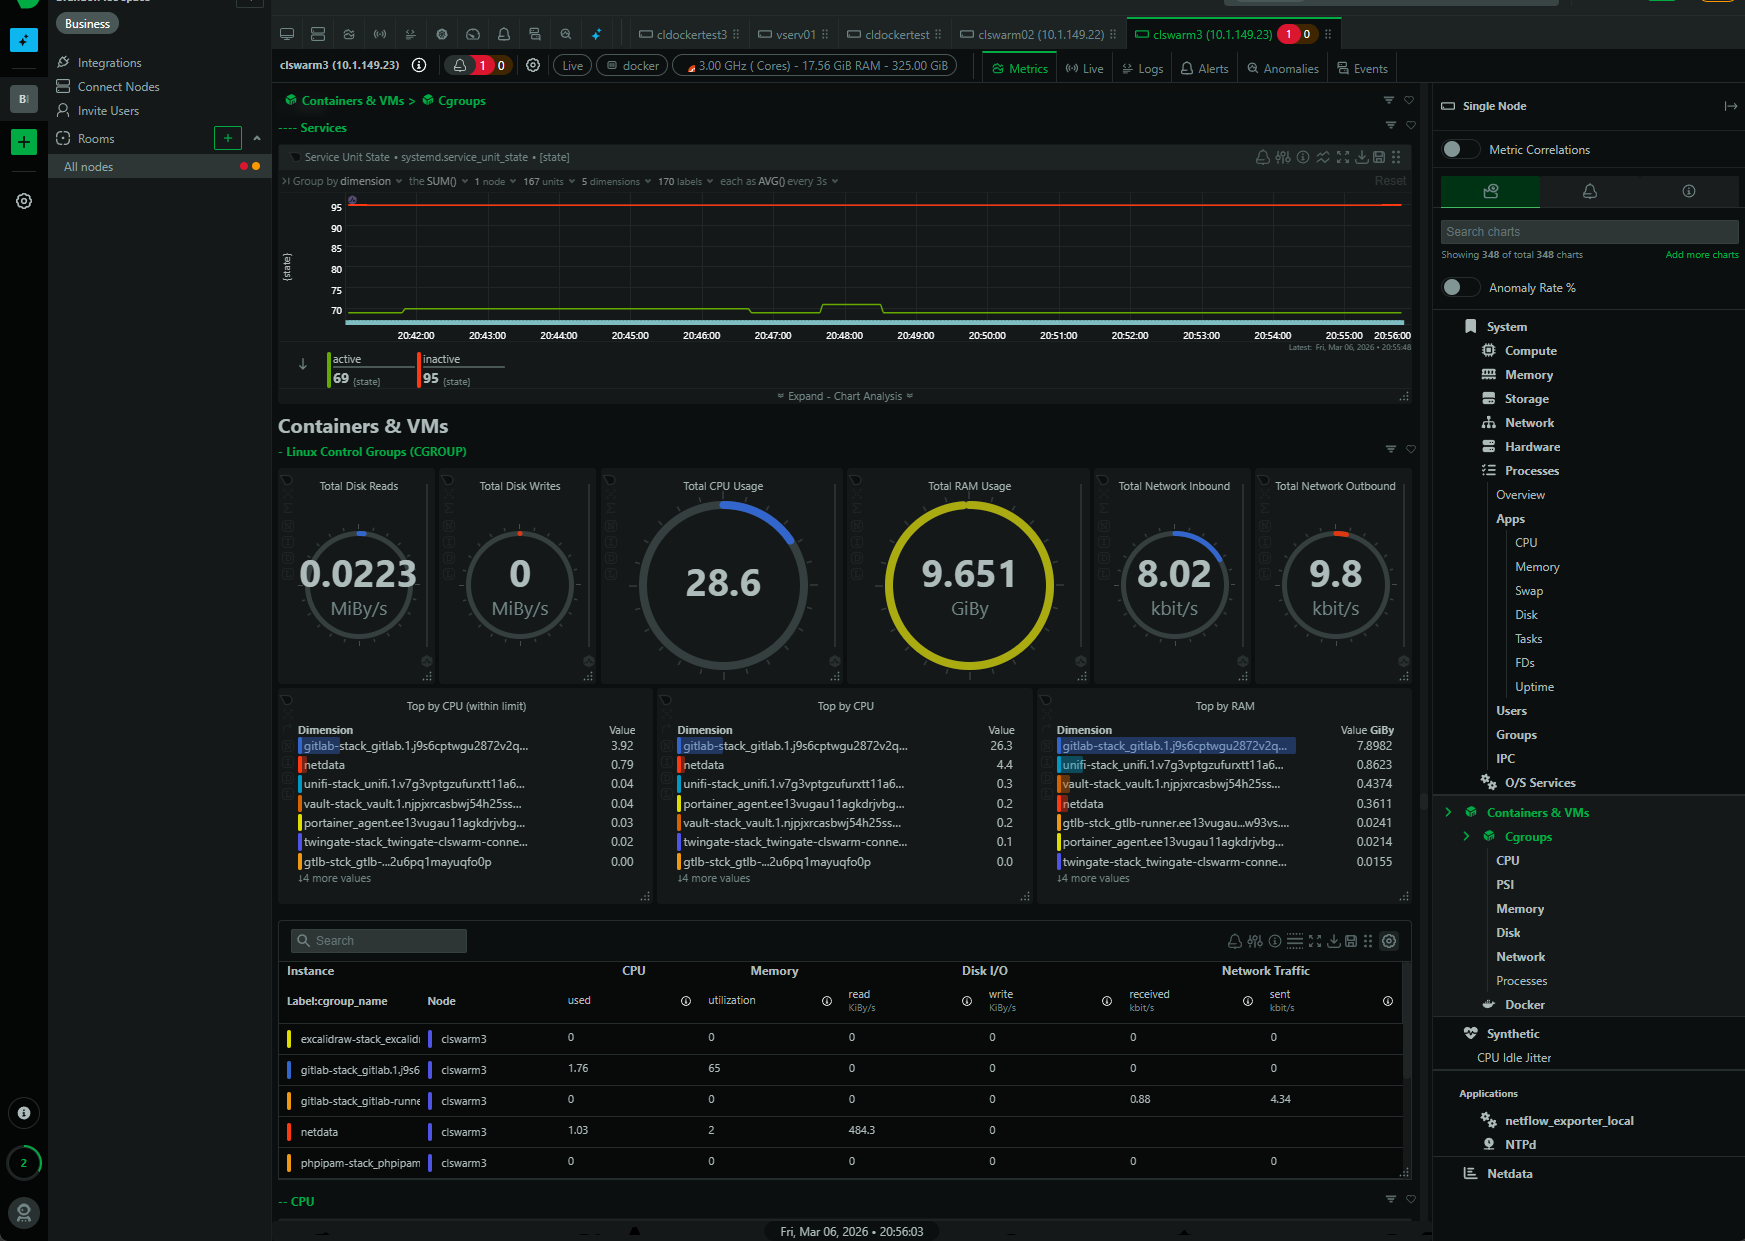
Also, one of the things I really like about it is that it has some of the best container monitoring for no configuration of any solution you can stand up. You get granular views of your containers and VMs, cgroups, CPU, PSI, Memory, Disk, Network, processes, etc.
To install Netdata using their automated script:
bash <(curl -Ss https://my-netdata.io/kickstart.sh)Once installed, you can access the web interface on port 19999.
For example:
http://your-server-ip:19999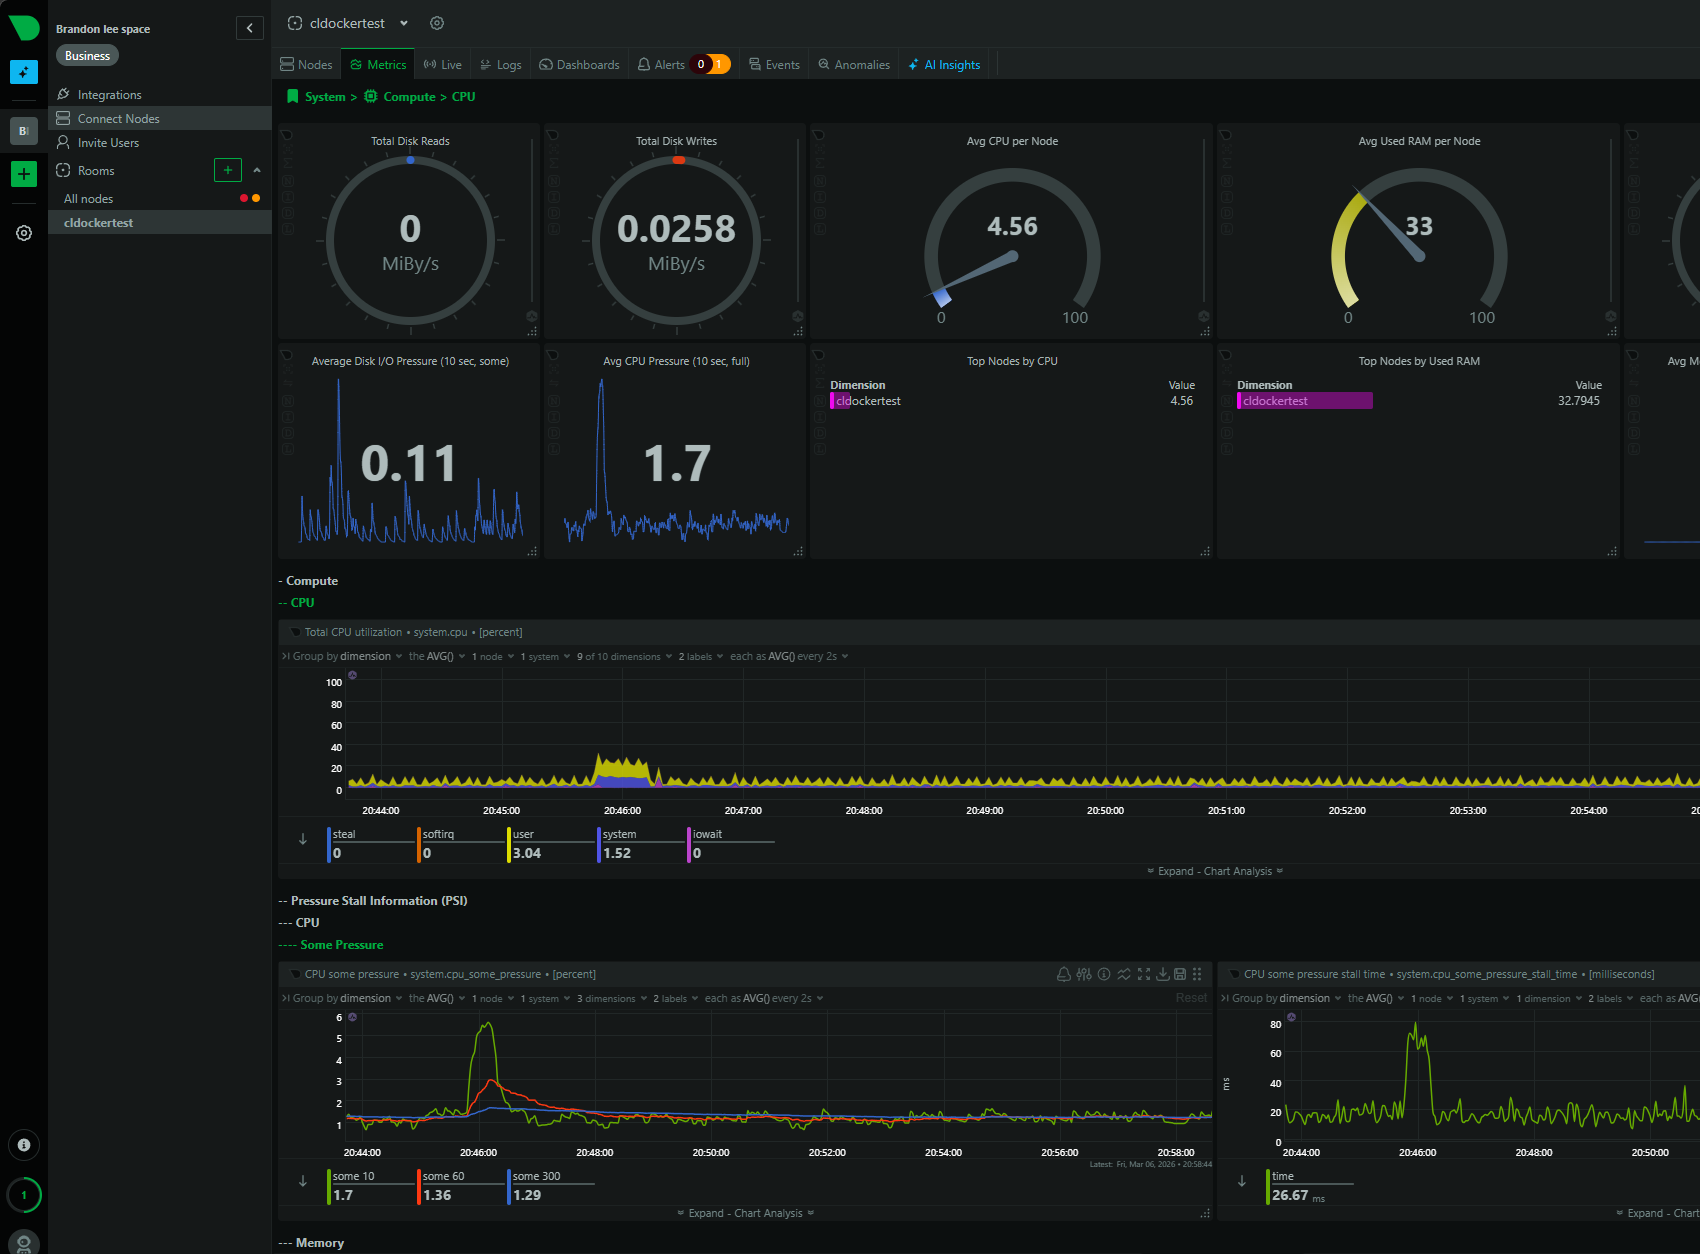
The dashboard provides extremely detailed real-time metrics with interactive graphs. Netdata is especially useful when you need something to diagnose performance issues in the home lab because it shows exactly what is happening on the system at any given moment. In my home lab I deploy Netdata on new servers immediately, especially Docker hosts, so I can see system behavior and resource metrics.
Wrapping up
When setting up a new Linux server in my home lab, I like to have a consistent baseline environment with the right tools to keep a pulse on things. Installing a core set of Linux server tools makes sure that I have the visibility I need on various aspects of the system. The htop tool helps identify resource issues very quickly, ncdu makes disk space viewing simple, ufw and fail2ban improve server security, unattended-upgrades keeps patches applied, docker is how I run all of my apps these days, and then monitoring things with netdata is super easy. With just a few commands you can turn your Linux server into a much easier environment to keep an eye on and manage. How about you? What tools do you install on a new Linux server?
Google is updating how articles are shown. Don’t miss our leading home lab and tech content, written by humans, by setting Virtualization Howto as a preferred source.
About The Author