As you know if you have read my blog posts over the course of the past several months, I have been writing a lot about home lab documentation. Keeping things documented is one of those “hate to do it” type things, but you absolutely thank and love yourself later for doing it when you need it. Having easy ways to do this makes sure that we are more willing to create documentation and get it done. I ran across a very cool project that flips documentation I think on its head and provides us with a tool that allows creating documentation in the form of code. Now, we are familiar with Docker compose and Kubernetes YAML files being this way, but not so much information about our servers, racks, software, operating systems, etc. It approaches rack documentation the same way we approach infrastructure as code and this definitely clicked with me.
The problem with traditional home lab documentation
Most of us either start creating our home lab documentation with one of the following:
- A Google Sheet
- A markdown file in a random folder
- A diagram exported from some drag-and-drop tool
The problem is not so much the tool but these just don’t scale very well with modern home labs. In my lab, I am running multiple Proxmox nodes, Ceph storage, 10 gig networking, VLANs, container hosts, Kubernetes clusters, and many different mini PCs. These get swapped out, upgraded, and rebuilt constantly. I recently moved my Proxmox boot drive, rebuilt a few of my Proxmox nodes, and re-cabled some of my rack. I introduced a mini rack which is now becoming my main cluster rack.
Static documentation is hard to keep up with those kinds of changes. Even worse, most of the time, it isn’t version controlled, so you can’t really see what changed. If I make a change today, and something breaks tomorrow, I don’t really have an easy way to see what I introduced in my change documentation unless I manually track revisions.
What Is RackPeek?
As I mentioned before, I think this will click with ones who are looking for a way to document their home labs as code. Instead of drawing lines in a GUI, this allows you to keep up with your most important components by defining things like:
- Racks
- Devices
- Positions
- Metadata
- Labels
RackPeek lets you do this all inside structured YAML files. Then it renders a visual representation of your rack based on that configuration. So, the beauty of this, like infrastructure as code, your rack documentation and home lab documentation becomes text. Then, your text lives in Git.
This gives you the benefit of the following:
- Version control
- Pull requests
- Change history
- Collaboration
- Easily revert changes
This is documentation that behaves like your Terraform code or Docker Compose files.
Why I think this fits the modern home lab
If you have followed my content for any length of time, you know I am big on organizing everything into folders and structured configuration, and using git repos. For instance, in my home lab, I like to structure things this way:
- Each Docker service gets its own directory
- Each Compose file is version-controlled
- Each Proxmox configuration backup gets archived
RackPeek fits right into that mindset and my ecosystem in the home lab. So instead of producing nice looking diagrams which I find fun to create, but VERY difficult to maintain, the documentation as simple text is much easier to maintain.
Instead of getting something like a PNG file like rack-diagram-final-v3.png, you now have a simple config.yaml where everything lives. Then, you can take this file and add this to your Git repository. You commit changes every time you add hardware or move equipment around, or even upgrade things.
Then you can make this file live in your Git repository. You commit changes every time you add hardware or move equipment. Then you can add very intuitive commit messaging around your changes like:
Upgraded from a 1 TB NVMe drive to a 2 TB drive.” This way, your changes are traceable and make sense as you are trying to build a timeline of changes for your documentation.
Installing RackPeek
There are a few ways you can get up and running with RackPeek in your home lab, including a Linux installation. However, I think most will want to opt for deploying it in Docker since it is super easy and straightforward.
Here is my Docker Compose code that I have used in my home lab:
services:
rackpeek:
image: aptacode/rackpeek:latest
container_name: rackpeek
ports:
- "8080:8080"
volumes:
- /home/linuxadmin/homelabservices/rackpeek:/app/config
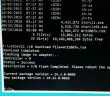
restart: unless-stoppedI did run into an issue with permissions. The container came up fine, but when I tried to start entering information I receive the following error which was permissions related.
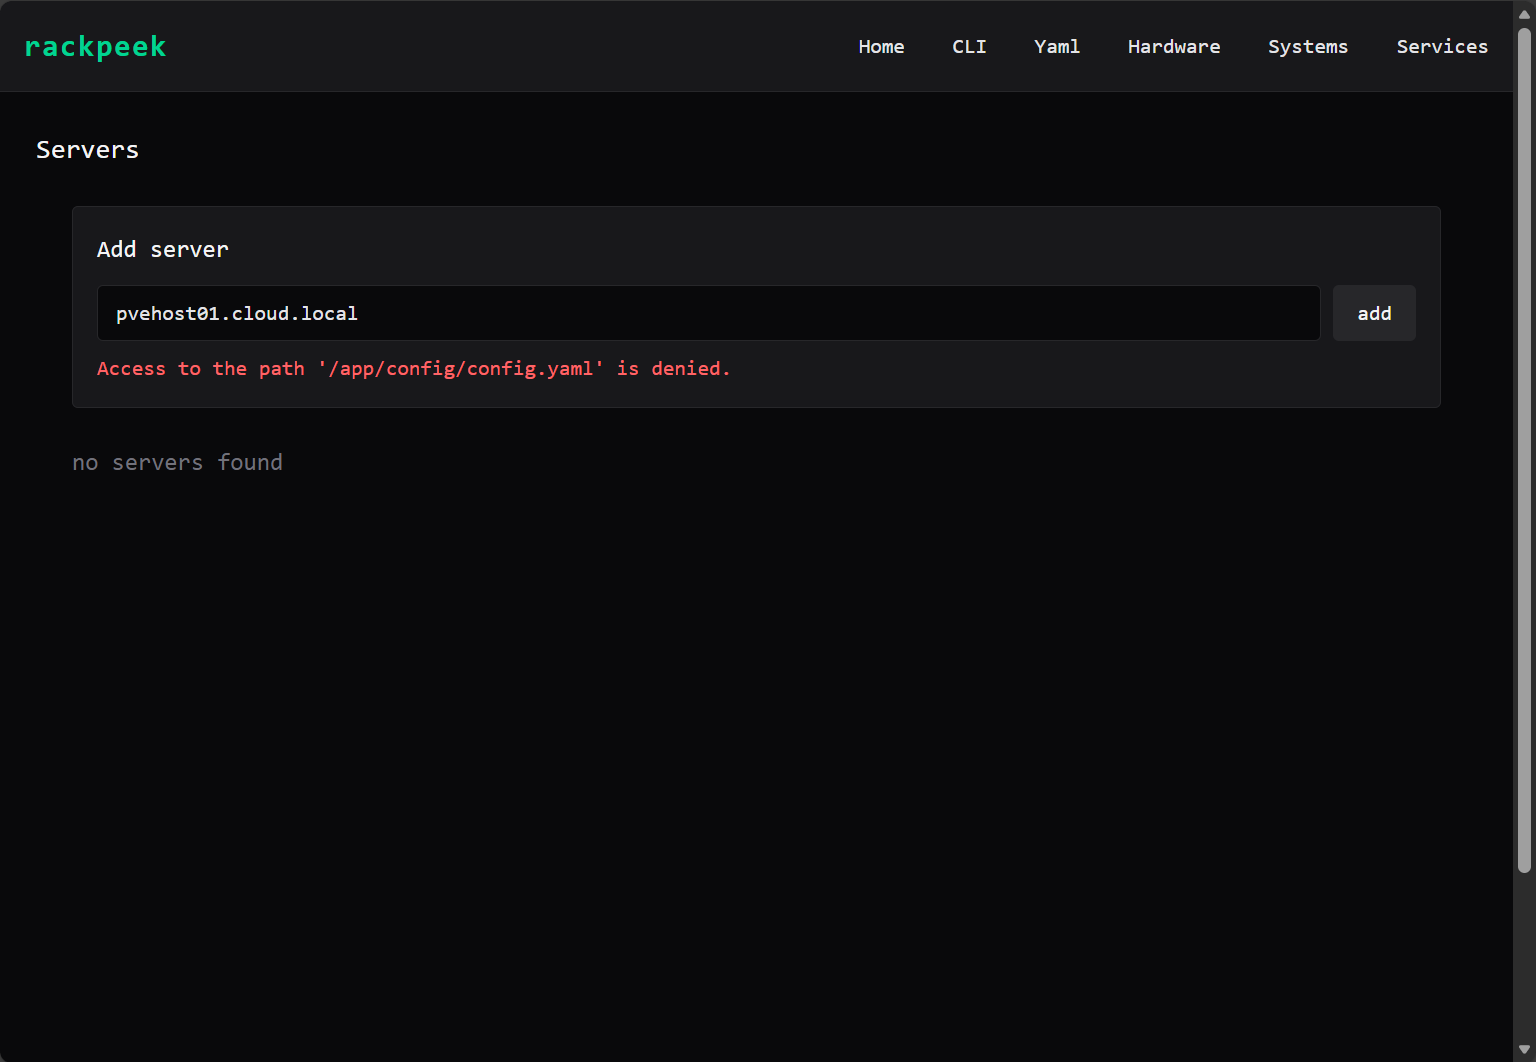
Exec’ing into the container and running a quick “id” command, I found the app is running under the following user 1654. So, I chown’ed the directory that I was using for the bind mount.
sudo chown -R 1654:1654 /home/linuxadmin/homelabservices/rackpeek/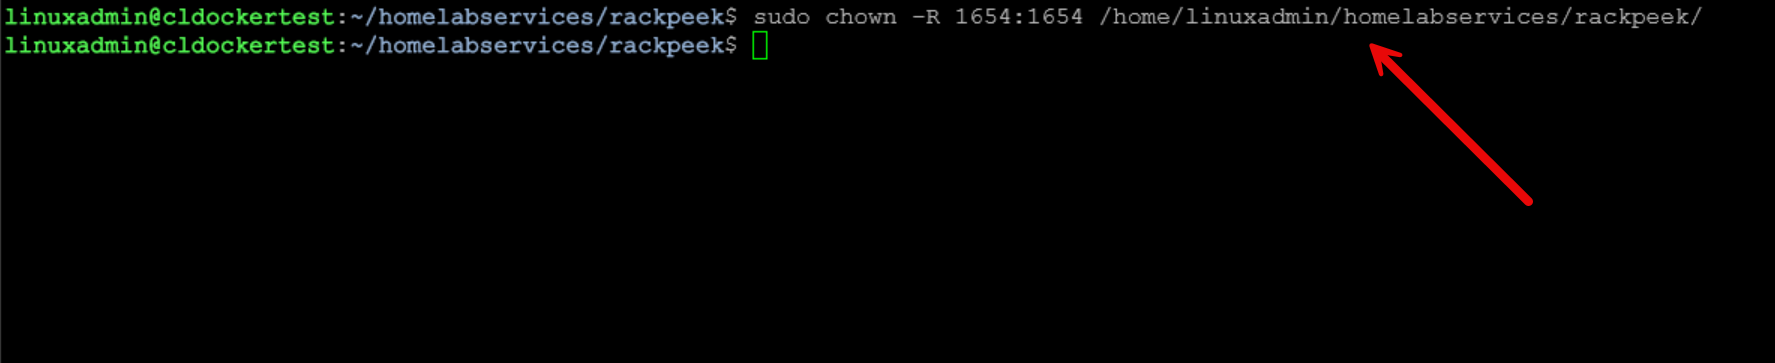
After this the permissions issue was solved. If you do this on the frontend though, you won’t have any issues when using a bind mount.
Then, you just have to run the normal command to bring up the Docker stack:
docker compose up -d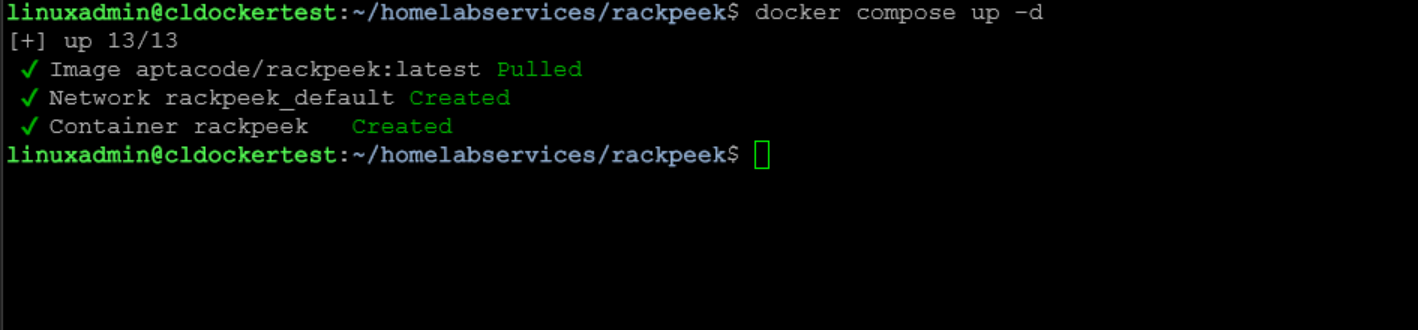
Then, you just access the container by browsing to your Docker container host port 8080.
Adding information into RackPeek
Adding information into RackPeek is super easy. So there is both a GUI method to adding information and a totally CLI method you can use. I can see that both are extremely useful and may work better depending on what you are doing when you are in RackPeek.
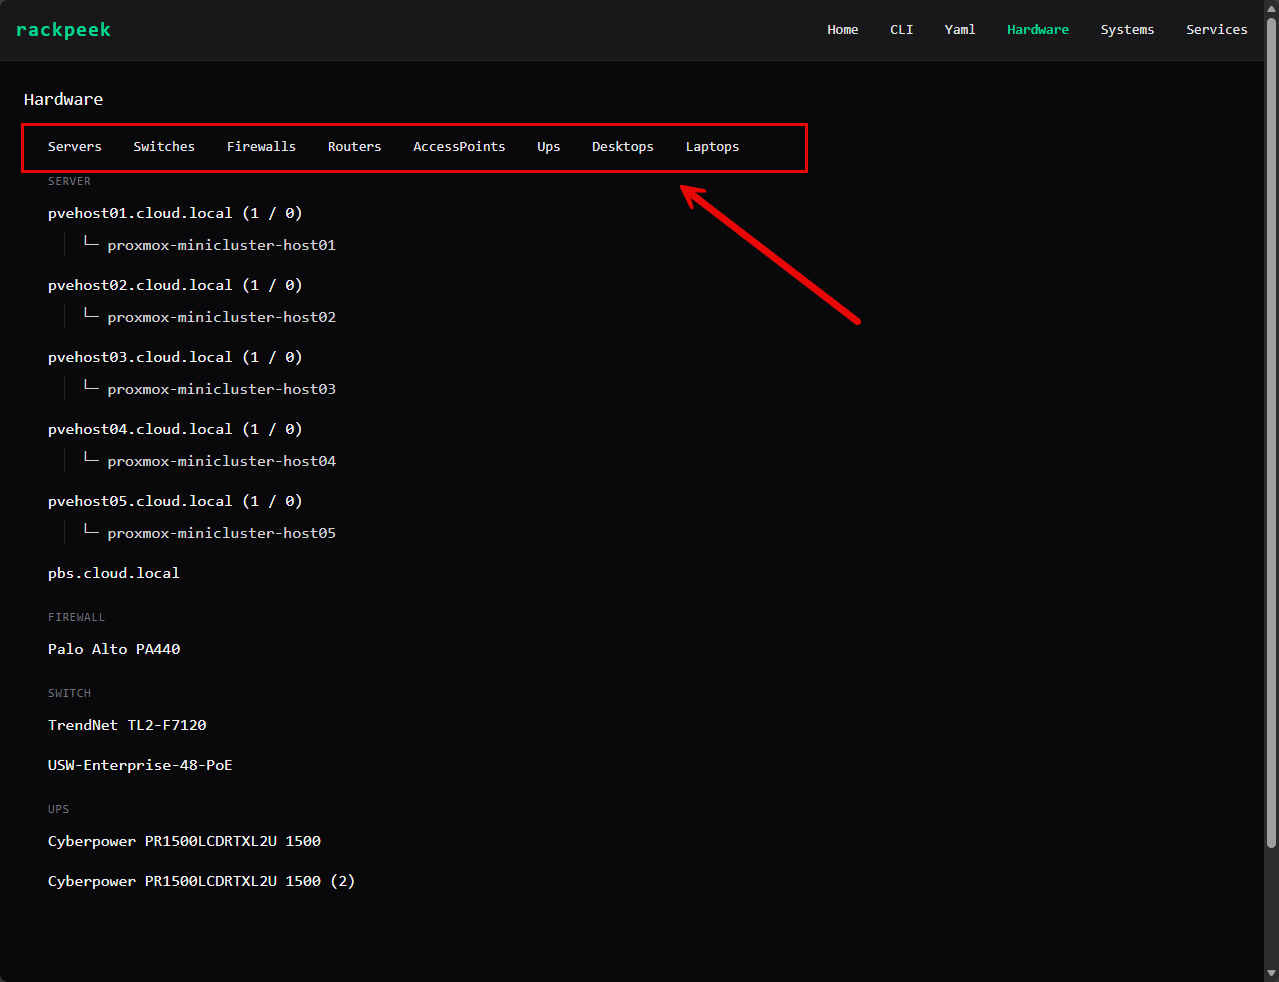
In the GUI, when you click on Hardware, you can see that you have the ability to add things like servers, switches, firewalls, routers, access points, UPS’s, desktops, laptops, etc.
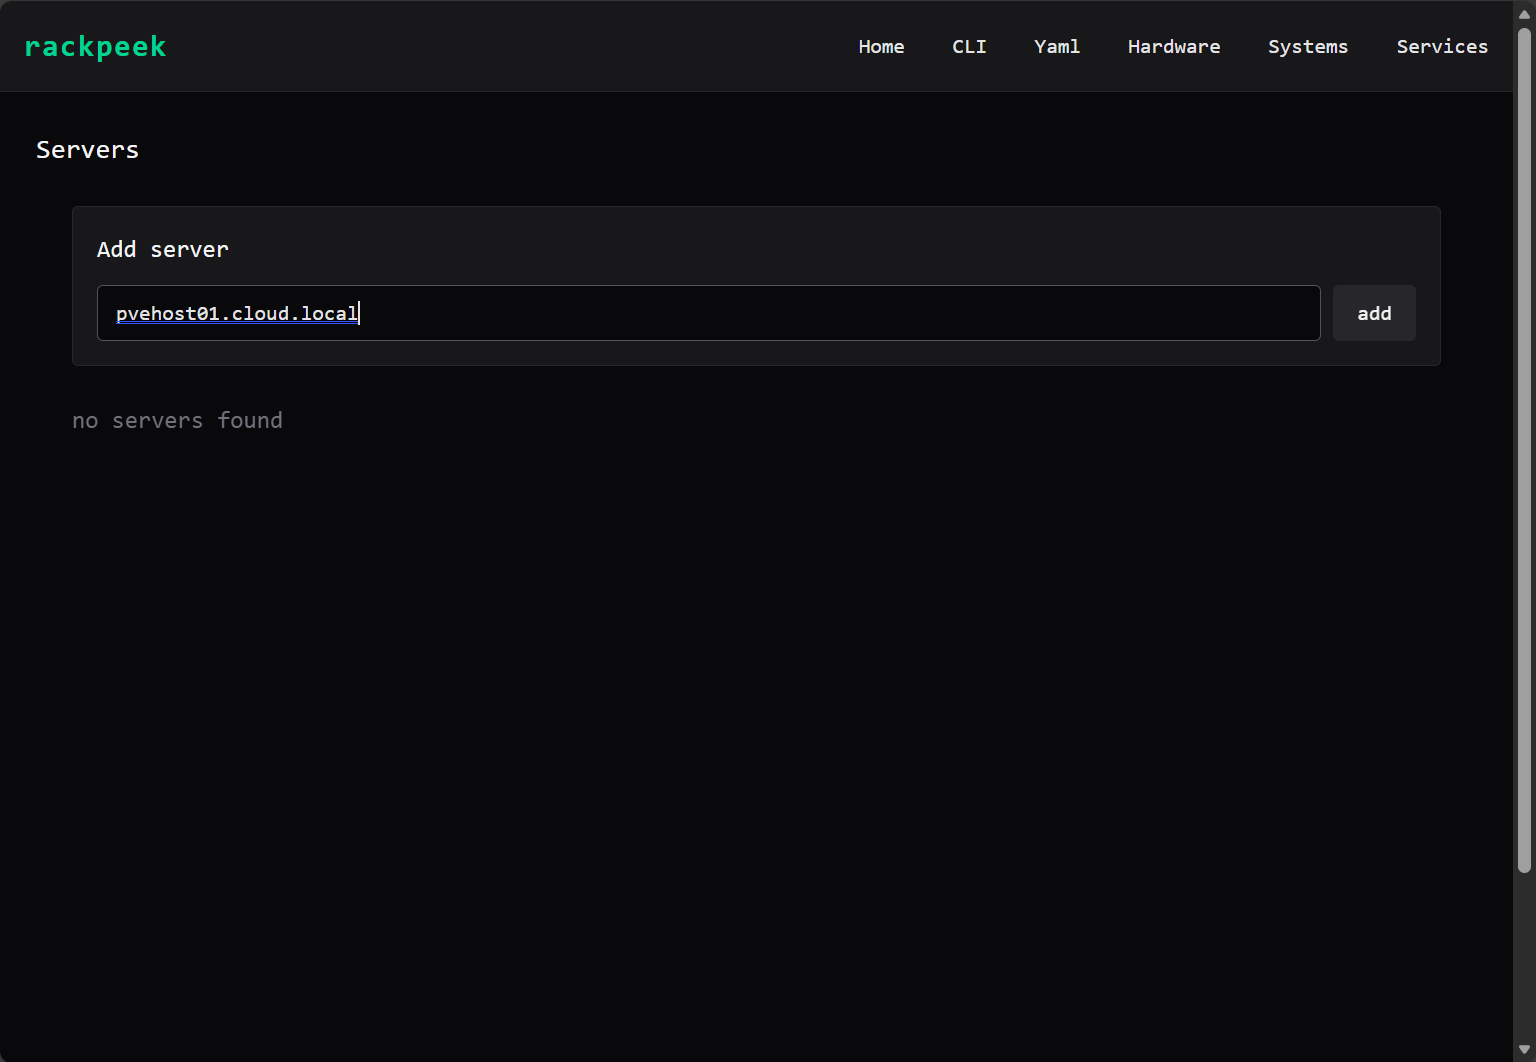
Below is what the input box looks like when you add a server. It gives you a simple input field to put in the name.
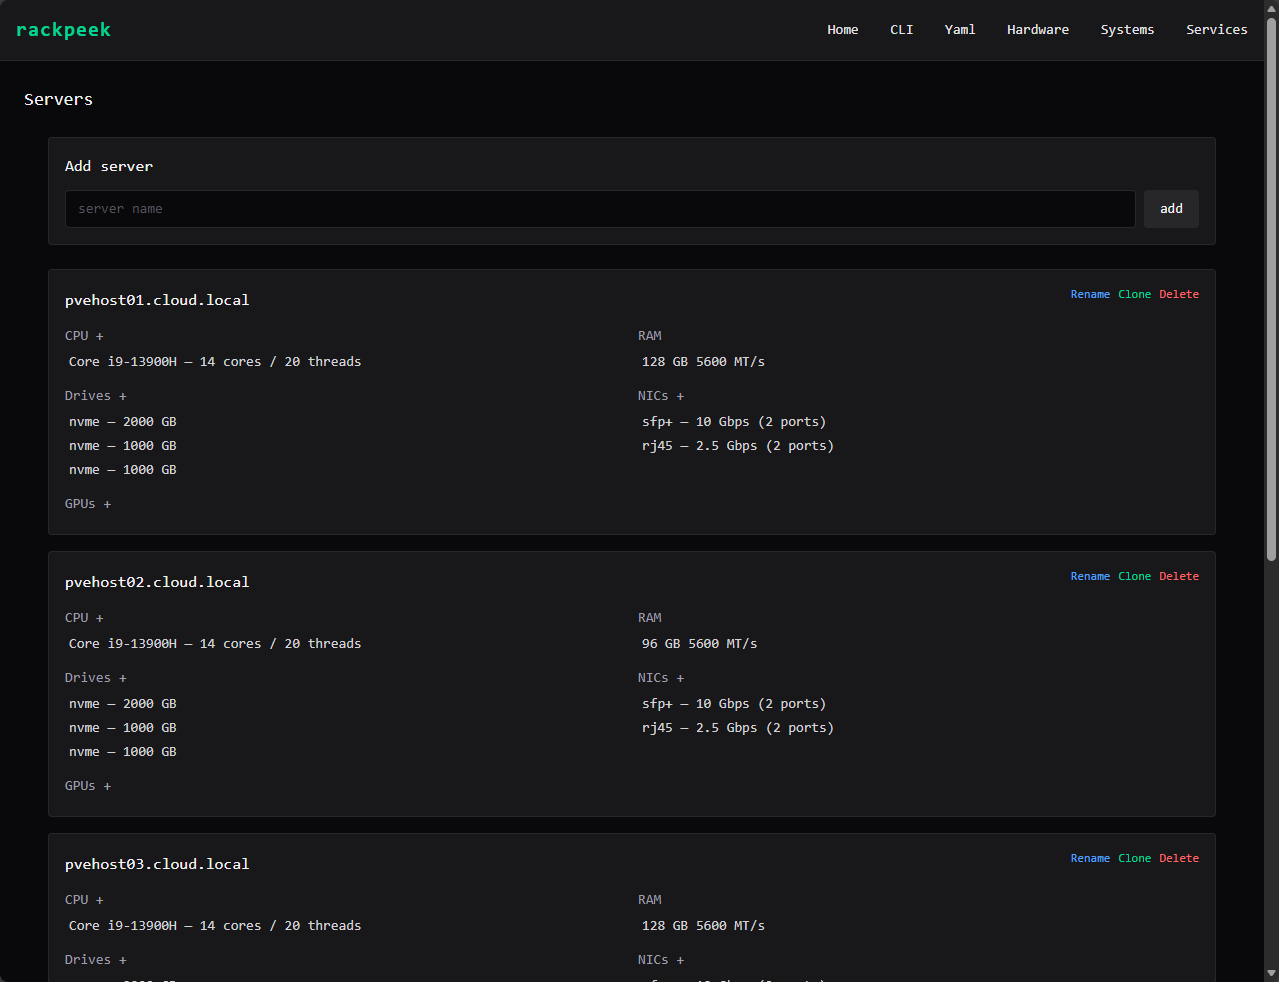
Then you have the ability to add things like CPU specs, hard drives, RAM, NICs, etc.
RackPeek CLI input
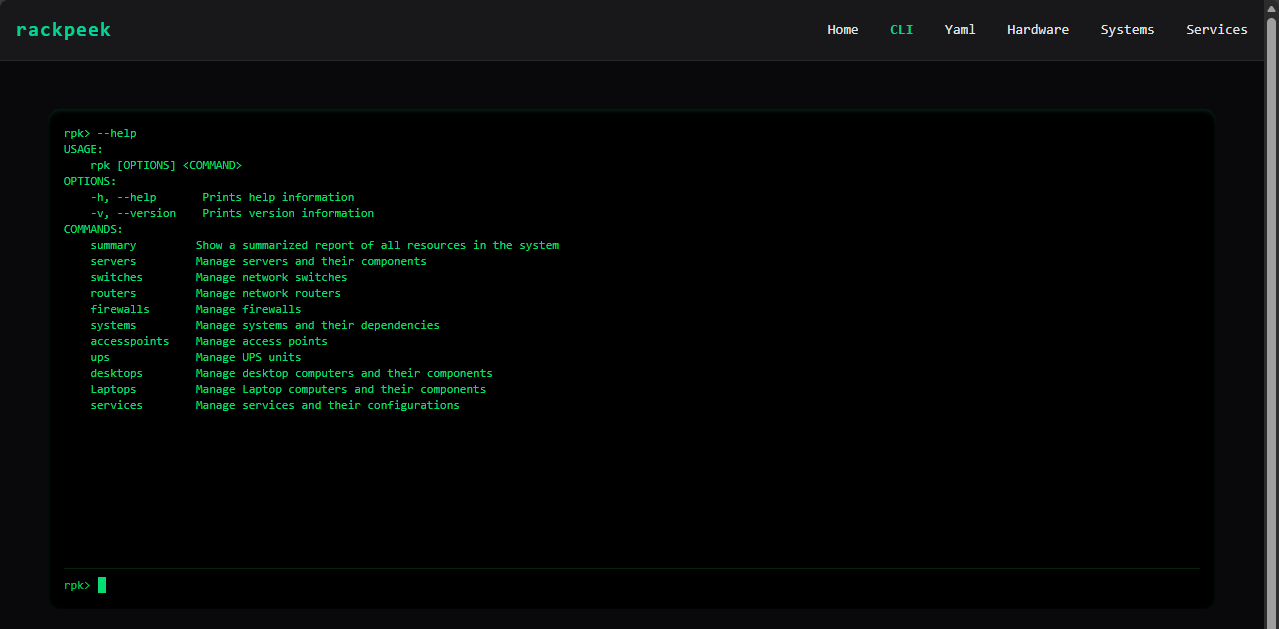
RackPeek also has a very neat CLI emulator that allows you the ability to enter CLI commands and input, edit, and view information from the YAML file it creates underneath the hood. You can view the CLI commands you can use by entering the –help parameter at the rpk command line.
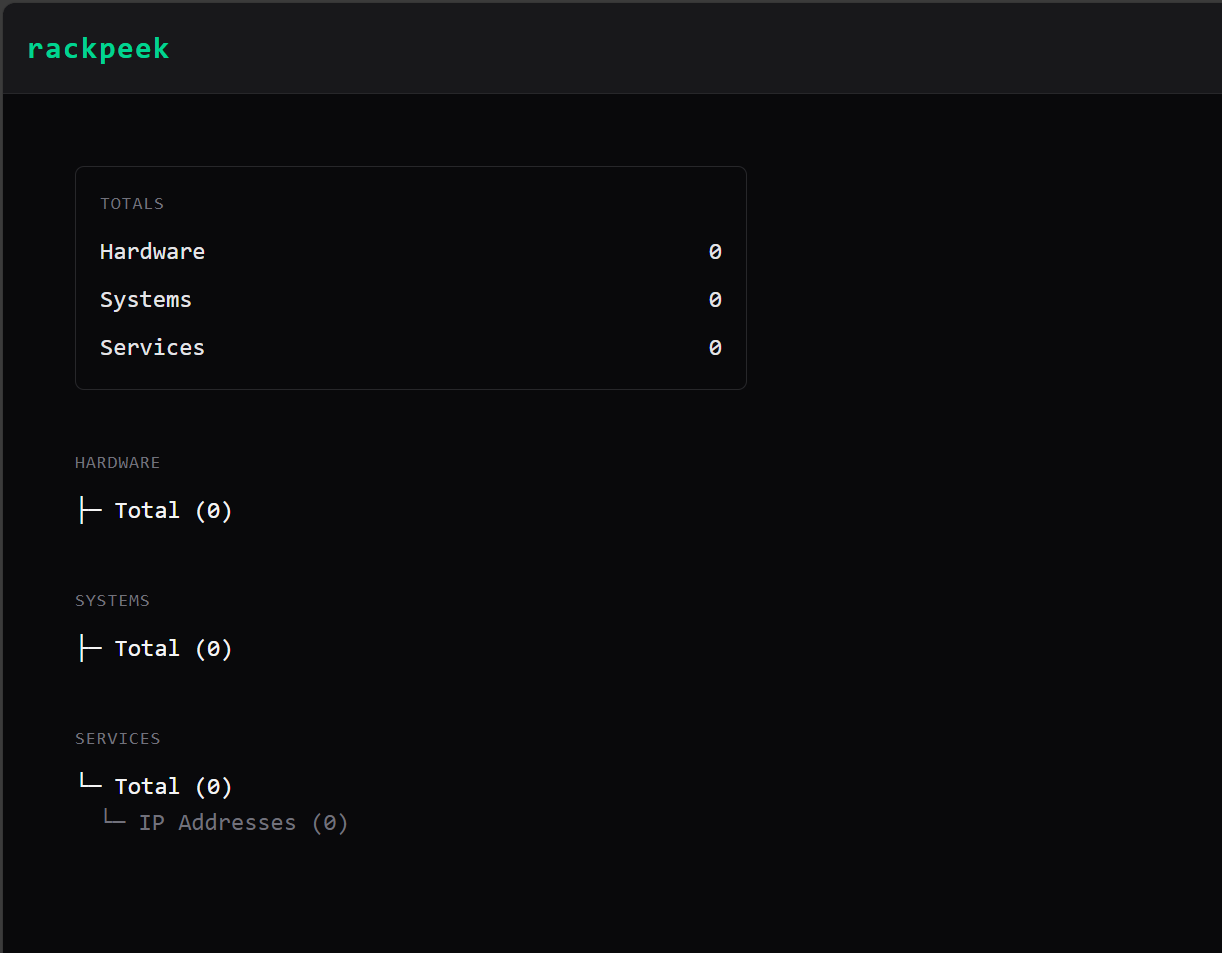
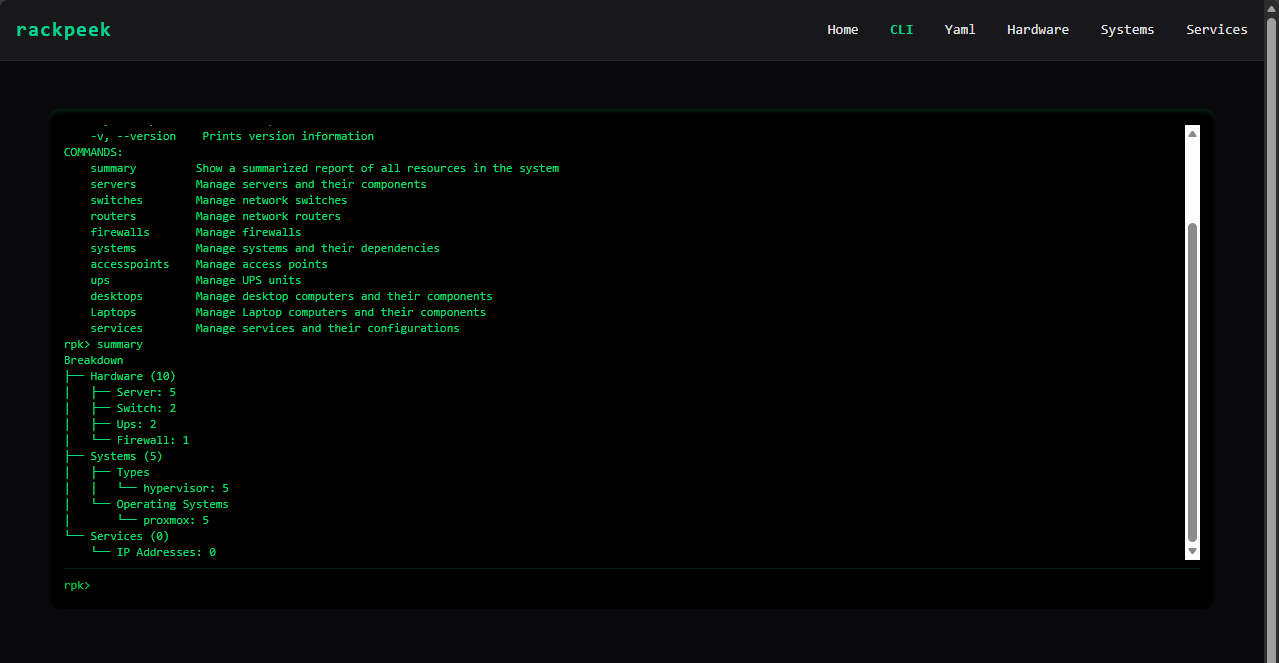
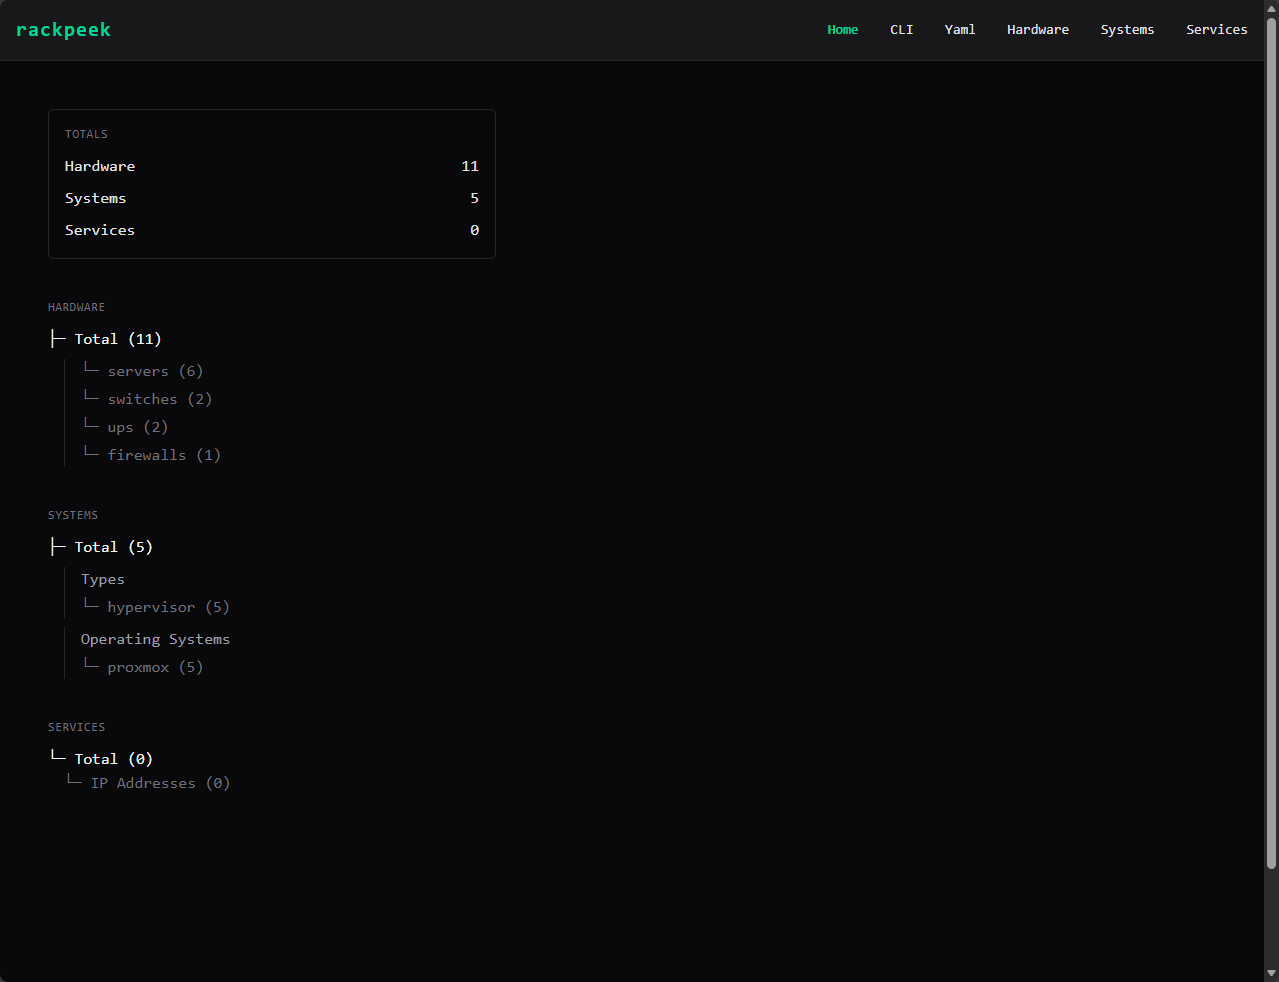
Below, you see a summary screen after I initiated the summary command.
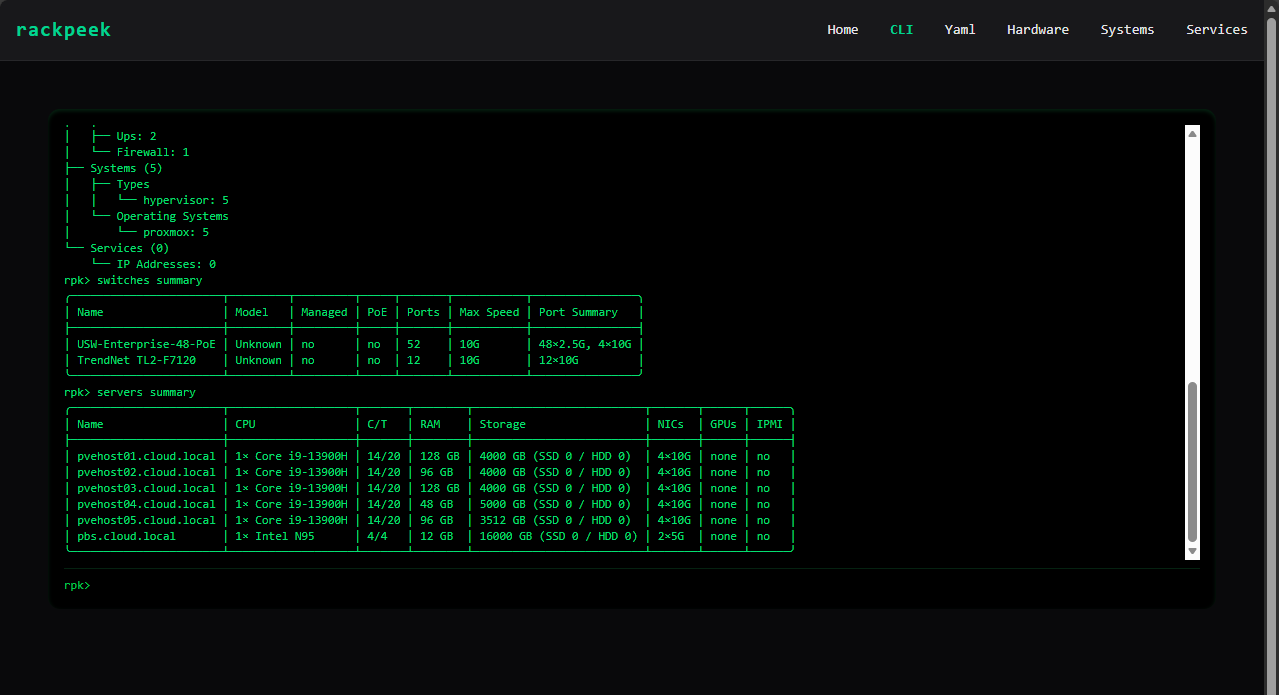
Below is a summary of switches and servers viewed by entering those commands.
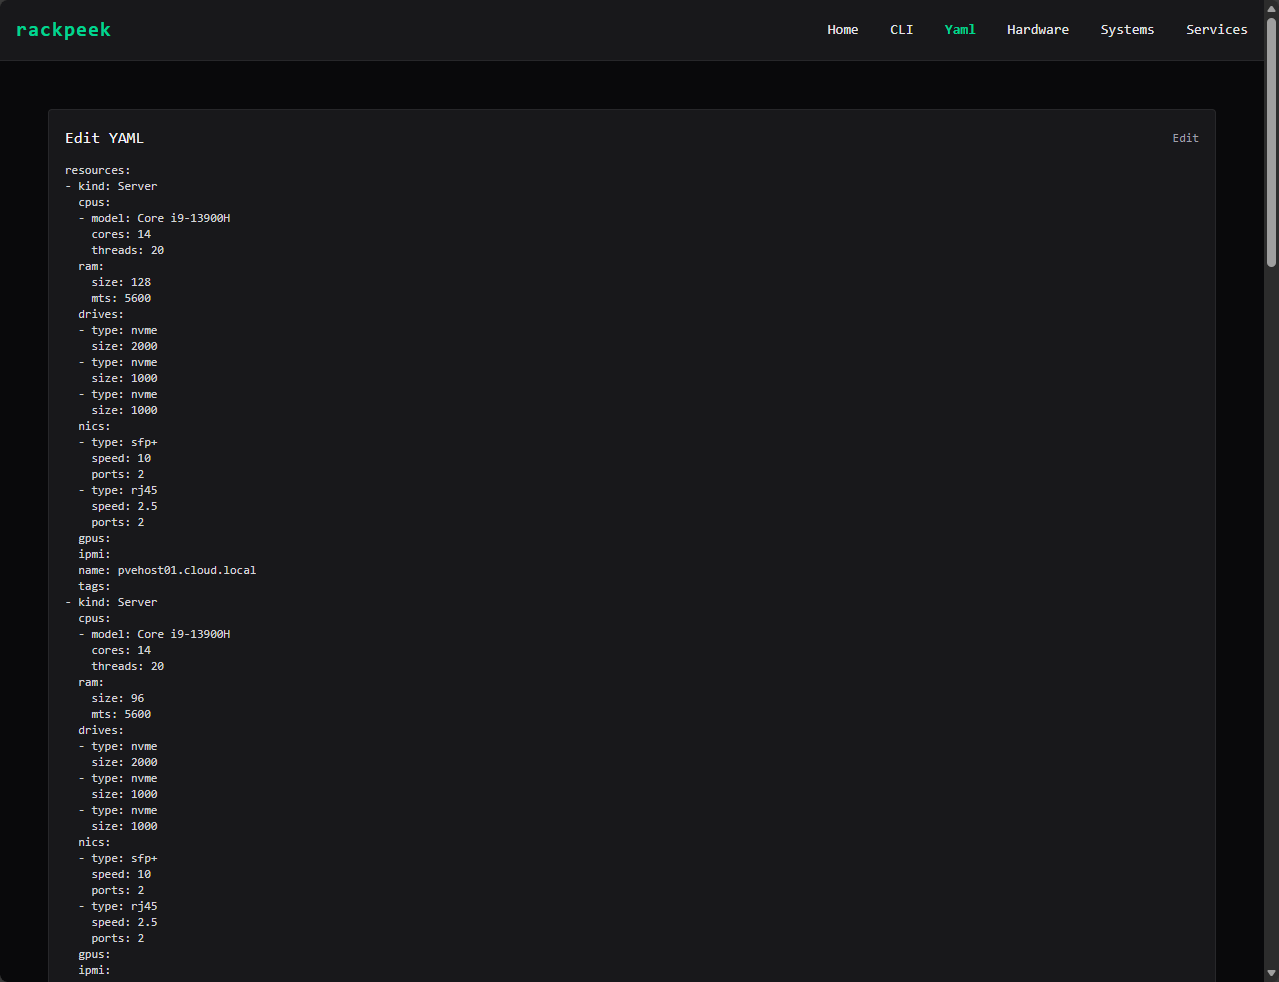
The YAML menu shows you the contents of the low-level YAML configuration file.
The home screen gives you counts on your devices, services, hardware and other details. Very cool.
How this ties into my broader home lab philosophy
If you read my recent posts about things like documenting your learning, building efficient home labs, managing Proxmox clusters, treating your lab like production, I think this tool fits perfectly. For those serious about this hobby and the learning potential that it provides, It is a real training ground that can excel your career and I think is a lot of fun.
RackPeek dovetails into this and allows you to get serious about keeping up with your environment, learning, changes, and root cause analysis for understanding how changes lead to either good or bad outcomes in the lab. All in all this helps to reinforce habits that directly translate into enterprise environments.
Is RackPeek for every lab?
I think honestly, yes. Even, if you have a single mini PC sitting on a shelf, you are probably running a handful of services, maybe even nested hypervisors for learning. No matter what size the lab is or becomes, all of the principles that RackPeek embraces, it teaches you the skills that I preach to ones getting started any way. Things like Git, version control, change management, documentation, etc.
So, even if your lab isn’t multi-nodes, multiple services, tons of containers, VLANs, etc, don’t let that stop you from exploring this type of documentation tool and the skills and principles it helps you to build.
Where I see this possibly going?
I am not sure what the roadmap looks like for RackPeek as of yet, but I can see this getting even more powerful with future releases. Think about the possibility of the following:
- Automation inventories – maybe where RackPeek goes out and does some of the information gathering for us
- Asset tracking
- I would like to see native Git integration with the solution where we can add a Git repo and have it natively push the changes for us when we go in and update things
- Maybe even service deployment? If we define services in RackPeek, could it deploy these for us?
I think though, that even if RackPeek stays simple, the concept of infrastructure documentation as code is something I think more home labbers should embrace. Our documentation often lives in a stale PNG file sitting on our hard drive somewhere and it rarely gets updated. Whereas something like this I think more would be prone to keeping things up to date as easy as it makes it with the CLI and other features of the tool.
Wrapping up
I think RackPeek is one of the most interesting documentation tools that I have found in quite some time as it aligns with a lot of the philosophies that are near and dear to my hear when it comes to home labbing and also production infrastructure. It forces you to be disciplined about documentation, but I think in a quirky way, it makes documentation fun for me. I like editing text files and keeping up with racks and gear and services this way. Plus, this totally aligns with documentation as code principles that I think most will benefit from. Diagrams are nice, but they are so difficult to really keep providing value to your environment. How about you? What do you think about RackPeek?
Google is updating how articles are shown. Don’t miss our leading home lab and tech content, written by humans, by setting Virtualization Howto as a preferred source.
About The Author

Try bookstack