Monitoring your home lab environment running Proxmox is something that all of us should do. Monitoring is not the most thrilling aspect of any home lab, but it is extremely important. It tells you when things are wrong, or let’s you know things are ok as well. Usually we spin up a few VMs and containers, glance at CPU use and call it good. However, that works until you have something that starts to feel slow or act weird. My lab has grown intoa multi-node environment that is now using Ceph storage. When you have multiple nodes and software-defined storage, monitor proxmox home lab nodes and their health is important. Let me show you my Proxmox home lab monitoring stack and what I use.
For me why one tool is not enough
To monitor my home lab and see everything that I want to see, one tool is just not enough to do everything I want from a monitoring perspective at least not quite yet. There really great Proxmox monitoring solutions, including built-in monitoring that I am using currently. What are those?
These are:
With both of these, I can see everything that I currently want to see with my cluster, including hardware health information. These allow me to answer questions like:
- Is my physical hardware healthy?
- Temperatures and thermal monitoring, PCI devices
- System logging
- What is the resource usage of my Proxmox hosts?
- What is the resource usage of the virtual resources in my Proxmox environment
- Side benefits (seeing Docker container health)
- Proactive alerting
- Ceph storage cluster monitoring
No single tool does everything. Proxmox itself gives you some of it. The other tools I mentioned ProxMenux and Pulse really round out monitoring. So i stopped trying to find the magical dashboard that was perfect and gave each tool a specific role that I looked to it for. This helped my Proxmox monitoring overall.
Proxmox built in monitoring
Most of us are probably aware that Proxmox has built-in monitoring of sorts. The web UI is a great place to start looking at your host metrics, virtual machine resources, and LXC container statuses and performance metrics.
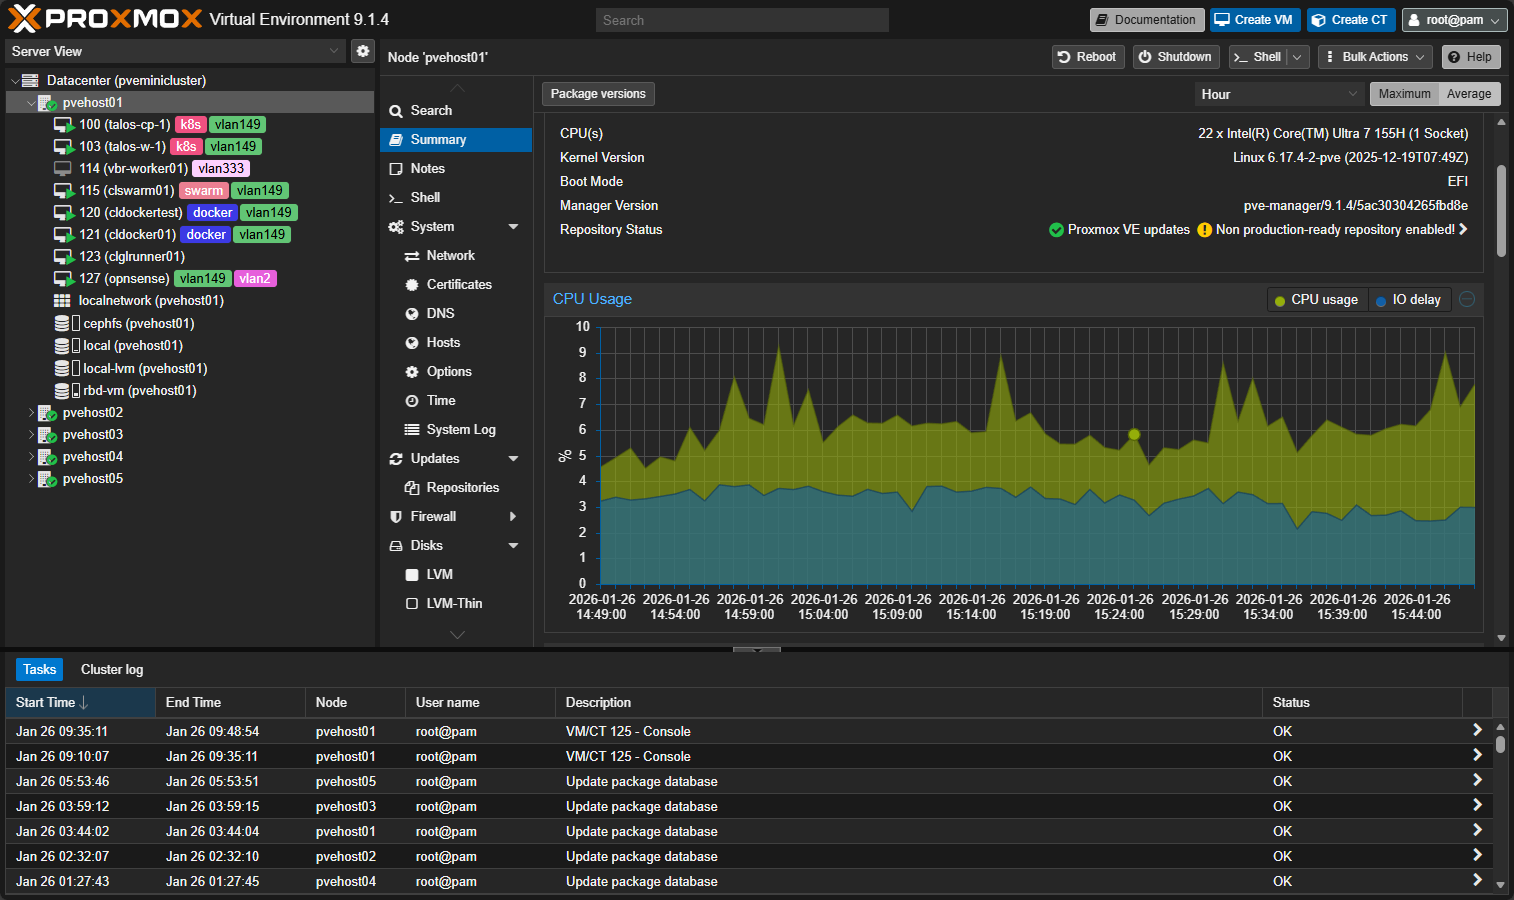
It is the first place I look when something seems wrong, and it helps you answer things very quickly if there is something obvious going on. You can see:
- Cluster quorum and node status
- CPU, memory, and load trends per node
- VM and LXC resource usage
- Backup status and failures
- Task history and errors
For day to day operations, it tells me whether the cluster itself is happy and there isn’t contention or other problems underneath.
I think where Proxmox monitoring starts to fall short is depth and context. It shows you that CPU use is high but it doesn’t necessarily do a good job of showing you why it is. It shows storage usage, but not really whether or not latency is creeping up. It shows that a VM is running, but not whether the application inside that VM is responding or if the Docker container it is running is healthy.
ProxMenux excels at hardware checks and health information
ProxMenux has become a staple in my home lab. My Proxmox hosts get the post install script managed by ProxMenux and it is fantastic. Also, in case you haven’t see, ProxMenux now has a monitoring module that is installed with the latest version. It also contains many other optimizations that are great for Proxmox nodes especially running in the home lab environment. You can see the list of optimizations it makes here:
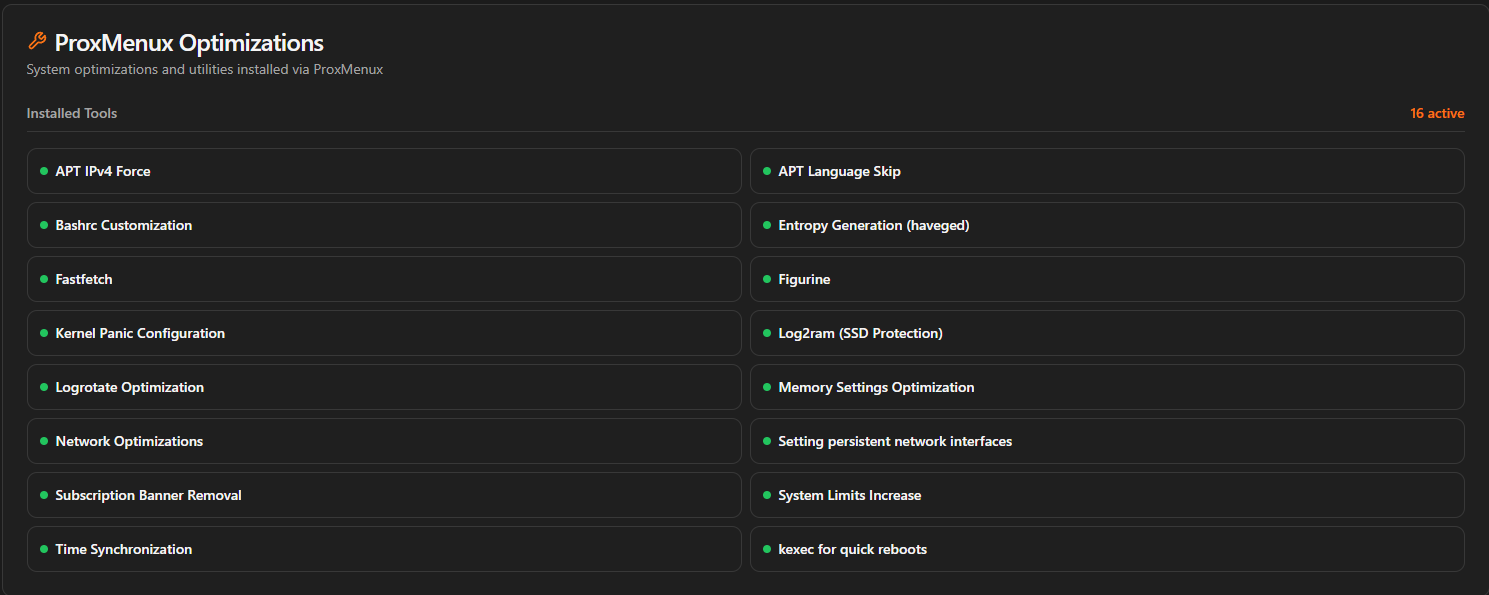
Once you install it, you can access the monitoring dashboard on port 8008 on your Proxmox host.The interface is super modern and provides a lot of great detail across all aspects of your Proxmox host, including hardware monitoring, which is something that a lot of other monitoring solutions are missing.
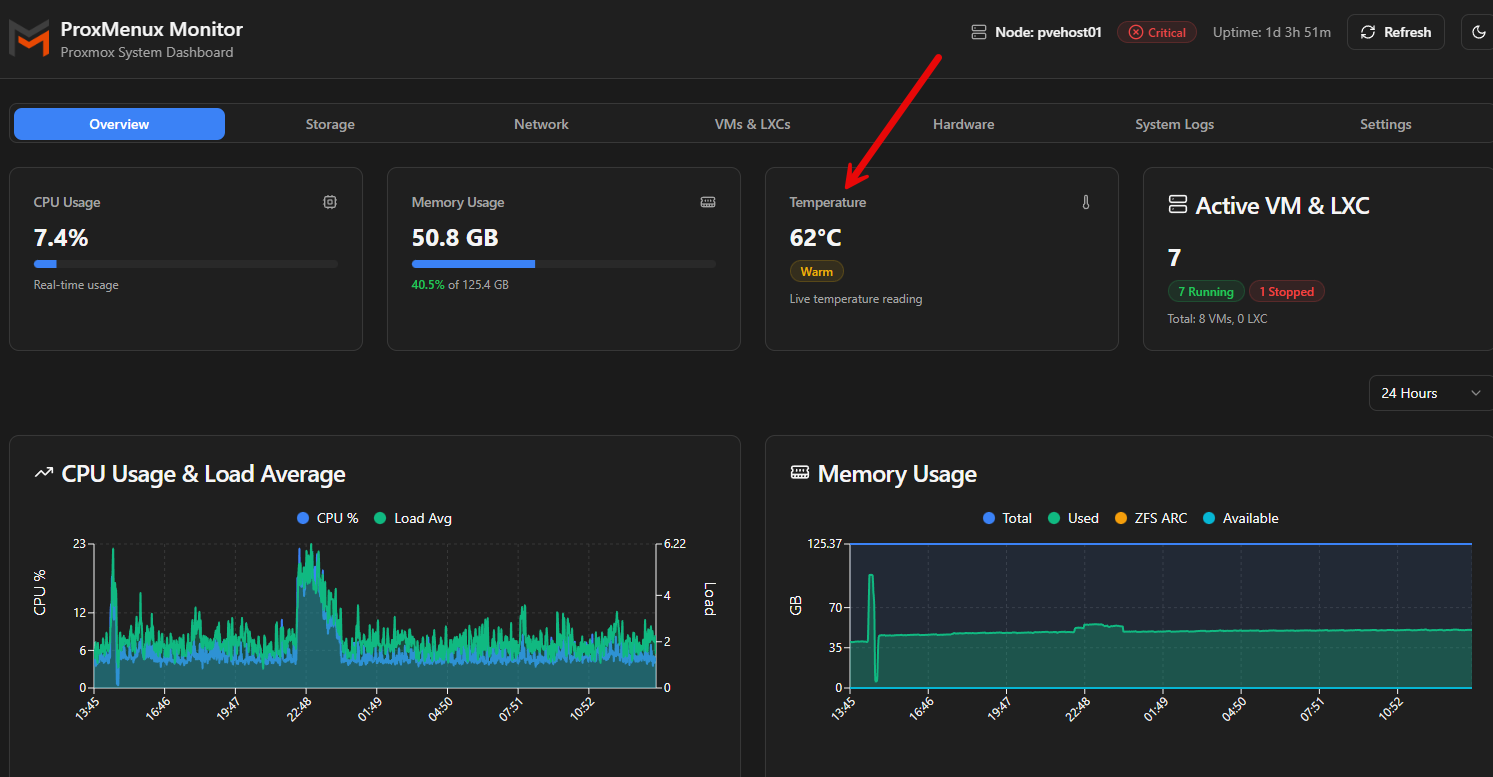
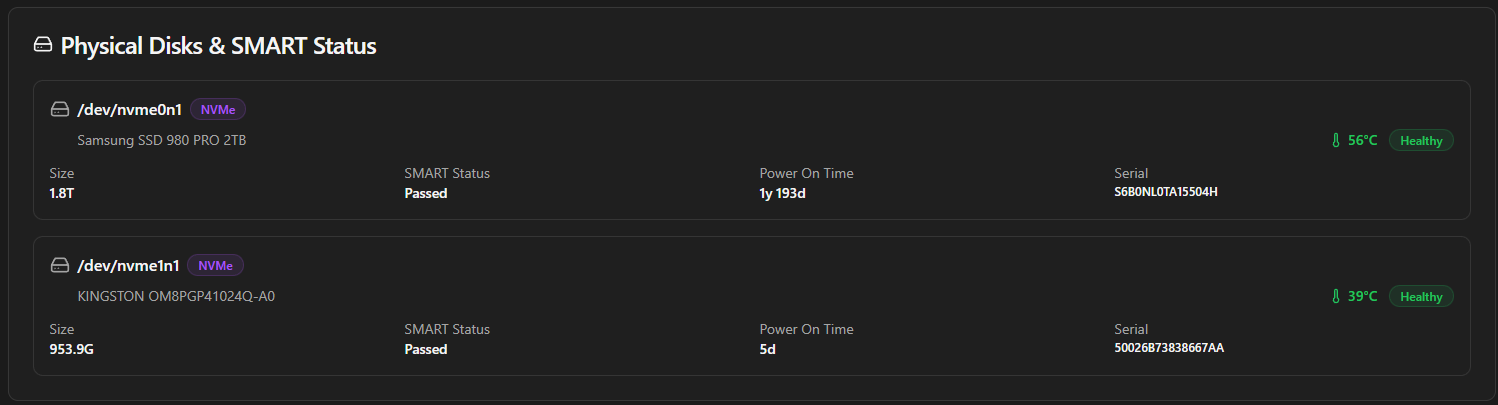
Proxmenux blew me away at the wealth of information you get about your hardware all found in the dashboard. Below are just a few of the nuggets of information you have access to. SMART data from your disks is readily available.
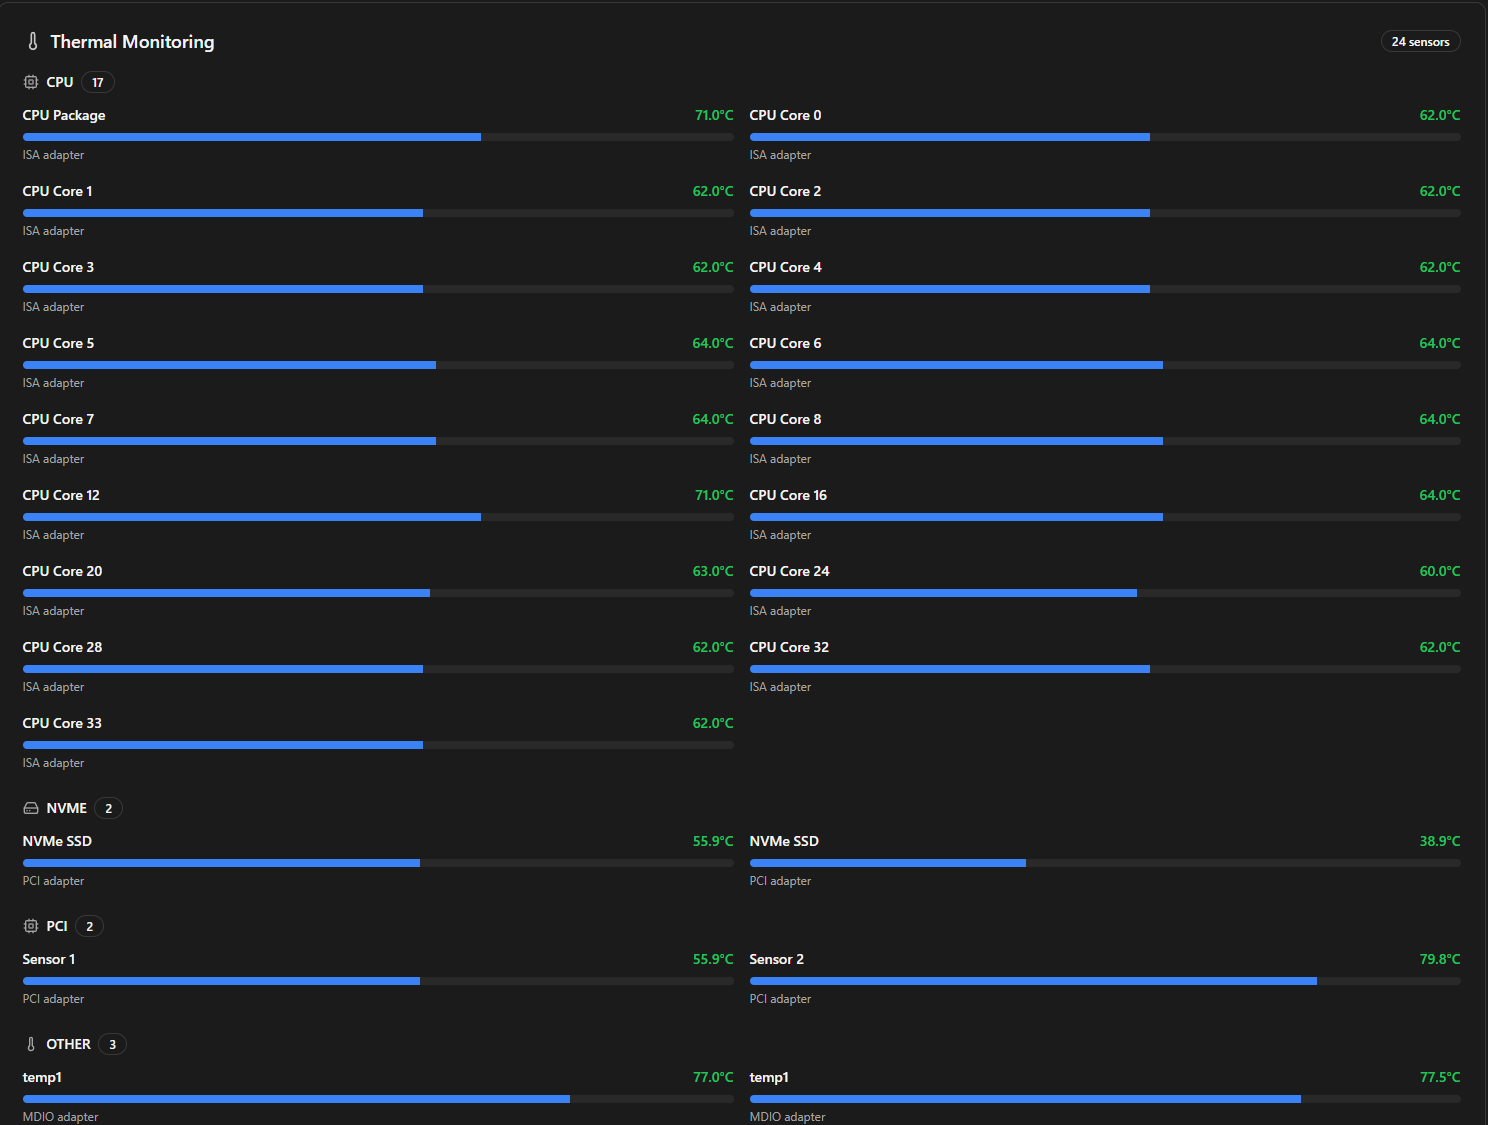
Also, you get an absolutely wealth of detailed and very specific thermal information about many different components in the system.
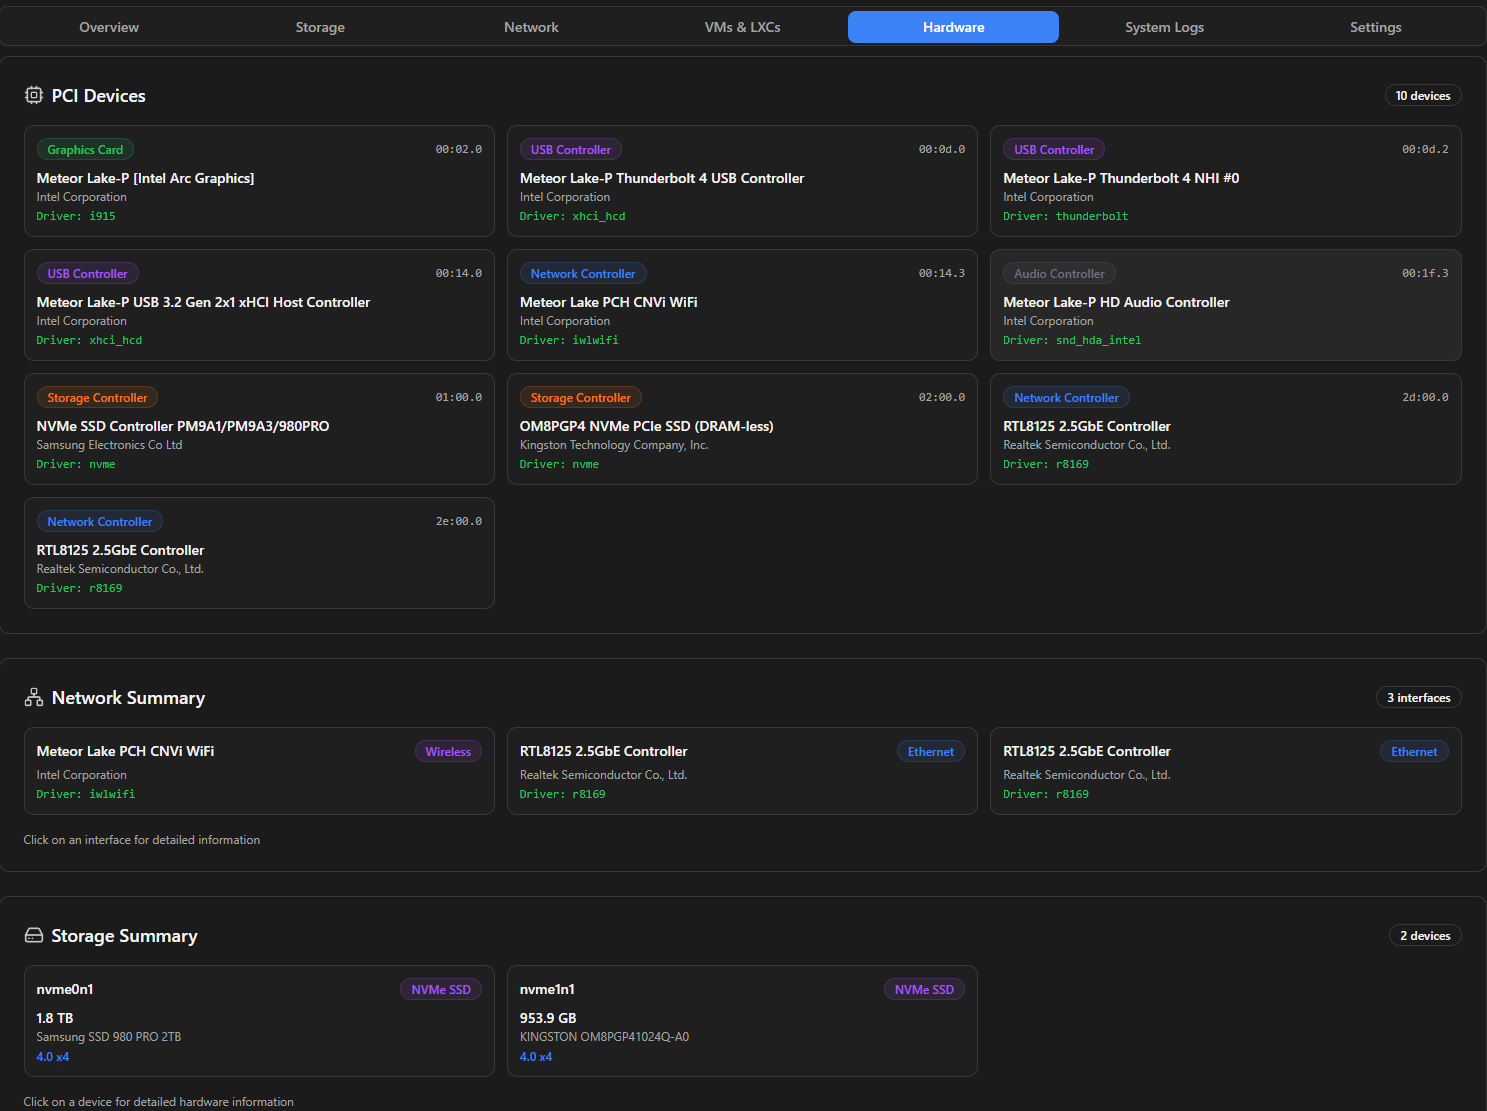
You can also see very detailed information on all the PCI devices found in your host hardware.
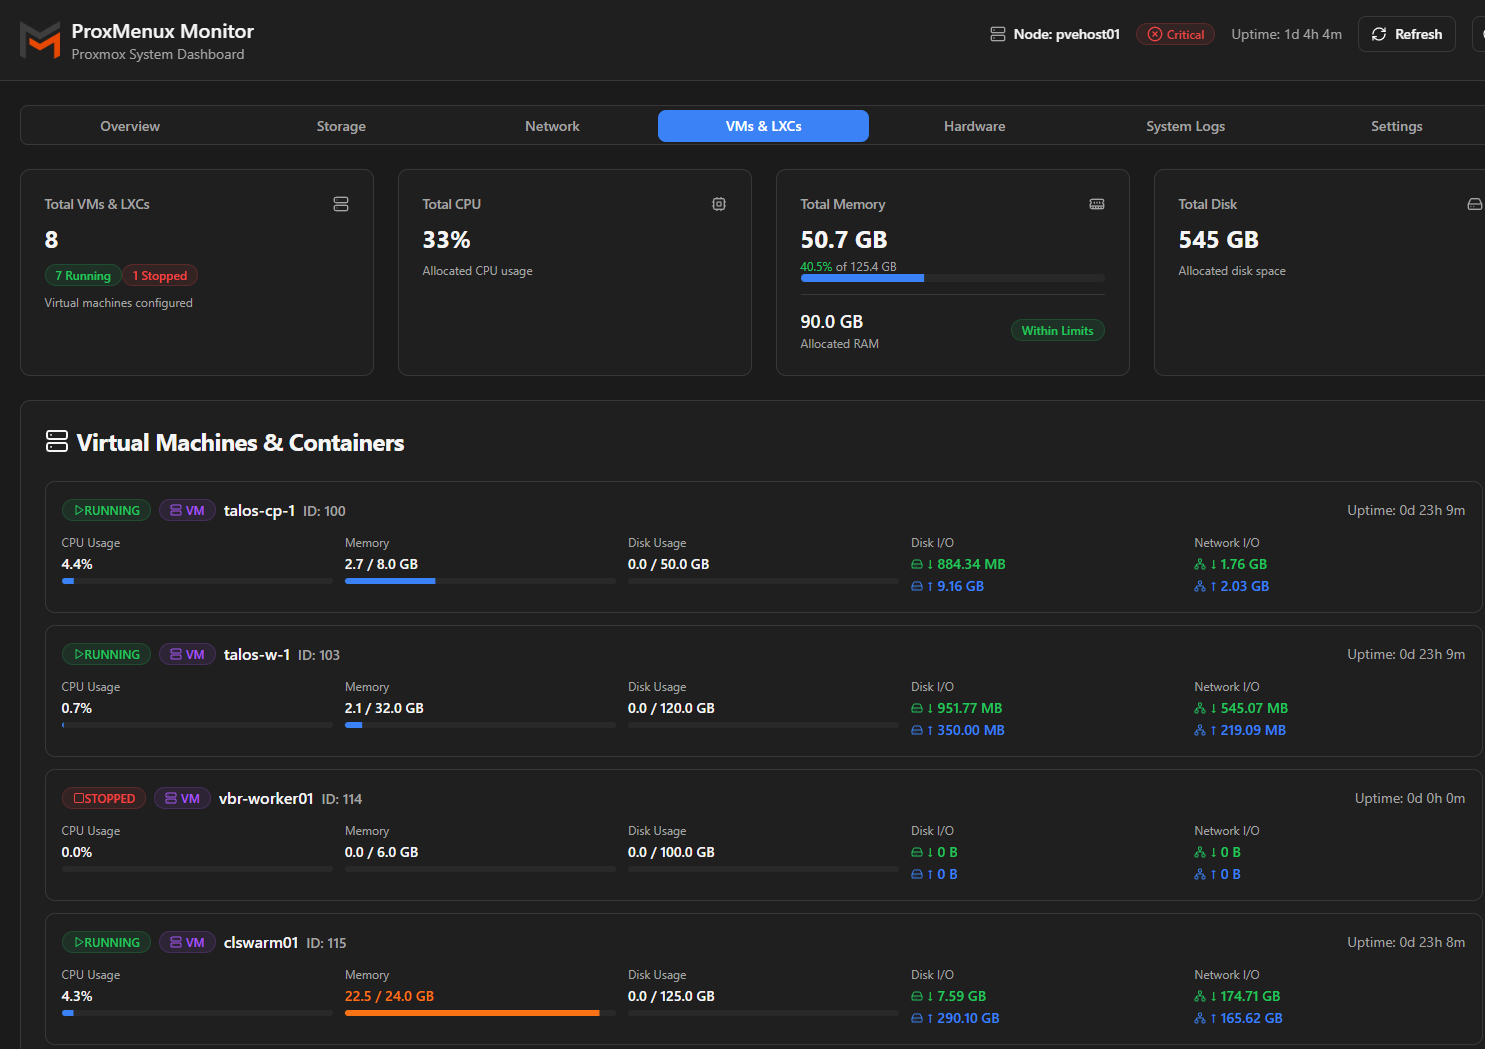
ProxMenux gives me lightweight visibility into nodes, VMs, and basic status along with the all-important hardware health information as well as the expected CPU, memory, and great networking visibility.
Check out my full write up on ProxMenux monitoring here:
I also did a video on ProxMenux monitoring:
Pulse takes VM and Docker monitoring to the next level
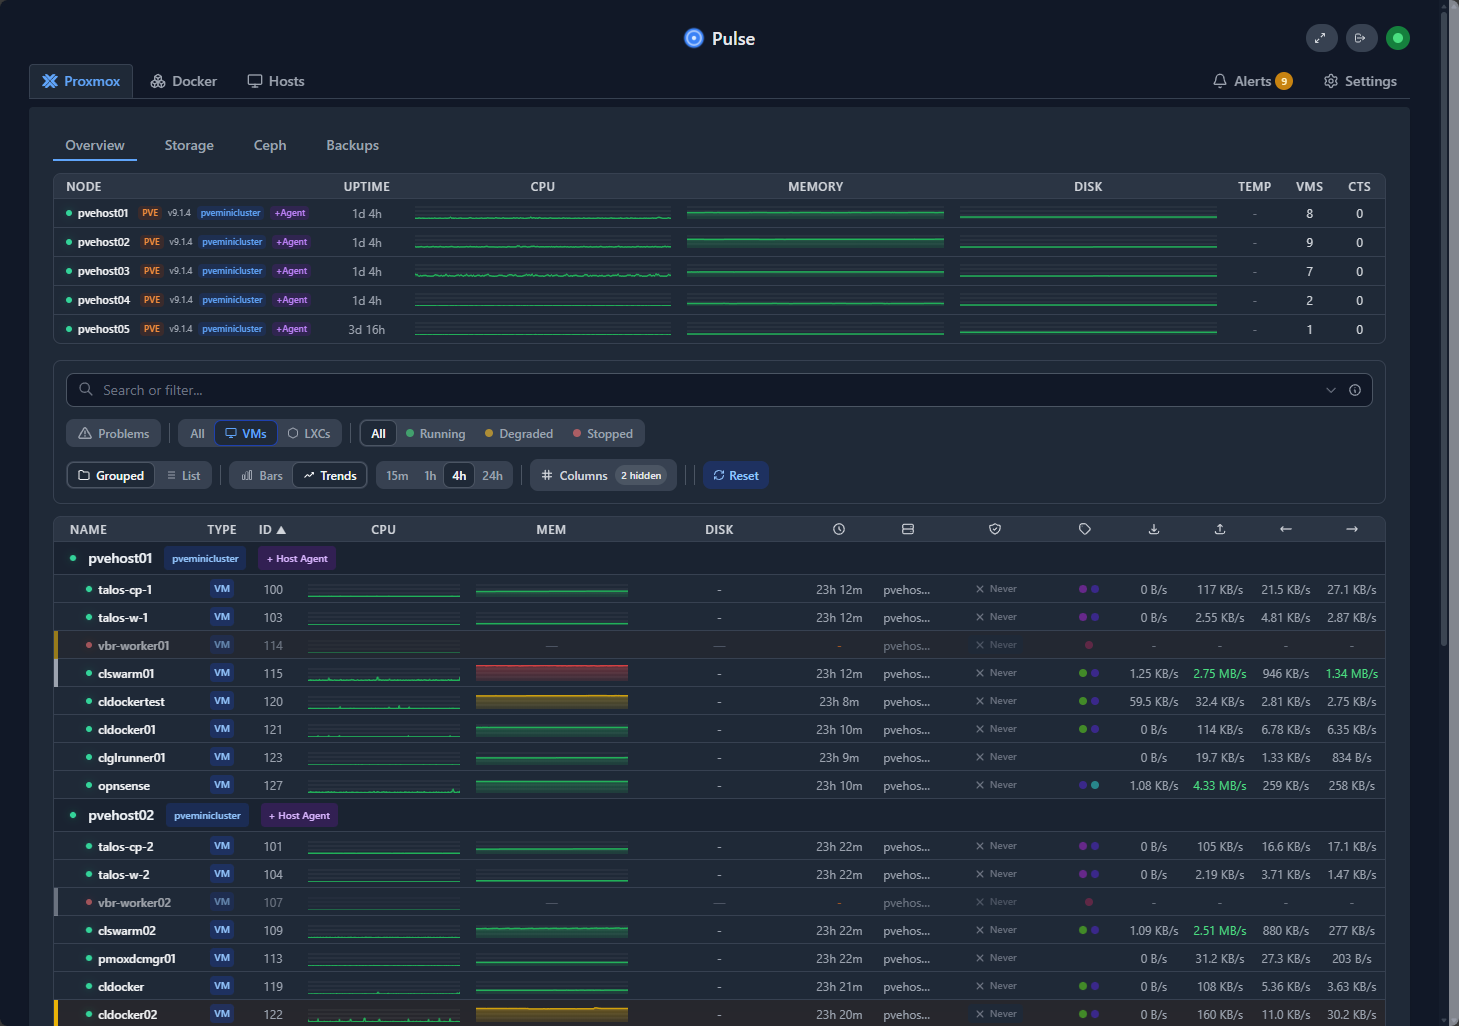
When it comes to monitoring my virtual machines, LXCs and Docker cotnainers running in Proxmox, Pulse takes your ability to monitor Proxmox home lab nodes to the next level. It is one of the best monitoring tools right out of the box that I have seen with Proxmox as I think it encapsulates just about everything that you want to know about a Proxmox node running in the home lab or production environment.
You can see host metrics in detail, your VMs, LXCs, AND Docker. This is something most other monitoring solutions don’t give you is this level of detail into all aspects of the environment, including your application-level containers.
I also like how Pulse arranges everything at your fingertips. When you log into Pulse, you will see the tabs Proxmox, Docker, Hosts. Below, you can see my 5 Proxmox hosts in a cluster, along with the Overview, Storage, Ceph, and Backups tabs.
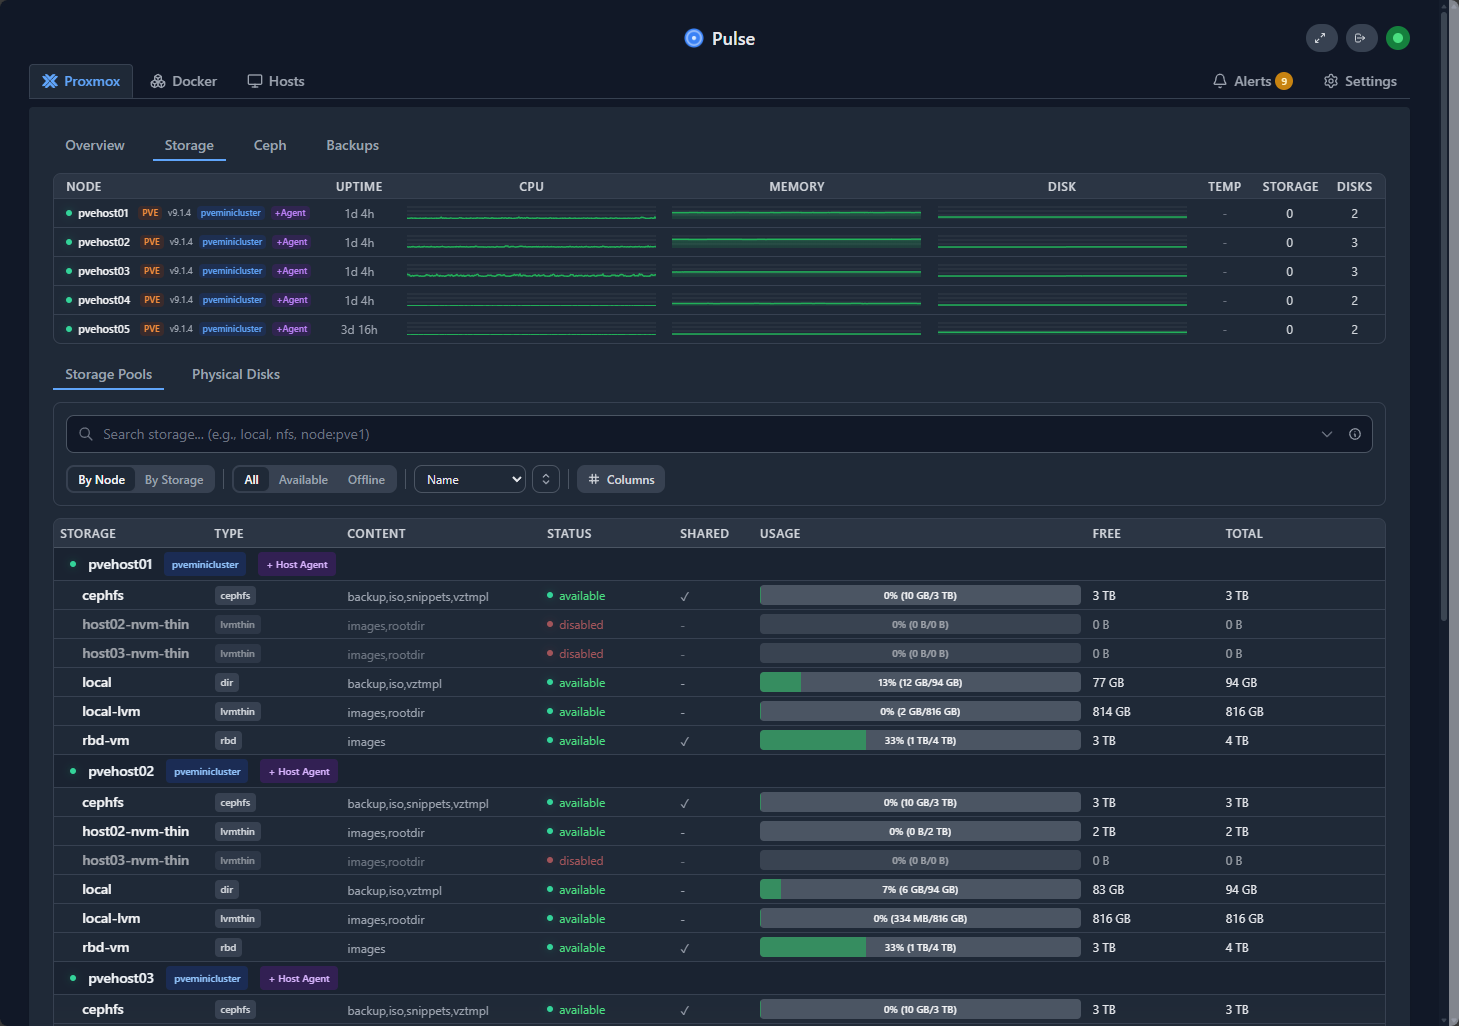
Below, we are viewing the Storage tab. Here you can see storage in detail on each of your Proxmox hosts.
One of the pleasant surprises with Pulse is just how good the Ceph visibility is in the solution. I was thinking my only option was the Ceph dashboard for Ceph visibility. But, Pulse comes through here massively with this visibility into your software-defined storage.
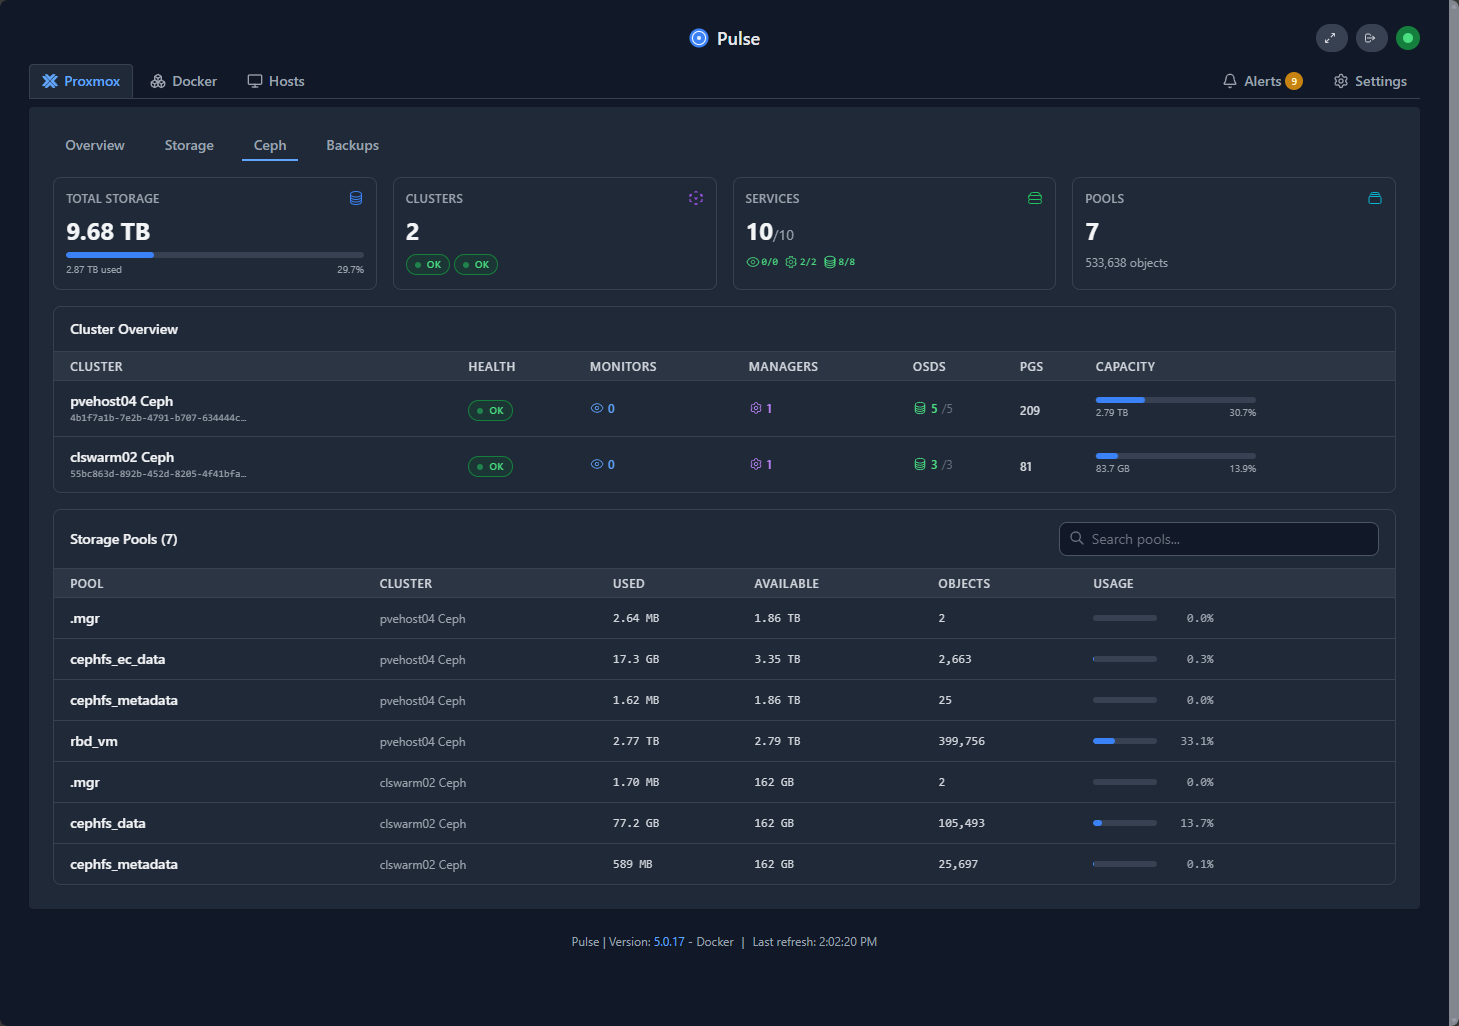
This is where monitoring really starts to level up. You have visibility in one tool for basically all of the relevant components that you need to keep an eye on to make sure that your applications are performing as you would expect them to.
Also, I am thoroughly impressed as well with the Pulse Docker monitoring. Not only do you get a rounded out view of all your Proxmox KPIs but you also get a good look at the performance of your Docker containers in the environment. You can see if these are seeing any memory pressure, CPU issues, etc.
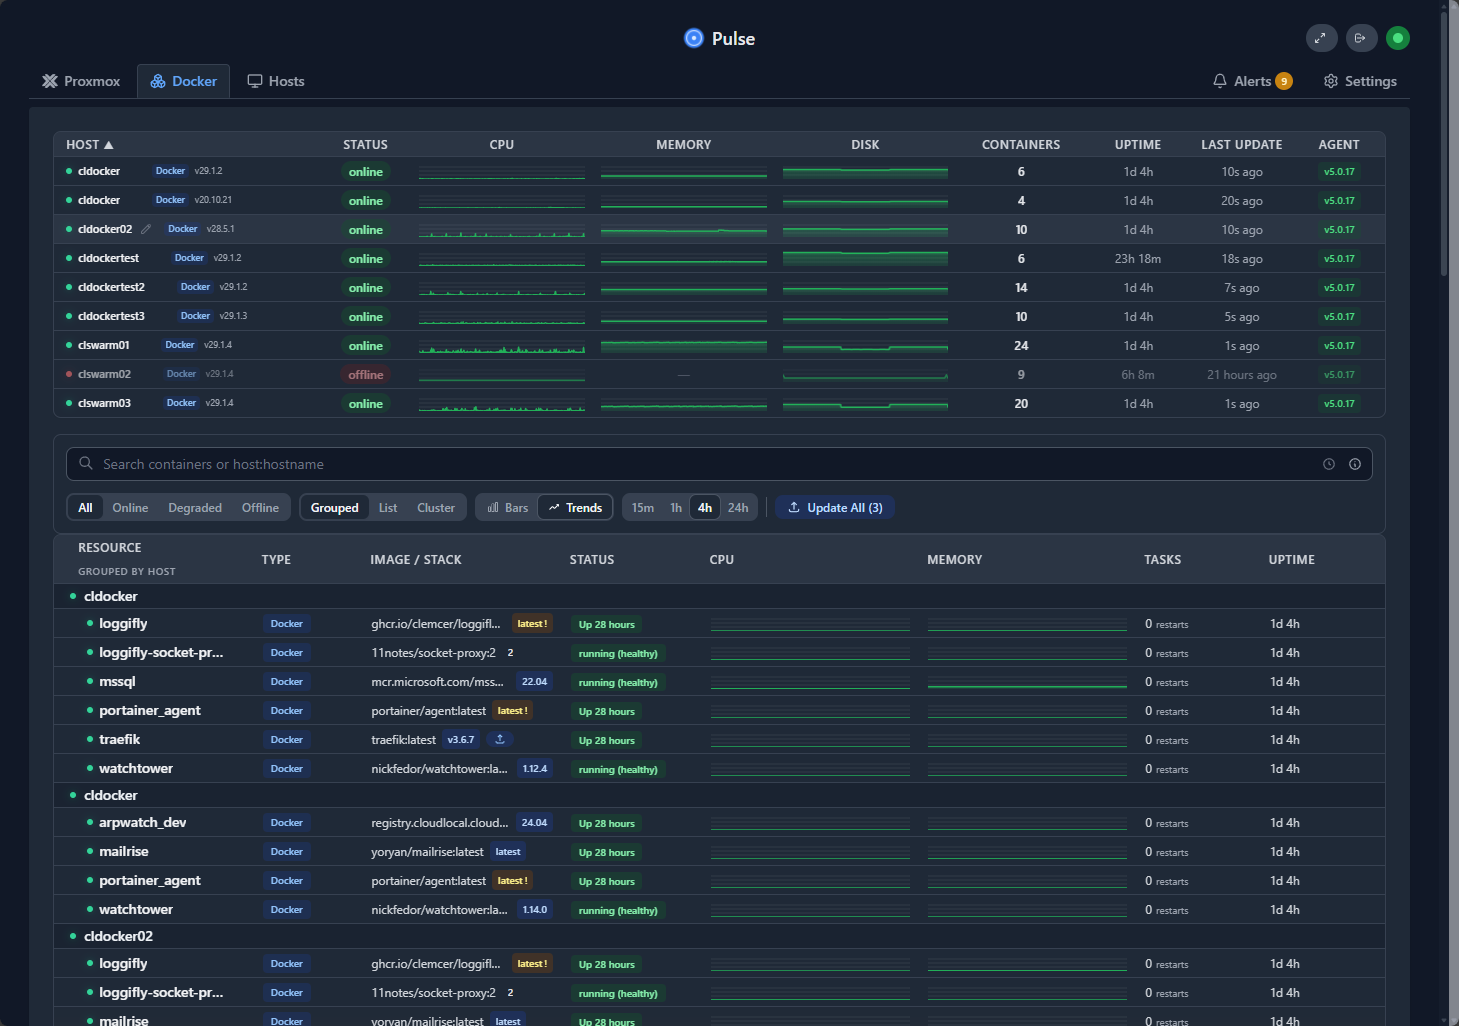
Pulse gives you a wholistic overview picture of the health of the environment. You can answer question slike is my Proxmox host healthy or having issues? Is the Docker VM host under resource pressure? Is my Ceph storage impaired? Is the Docker container itself having issues? This is huge as I think it shifts your mindset from “is it running” to “is it usable.”
Be sure to check out my full write up on Pulse monitoring here:
I also did a video on this one as well:
Ceph dashboard
Just as a mention, you can also install the native Ceph dashboard to monitor proxmox home lab nodes software defined storage. This allows you to access the Ceph dashboard directly from your Proxmox VE Server host. You can install it by using these steps that are documented on the official Proxmox forum page here: (5) [TUTORIAL] – [Nautilus] activating CEPH DASHBOARD.
# install this on all manager nodes
apt install ceph-mgr-dashboard
ceph mgr module enable dashboard

# generate a new password and add to this file
cd /etc/ceph
vim dashboard-pw
chmod 600 /etc/ceph/dashboard-pw

# ceph dashboard ac-user-create
ceph dashboard ac-user-create admin -i /etc/ceph/dashboard-pw administrator
ceph config-key set mgr/dashboard/server_addr ::

# generate certificate
openssl req -newkey rsa:4096 -nodes -x509 \
-keyout /etc/ceph/dashboard-key.pem -out /etc/ceph/dashboard-crt.pem -sha512 \
-days 3650 -subj "/CN=IT/O=ceph-mgr-dashboard" -utf8

ceph config-key set mgr/dashboard/key -i /etc/ceph/dashboard-key.pem
ceph config-key set mgr/dashboard/crt -i /etc/ceph/dashboard-crt.pem

ceph mgr module disable dashboard
ceph mgr module enable dashboard
systemctl restart ceph-mgr@[servername].service

Afterwards, go to the dashboard URL: https://[IP or FQDN]:8443 or http://[IP or FQDN]:8080
After logging in with the admin password you set as part of the configuration steps listed above you will see the dashboard that looks like the following:
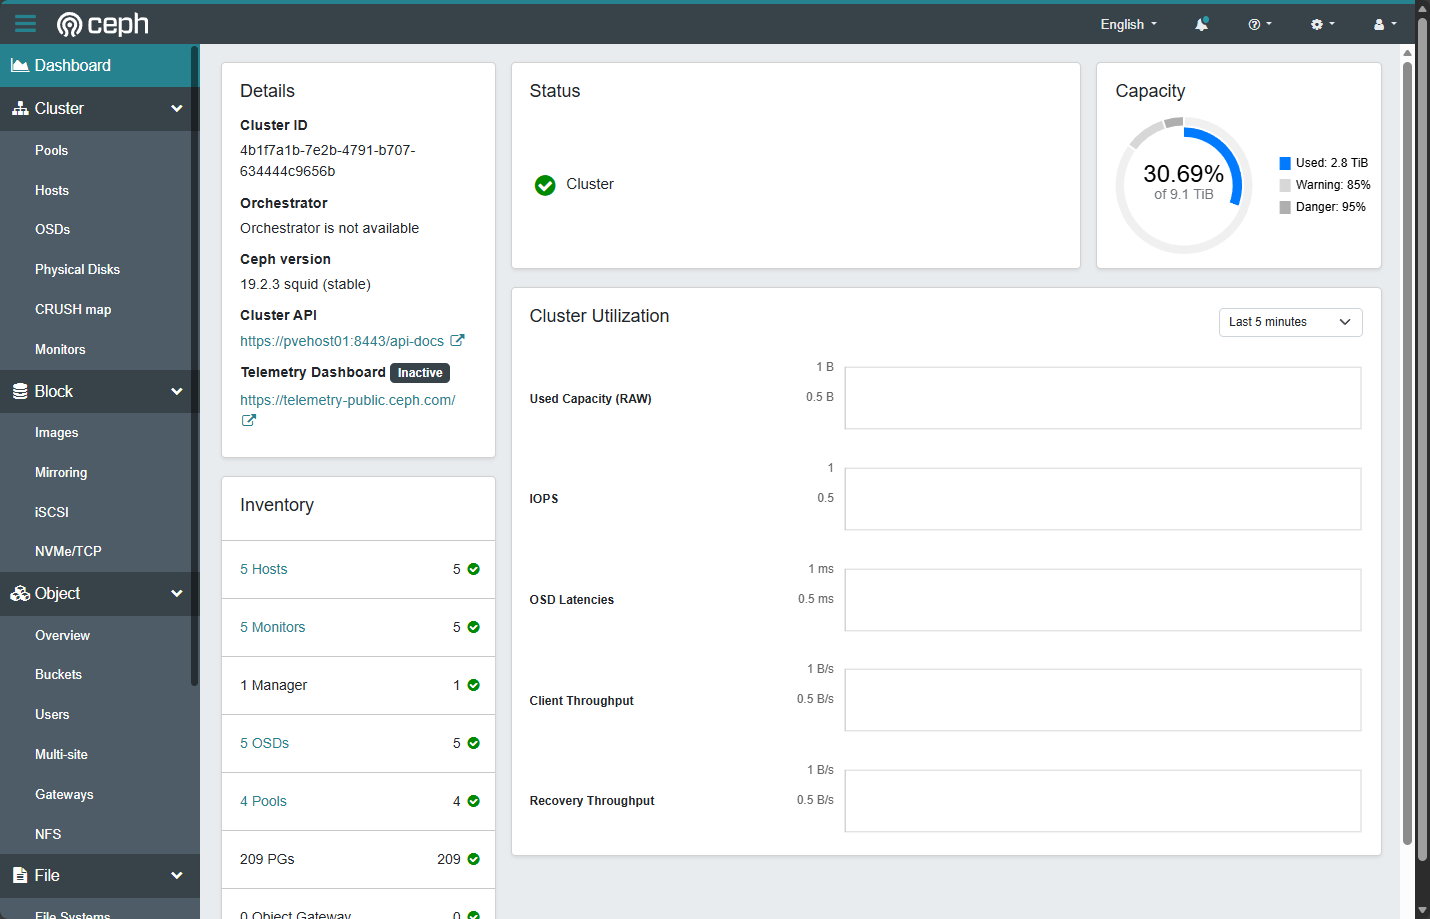
If you are running Ceph in your Proxmox home lab, I really think the Ceph dashboard is non optional. It gives you visibility into the following things:
- OSD health and status
- Placement group state
- Recovery and rebalancing activity
- Latency trends
- Capacity distribution
This is information you simply cannot get from the Proxmox node summary alone. It is good to know if there is a recovery operation happening, rebalancing, or some other activity. Since I am using Ceph for my backend storage, the Ceph dashboard, along with the Pulse functionality to monitor Ceph helps to spot issues proactively.
Wrapping up
Hopefully, this post on how to monitor proxmox home lab nodes gives you an idea of the tools I am currently using for my Proxmox-based home lab that is running Ceph softtware-defined storage. I love the fact that Proxmox has the basics covered with the general graphs and monitoring it provides out of the box. This i think is the strength of the default monitoring. It is quick and easy. You see these if you are in the default interface so they are just there for you to consume.
However, if you want to dig deeper into things like hardware health, this is where tools like ProxMenux come into play. It shows you a great view of your hardware, temperature readings, SMART statuses, and many other things. Pulse is where I go for application performance troubleshooting and general health of my applications related to the underlying infrastructure. Pulse gives you a great overall view of your Proxmox hosts, Ceph storage, Docker containers, and has alert metrics that you can tweak and tune to alert you when things go outside of that range. What tools are you using for monitoring your Proxmox environment? Let me know in the comments what tools I am missing for even better visibility.
Google is updating how articles are shown. Don’t miss our leading home lab and tech content, written by humans, by setting Virtualization Howto as a preferred source.
About The Author


Great post – I totally agree that monitoring your Proxmox home lab can’t really be done well with just one tool, especially once your setup grows beyond a single node and simple VMs. The way you break down how you use built-in Proxmox metrics + ProxMenux for hardware health + Pulse for VM/LXC/Docker visibility is super practical and makes a lot of sense for a real-world home lab stack.
Thanks for the detailed breakdown – this will definitely help folks looking to step up their monitoring game without diving straight into a massive Prometheus/Grafana stack.