You may have spent tons of time optimizing and monitoring the performance of virtual machines, containers, and other infrastructure in your home lab. However, network visibility often gets ignored in general unless something breaks or performance tanks for some reason. A small misconfiguration in your network can cause things like traffic loops or other types of issues. Monitoring your home lab network gives you visibility into the underlying “life blood” of your lab. Here are five important things that you should be monitoring on your home lab network but probably aren’t along with how to monitor each one.
1. ARP requests and MAC flapping
This is one that I constantly preach is a great one to monitor and that is ARP requests and any MAC address flapping that might be happening on the network. ARP is short for Address Resolution Protocol. It is the protocol that is used to match an IP address to a MAC address. When you monitor ARP, you can get visibility into normal traffic but also if there are MAC address flapping which can happen when a switch sees the same MAC address on different ports.
This kind of behavior can happen if you have a bad cable or something like a bridging loop happening. Keeping an eye on ARP requests and flapping events helps give visibility into these types of issues and can save you literally hours of headache trying to narrow the problem down. But it is something that most aren’t monitoring or don’t have a way to monitor.
How to monitor ARP and MAC flaps
If you have a managed switch that you can actually get into via the CLI or even a web interface, most of these have a forwarding table or MAC address table they keep to know which ports are the path to which IP addresses.
This is a resource you can look at manually or probably monitor as well. However, ultimately one of the best solutions is ARPwatch. It is an open source project that allows you to stand up a monitor or probe if you will to monitor these MAC address changes. When a machine “arps” out, ARPwatch will alert you to it. Also, and this is key, it will alert on MAC address changes. So, it keeps a table of MAC address to IP addresses so it knows who these belong to.
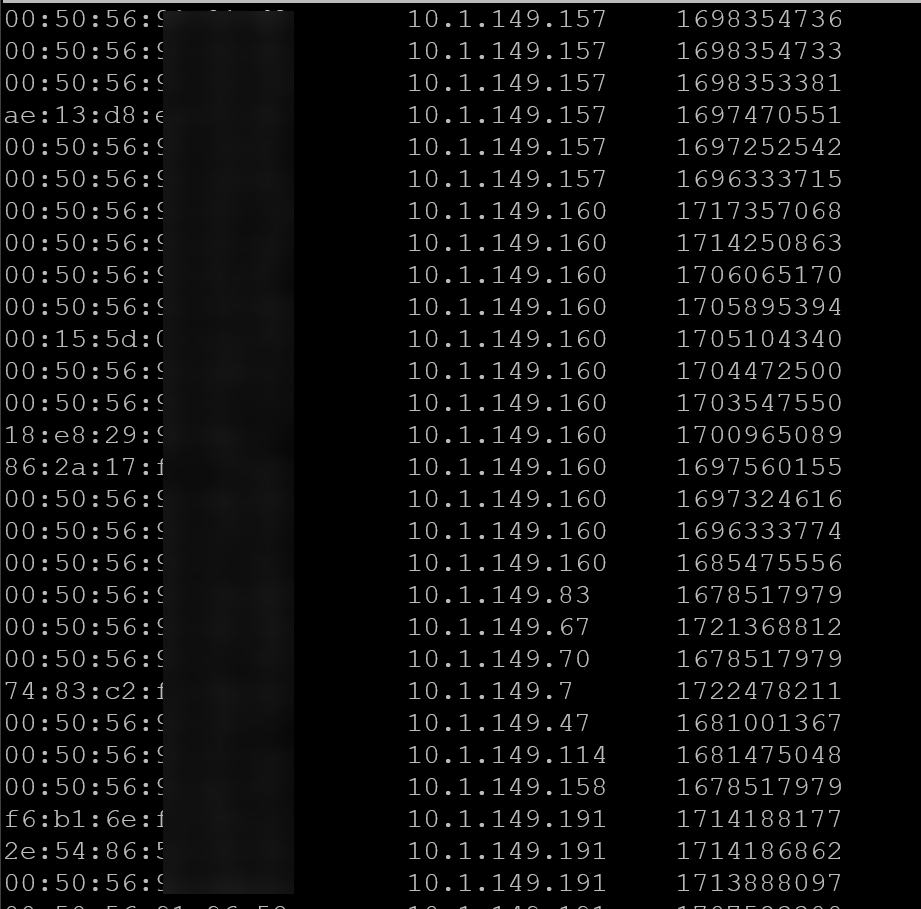
Below is an example of the simple table that is kept by Arpwatch.
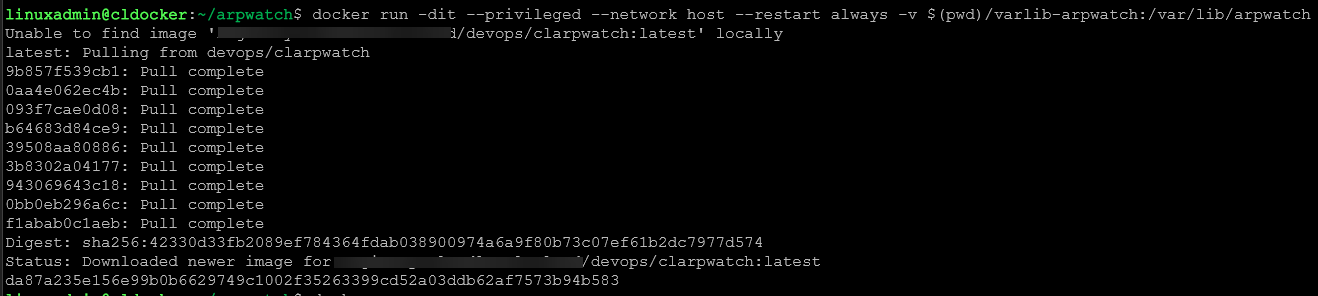
This is a solution that I have written about a lot and have shown also how you can build your own ARPwatch container and run this in Docker. You can see my posts on that here:
So you will get alerted the first time an ARP is observed on the network, but then you won’t receive alerts again unless the mapping changes. This is key as it will easily alert you to MAC address flapping that may be happening on your network.
Definitely check out ARPwatch and my guide on how to use it above and also start using it to monitor ARP changes in your network. It will give you a whole new appreciation of how much visibility it gives you.
2. Interface statistics (SNMP, RMON)
Wow, this is an amazing one to monitor – SNMP interface statistics using SNMP and RMON. If you have a newer managed switch, chances are you can monitor the interfaces using SNMP. Interface statistics are extremely valuable to show things like port utilization, packet loss, multicasts, collisions, etc. If a port is overloaded or saturated, it will likely show errors. This is a red flag for physical or configuration issues.
By monitoring the statistics on a regular basis, it should give you the ability to identify trends as well. If a port is usually running at 400 kb/sec all the time and then all of the sudden there are gigs and gigs of traffic on that port that stands out quite a bit.
The great thing is that a lot of the prosumer gear as well has the ability to monitor SNMP traffic. I have the Unifi USW-Enterprise-48 PoE switch and it has the ability to monitor using SNMP.
How to monitor interface statistics
- Enable SNMP on your switches and routers. Most Unifi, MikroTik, TP-Link, and enterprise-grade gear support SNMPv2 or SNMPv3.
- In something like Zabbix, you can add the network device and use the “Network interface discovery” rule to automatically track all interfaces for inbound and outbound throughput.
- For more advanced data, you can enable RMON (Remote Monitoring) on switches that support it. The ROMON data provides historical counters, things like utilization and errors, etc
- In Netdata, you can monitor interface statistics. These show up automatically once SNMP is configured.
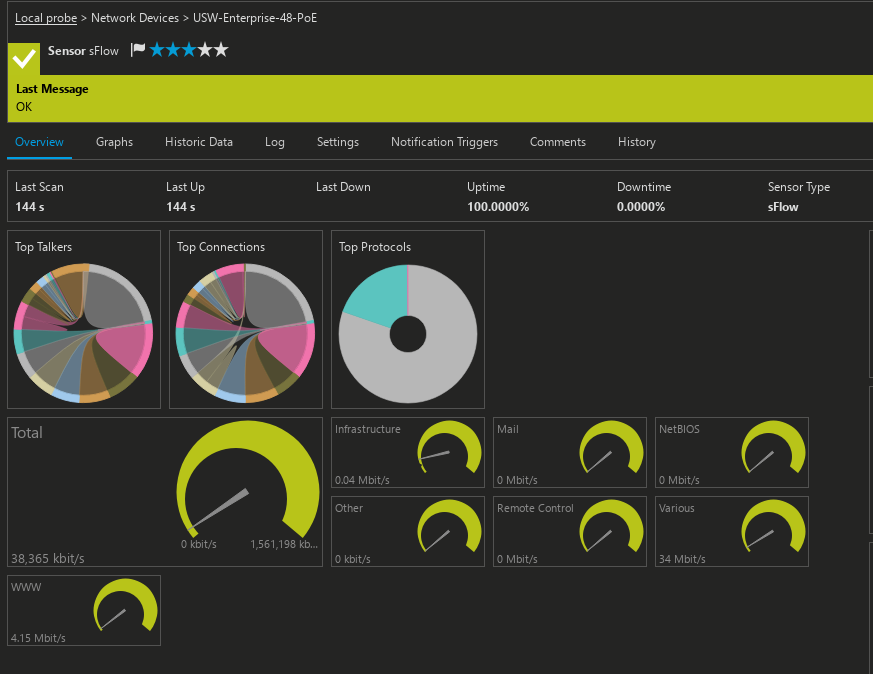
Below, I have the statistics piped into PRTG (which has a free 100 sensor install for home lab) as an SNMP RMON monitor. It asks you to select the ports you want to monitor and then it will bring in each one as a sensor. The neat thing is too it will bring in the port descriptions that you already have set in your Unifi environment.
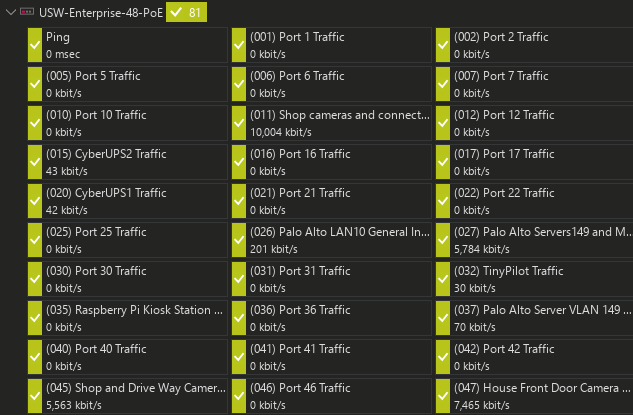
Also, in these kinds of monitoring solutions like PRTG and others, you can setup alerts that will trigger when your interface statistics go over a certain threshold that you define. This is great in that you can proactively trigger an alarm or alert notification for anomalies.
3. sFlow and traffic flow visibility
So after you have configured the interface statistics as we talked about above, these show you the amount of data that is being transmitted across the ports. However, sFlow or NetFlow actually shows what the data is exactly and what the source and destinations are. These flow monitoring protocols sample packets at a defined interval and then summarize these into records that you can see and graph in your netflow monitoring solution or something like Grafana.
Monitoring sFlow data will take your network monitoring to the next level, allowing you to see not only the traffic, but also the types of traffic happening on the network. If you see a flood of multicast or broadcast traffic, you likely have a broadcast storm or something else going on like a loop.
How to monitor with sFlow or NetFlow
Take a look at some suggested steps to enable sFlow or NetFlow on your switch or router and monitor. Keep in mind the steps will be specific to the vendor of your network gear, but generally you will do the following to get it enabled:
- Enable sFlow on your main switch or router
- Install a collector using something like ntopng, sFlowTrend, or even Zabbix with the flow-collector plugin
- Point your switch’s sFlow export to the collector’s IP address and configure the sampling rate
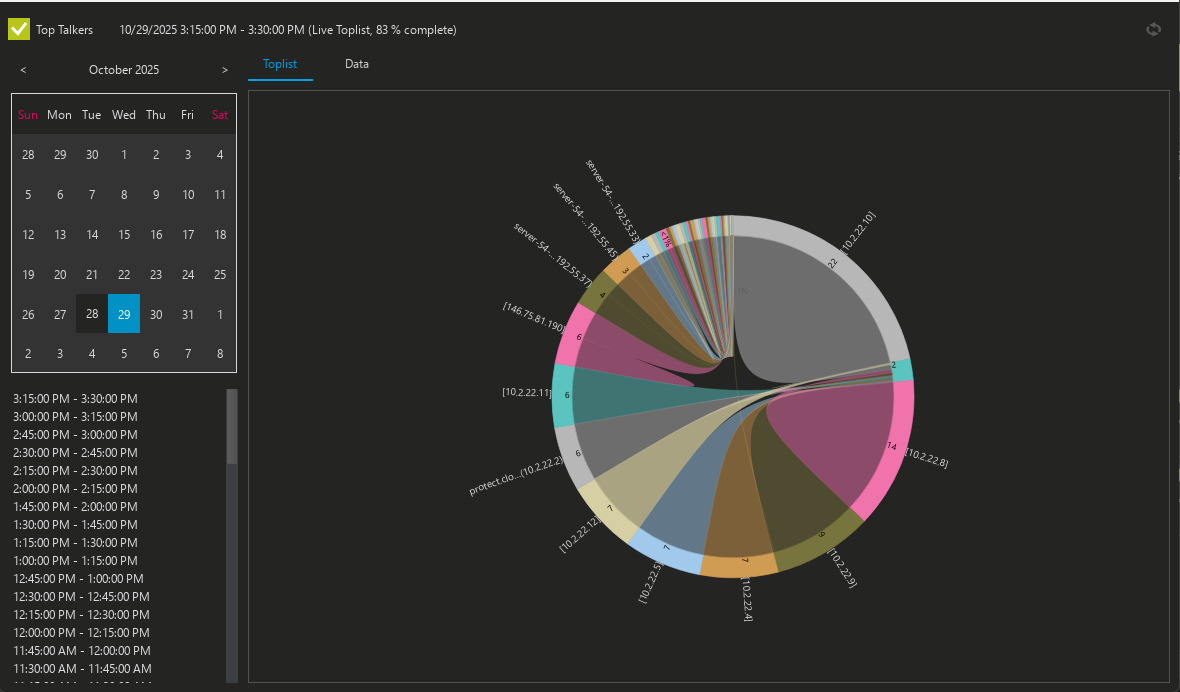
- You can then visualize the flow data to find “top talkers” common protocols, and unknown hosts
You can also run ntopng in Docker for a quick setup. This tool provides real-time flow dashboards, traffic ranking by host, and even alerts when a device starts using unexpected ports.
Like I showed above, you can also use something like PRTG as an sFlow collector.
4. DNS queries and performance
We only have to think back just a few days to the repercussions of what DNS issues can do with the major AWS outage that took a tier 1 cloud provider offline. DNS issues can also take your home lab network down for the same reasons. DNS is one of the first culprits when it comes networks acting up.
You can setup monitoring and tracking on DNS queries and response times. It gives you visibility into which devices are resolving what and whether your upstream DNS servers are doing what they are supposed to be doing and able to resolve hostnames into IP addresses.
How to monitor DNS queries
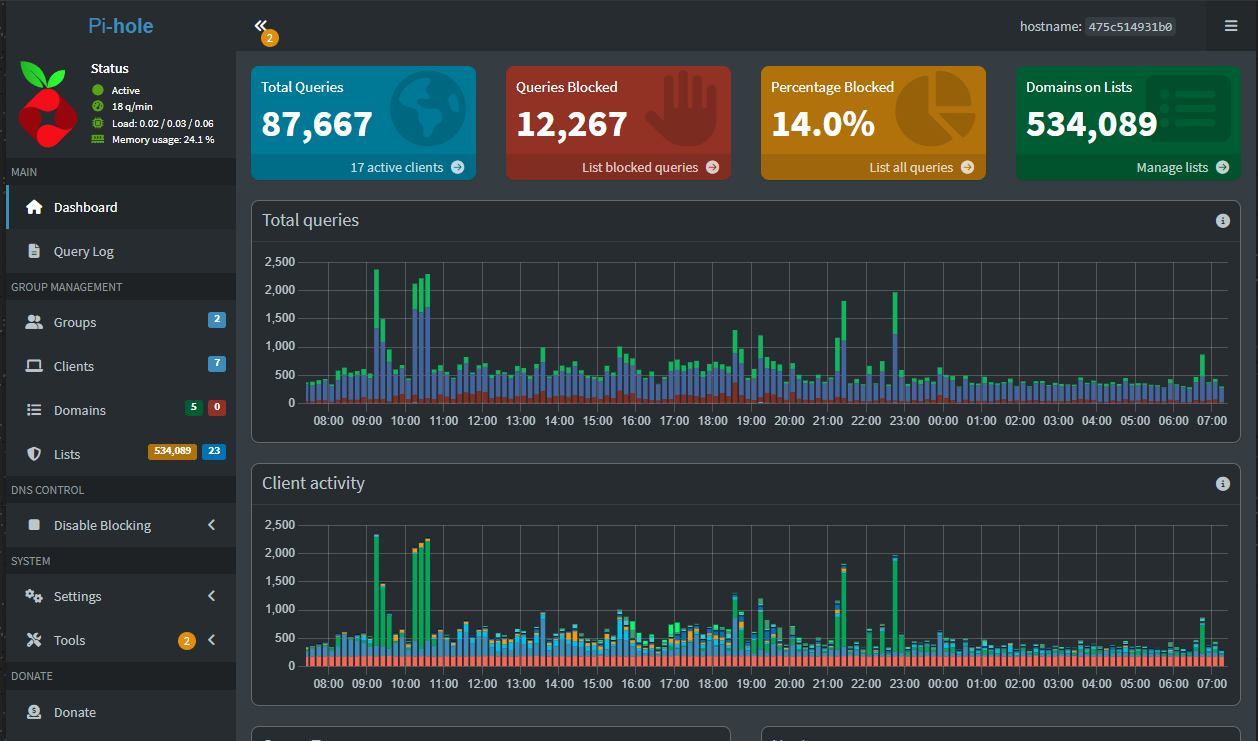
- You can use Pi-hole or AdGuard Home as your internal DNS resolver. Both of these can automatically log all DNS queries and show which devices are making requests and you can send this to a syslog server, etc
- You can also export query statistics from Pi-hole to Prometheus and visualize these queries in Grafana. You can see things like query rates, response times, and blocked requests.
- Enable DNS monitoring in Netdata to track query latency and failures.
- You can use the query monitor in Pi-Hole to show clients that repeatedly query external domains or fail to resolve domains properly.
5. Latency and packet loss
Even in a smaller home lab network, you can have packet loss or latency that causes issues. Or you may have a flaky ISP that always tells you they are not seeing any issues. You need to have real data to back up what you are seeing. Monitoring latency and packet loss is a key to be able to have the visibility that you need for network issues.
Packet loss itself can come from a wide range of things, from bad cables, interface problems (see our section on monitoring interfaces) and even faulty hardware. By keeping a history of your normal latency you can easily spot anomalies in packets and latency if these creep in.
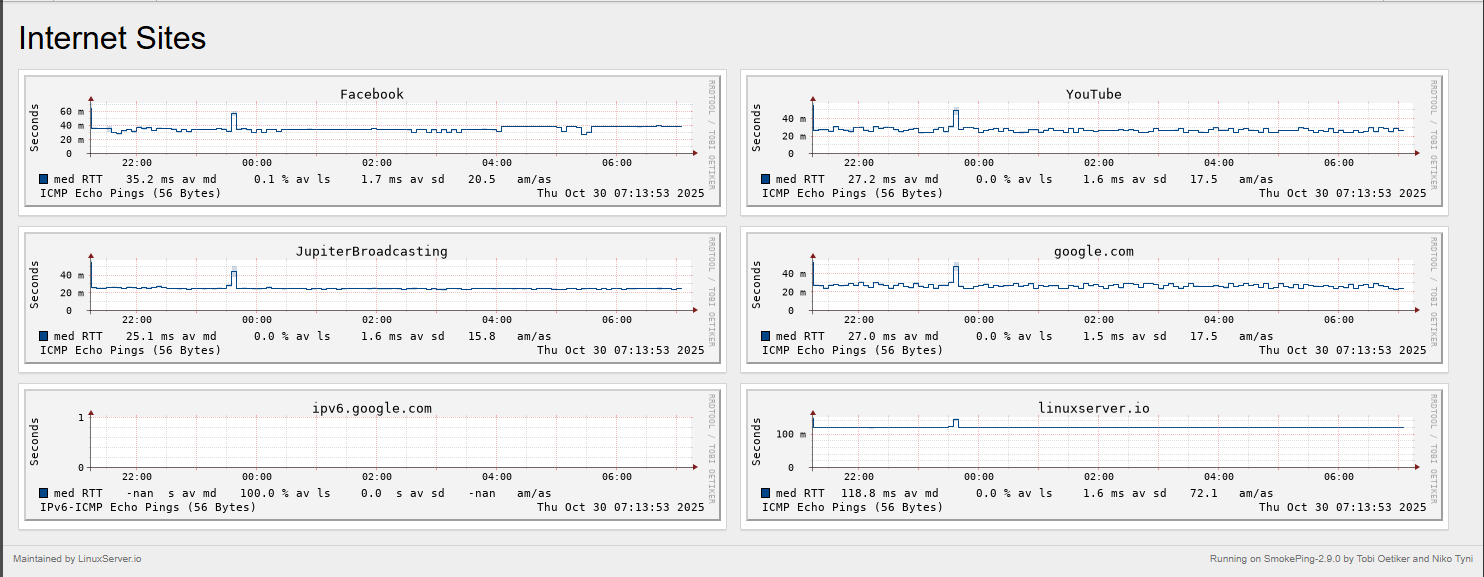
Below is a look at the output of Smokeping:
How to monitor latency and packet loss
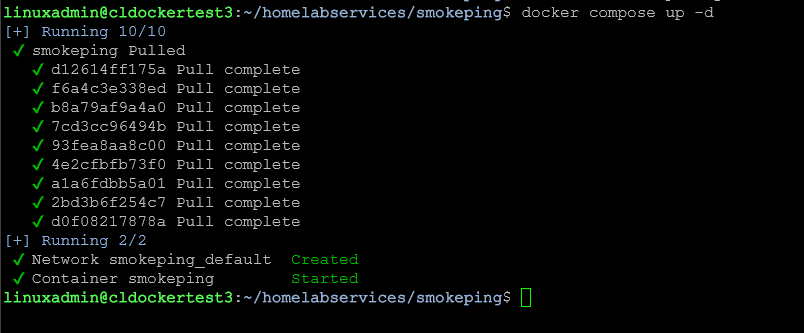
- One of my favorites that is quick and easy is called SmokePing that you can run on a small Linux or Docker host. It continuously pings targets and graphs latency over time. The good thing is that it has a wide range of Internet sites already configured. You can also use it in a master/slave type config where you can test between nodes
- In Zabbix, you can add an “ICMP ping” item to track response times and packet loss between your hosts
- Use Prometheus blackbox_exporter to have regular ping or HTTP checks between services.
- For quick one-off checks, you can also use Netdata’s built-in “Network Latency” chart
Building your home lab network monitoring stack
To have visibility and montoring on the aspects of the network that we have mentioned: ARP requests and MAC flapping, snmp interface monitoring, sFlow data, DNS queries, and packet latency monitoring, you need to have the right tools.
A basic combination of open-source tools can give you full visibility without a lot of effort. Just to recap some of the best solutions that we have mentioned throughout this post for network monitoring are the following:
- Zabbix for SNMP, ICMP, and ARP-related monitoring
- Netdata for live visualization and per-device metrics
- ntopng for sFlow or NetFlow
- Pi-hole for DNS analytics and filtering
- SmokePing or Prometheus blackbox_exporter for latency checks
Running these tools in Docker makes deployment simple and easy. Once you have them running, you can set up basic alerts for certain behavior like excessive interface errors, DNS failure spikes, or high latency.
Video
Wrapping up
Monitoring your home lab and home network in general is what turns it into a reliable place that you can test, experiment, and run “production” services. By having visibility on the metrics that we have gone over, it will greatly help with troubleshooting. But also, it will help you to learn about production networks and what affects performance and reliability. You will recognize normal patterns and then be able to quicly see when something is not quite right. Start small by enabling SNMP and sFlow on your switches and then add apps like Pi-Hole or SmokePing for higher-level visibility. Each layer of monitoring makes your home lab smarter and easier to troubleshoot. What about you? What tools are you using for monitoring? And, is there something I have missed in my list that you feel is super important to keep an eye on?
Google is updating how articles are shown. Don’t miss our leading home lab and tech content, written by humans, by setting Virtualization Howto as a preferred source.
About The Author


Loving ntopng, look for a new post on this one this coming week!