I feel like anymore there is an absolute smorgasbord of great automation tools that we have access to, especially now in the age of AI. So many great solutions. Recently, I covered n8n which is a tremendously powerful workflow automation tool. However, one that is a bit similar but I think more purpose built for DevOps is a tool called Kestra. If you haven’t heard about, do read this post as it will be a tool that I think many will be interested in not only for their home lab, but also production environments. Let’s see how to automate your home lab with Kestra.
What Is Kestra?
First of all, what is it? Kestra is an open-source workflow orchestration tool that is designed with a focus on DevOps in mind. An analogy that you can think of is like Airflow or Prefect but with a YAML approach and it is strongly integrated with container native environments. Also, it has a very healthy ecosystem of plugins out of the box.
Specifically for home lab automation, I think Kestra has a dream team of plugins and capabilities to connect various apps like the following:
- Terraform
- Ansible
- Proxmox, VMware, or libvirt APIs
- Docker & Kubernetes
- Git
- REST APIs, webhooks, cron triggers, etc
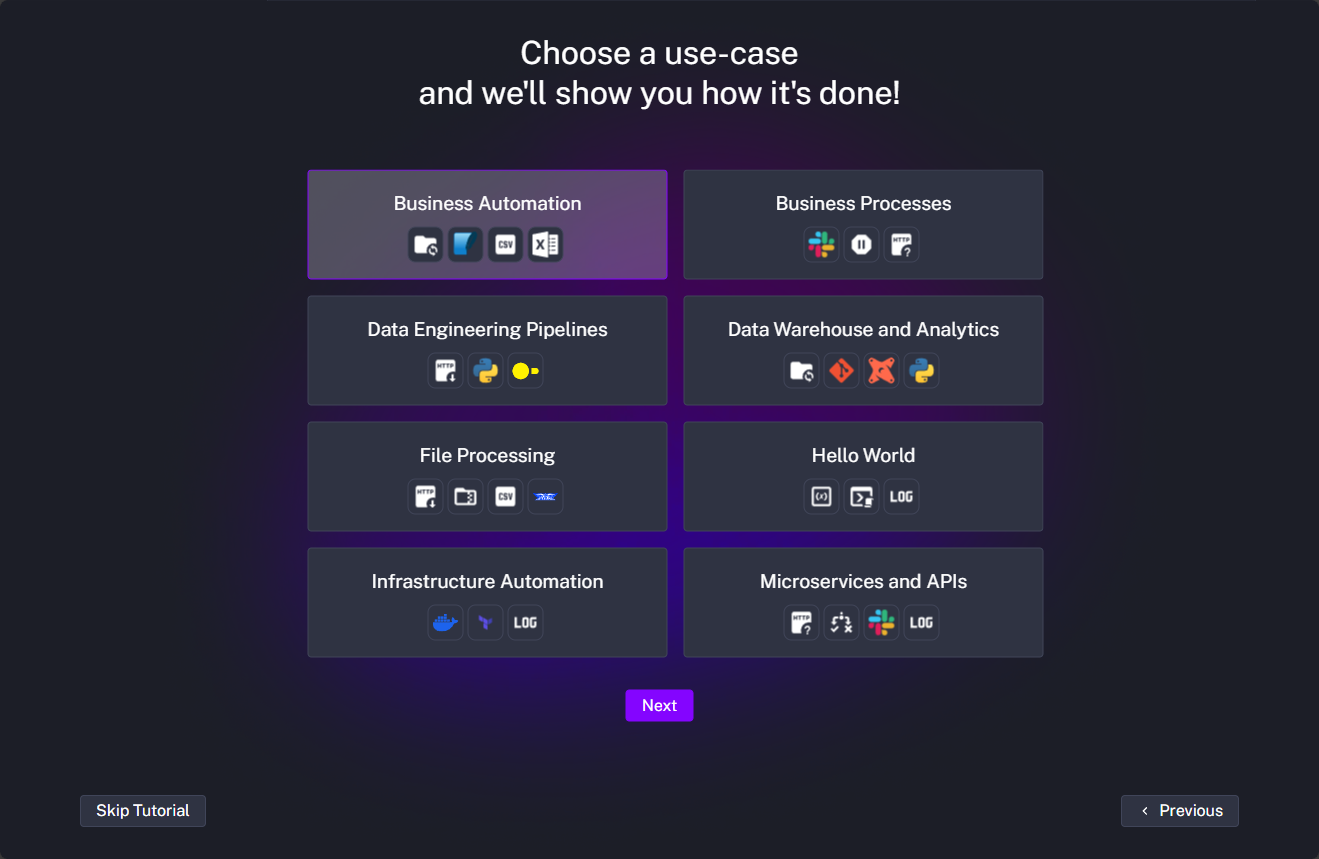
Below, you can see when you are first setting up Kestra, it helps you choose and build your first project based on use-case. You can choose:
- Business automation
- Business processes
- Data engineering pipelines
- Data warehouse and analytics
- File processing
- Infrastructure automation
- Hello world
- Microservices and APIs
Instead of writing a spaghetti mess of automation scripts or using many different tools to get the job done across technologies, you define your infrastructure workflows as YAML pipelines, triggered on a schedule. Or you can trigger things by an event (like a Git push or webhook). It runs in Docker or Kubernetes, and even has a slick web UI for managing everything, which I think is icing on the cake.
Do you really need this for the home lab?
You might be thinking: “Why do I need something like Kestra in my lab?” Well, in my opinion, it is absolutely GREAT for the home lab. Especially if you are into learning automation, DevOps or want to introduce automation in your environment in general and make things easier. And, it helps to solve real-world problems that we face. Think of the following that it can do:
- Replaces cron and shell scripting: Instead of writing bash scripts for each step, you can set these up declaratively.
- Build pipelines in a UI: Track every step in your infrastructure lifecycle from a UI.
- Integrates with your tools you already use: Automate Terraform, send Discord or Slack alerts, rebuild Docker containers, or pull data from GitHub.
- Handles failures: It has retry logic, parallel executions, timeouts, and logs that are all built-in
- Scales with your lab or production environment: Run one Kestra instance today, scale out with Kubernetes tomorrow.
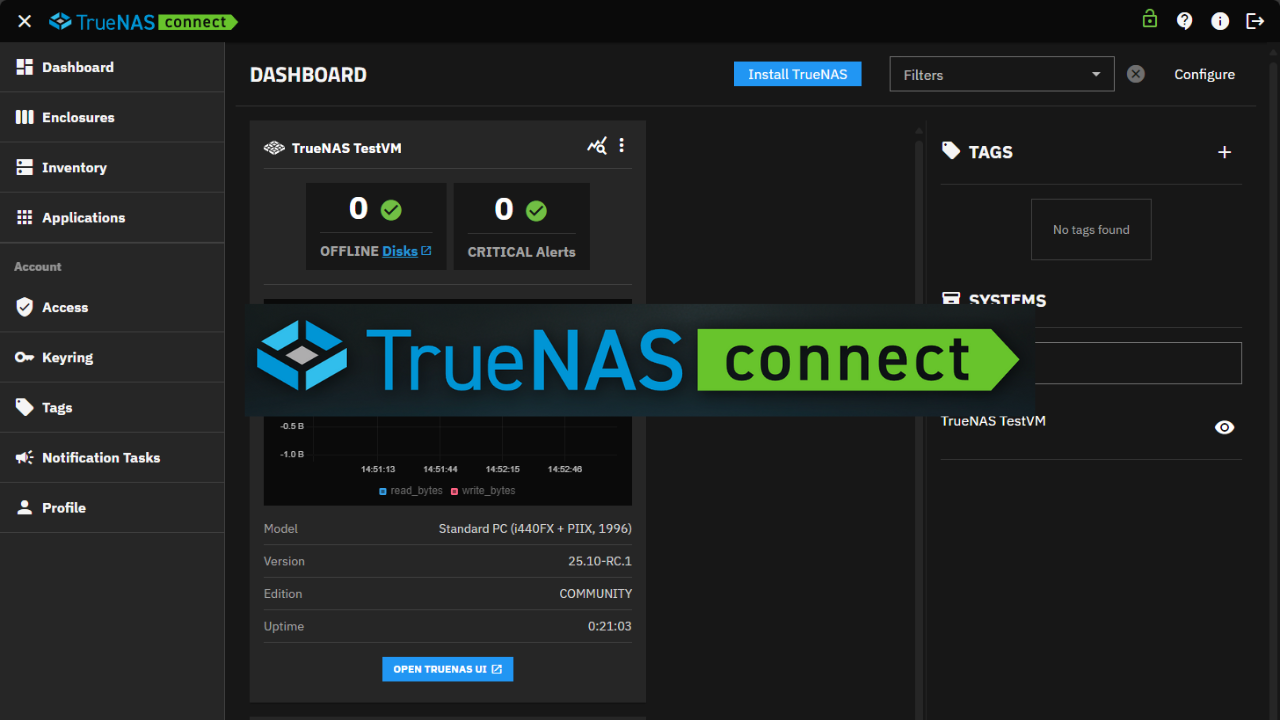
In my case, I found myself managing too many individual Ansible playbooks and cron jobs. Kestra helps me pull it all into one orchestrated pipeline, making automation more observable and reliable. Below is a look at the Kestra dashboard after installation.
Let’s see how you can install it using Docker Compose code.
Very cool aspects of Kestra
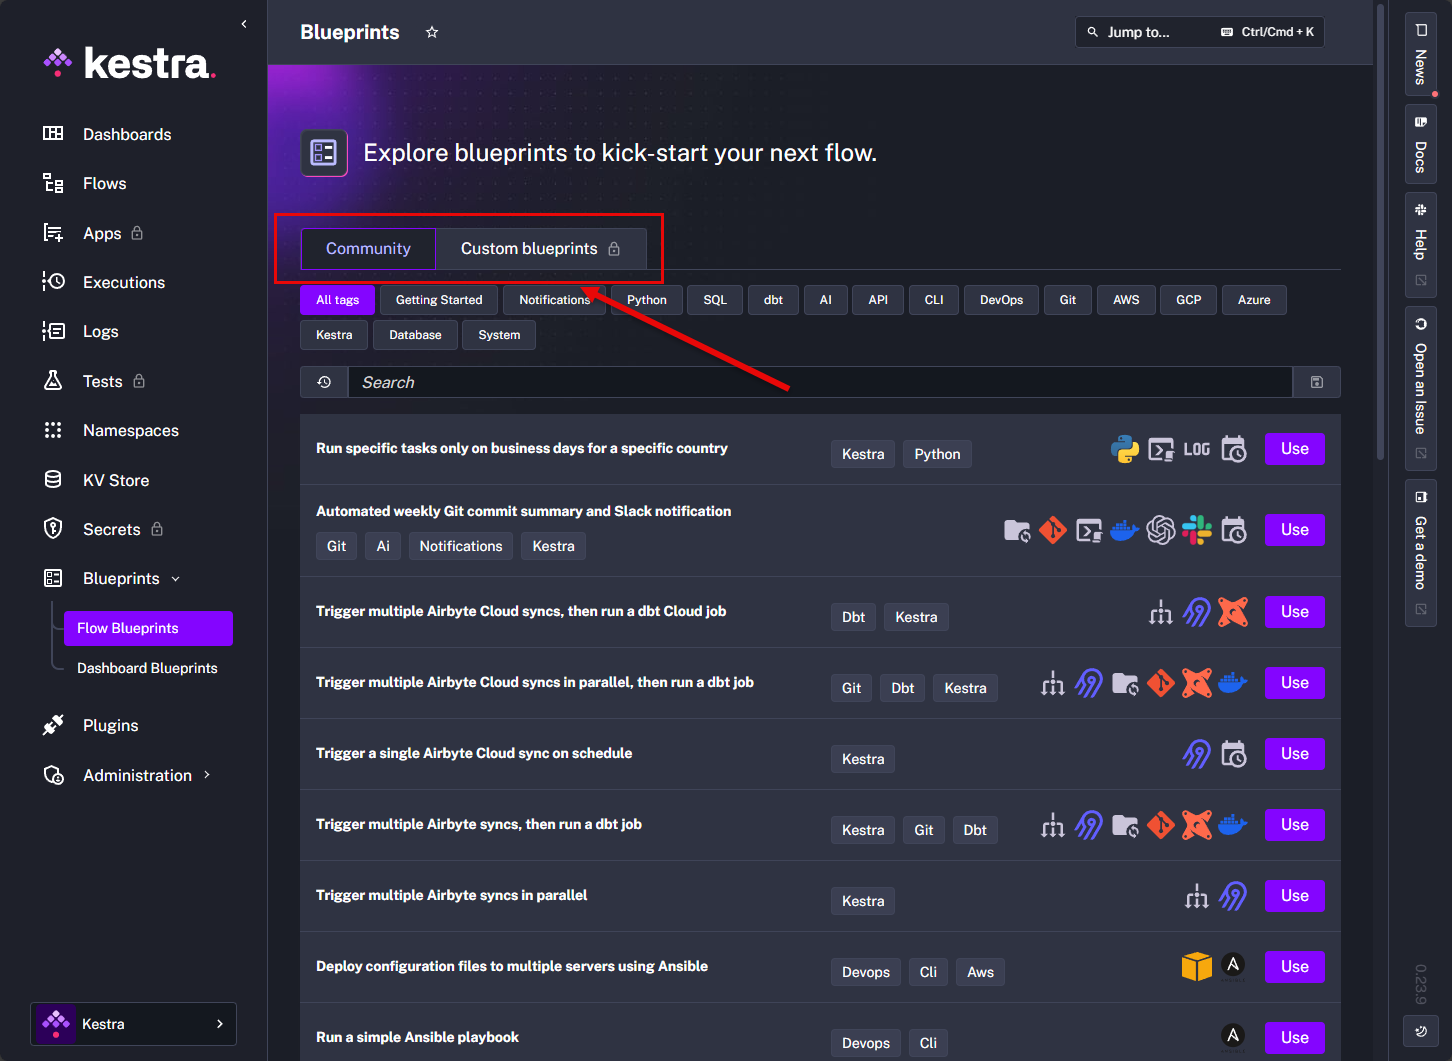
There are a couple of things that I really like about Kestra when it comes to making automation easier, and those are plugins, and Blueprints. Plugins are as they sound – extensions that allow you to integrate with popular services or other solutions via their available APIs.
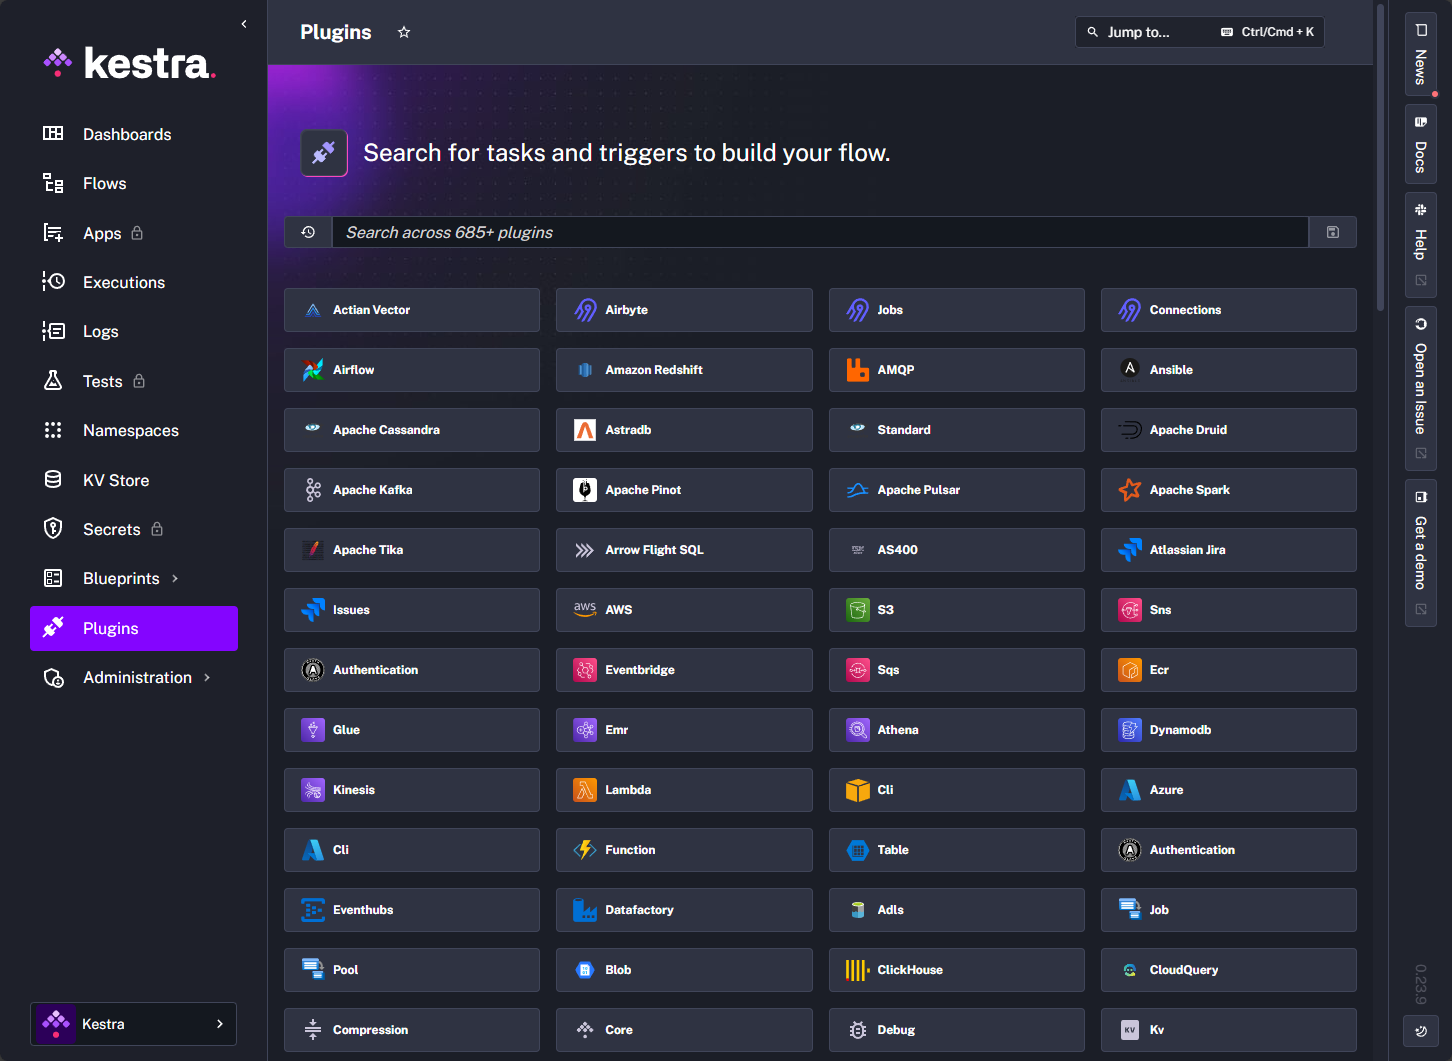
Blueprints take these plugins and combine them in a way that actually creates the workflow. There are hundreds of available community-built plugins available and there is also the concept of building your own custom blueprints.
How to install Kestra
You can easily install Kestra in Docker either with the docker run command or with Docker Compose which is my choice. Here is my exact Docker Compose file that I am using in the home lab (replace with values for your specific environment). You can create the docker-compose.yml file from this and use it either from the command line with docker compose or in something like Portainer.
version: '3.8'

services:
  kestra-postgres:
    image: postgres:15
    container_name: kestra-postgres
    restart: unless-stopped
    volumes:
      - /mnt/cephfs/kestra/postgres:/var/lib/postgresql/data
    environment:
      POSTGRES_DB: kestra
      POSTGRES_USER: kestra
      POSTGRES_PASSWORD: Str0ngP0stgr3sPassword!
    networks:
      - npm-stack_nginxproxy

  kestra:
    image: kestra/kestra:latest
    container_name: kestra
    user: "root"
    command: server standalone
    ports:
      - "8080:8080"
    volumes:
      - /mnt/cephfs/kestra/storage:/app/storage
      - /var/run/docker.sock:/var/run/docker.sock
      - /mnt/cephfs/kestra/wd:/tmp/kestra-wd
    environment:
      KESTRA_CONFIGURATION: |
        datasources:
          postgres:
            url: jdbc:postgresql://kestra-postgres:5432/kestra
            driverClassName: org.postgresql.Driver
            username: kestra
            password: Str0ngP0stgr3sPassword!
        kestra:
          repository:
            type: postgres
          storage:
            type: local
            local:
              basePath: "/app/storage"
          queue:
            type: postgres
          tasks:
            tmpDir:
              path: /tmp/kestra-wd/tmp
    networks:
      - npm-stack_nginxproxy
    depends_on:
      - kestra-postgres
    restart: unless-stopped

networks:
  npm-stack_nginxproxy:
    external: true
Real home lab automation scenarios that you can use Kestra for
Let’s dig into some actual examples that you can try or build from.
1. VM Provisioning via Terraform + Kestra
Scenario: Automatically provision a Proxmox or VMware VM using Terraform when a webhook is hit or a Git commit is made.
Workflow Overview:
- Trigger: Git push (via webhook)
- Tasks:
- Clone a Git repo with your Terraform files
- Run terraform init
- Run terraform apply
- Send a notification to Discord, email or some other platform
Kestra example YAML code:
id: terraform-vm-provision
namespace: homelab.automation

triggers:
  - type: webhook

tasks:
  - id: clone-repo
    type: io.kestra.plugin.git.Clone
    properties:
      url: "https://github.com/myhomelab/terraform-proxmox"
      branch: "main"
      directory: "./terraform"

  - id: terraform-init
    type: io.kestra.plugin.terraform.Init
    properties:
      path: "./terraform"

  - id: terraform-apply
    type: io.kestra.plugin.terraform.Apply
    properties:
      path: "./terraform"
      autoApprove: true

  - id: notify-discord
    type: io.kestra.plugin.notifications.discord.SendMessage
    properties:
      url: "{{ secrets.DISCORD_WEBHOOK }}"
      content: "VM provisioning complete via Terraform"
You could even add to this template of sorts to deploy PXE boot templates, snapshot VMs post-deploy, or trigger this from a GitOps pipeline.
2. Backup Containers Nightly with Kestra
Scenario: Run a backup script or docker export each night for critical containers like FreshRSS, GitLab, or Nextcloud.
Workflow Overview:
- Trigger: Cron expression (e.g.
0 3 * * *) - Tasks:
- Run a shell script that backs up volumes or containers
- Sync to remote SFTP or rclone storage
- Rotate old backups
Kestra example YAML code:
id: nightly-backup
namespace: homelab.backups

triggers:
  - type: schedule
    cron: "0 3 * * *"

tasks:
  - id: backup-script
    type: io.kestra.plugin.scripts.shell.Commands
    properties:
      commands:
        - bash /opt/scripts/docker-backup.sh

  - id: sync-backups
    type: io.kestra.plugin.scripts.shell.Commands
    properties:
      commands:
        - rclone sync /opt/backups remote:homelab-backups

  - id: rotate
    type: io.kestra.plugin.scripts.shell.Commands
    properties:
      commands:
        - find /opt/backups -mtime +7 -delete
Now you’ve got a self-healing, traceable, nightly backup pipeline—without relying on crontab.
3. Rebuild Containers When a Git Repo Changes
Scenario: Automatically rebuild and redeploy a Docker container when a GitHub repo is updated.
Workflow Overview:
- Trigger: Git webhook
- Tasks:
- Clone updated repo
- Build Docker image
- Push to local registry or deploy to Docker Swarm/K8s
Bonus: You can combine with Shepherd for automated updates and health checks.
4. Run Ansible Playbooks on a Schedule or Event
If you’re already using Ansible for config management, Kestra can trigger your playbooks with arguments and log every step.
Kestra example YAML code:
- id: run-ansible
  type: io.kestra.plugin.scripts.shell.Commands
  properties:
    commands:
      - ansible-playbook /opt/ansible/update-servers.yml
You could trigger this after a VM is provisioned or on a weekly cadence to enforce drift correction.
5. Kubernetes AI-powered incident monitoring, analysis, and alerting
One of the very cool built-in blueprints you will find for Kubernetes is one that provides Kubernetes AI-powered incident monitoring with alerting.
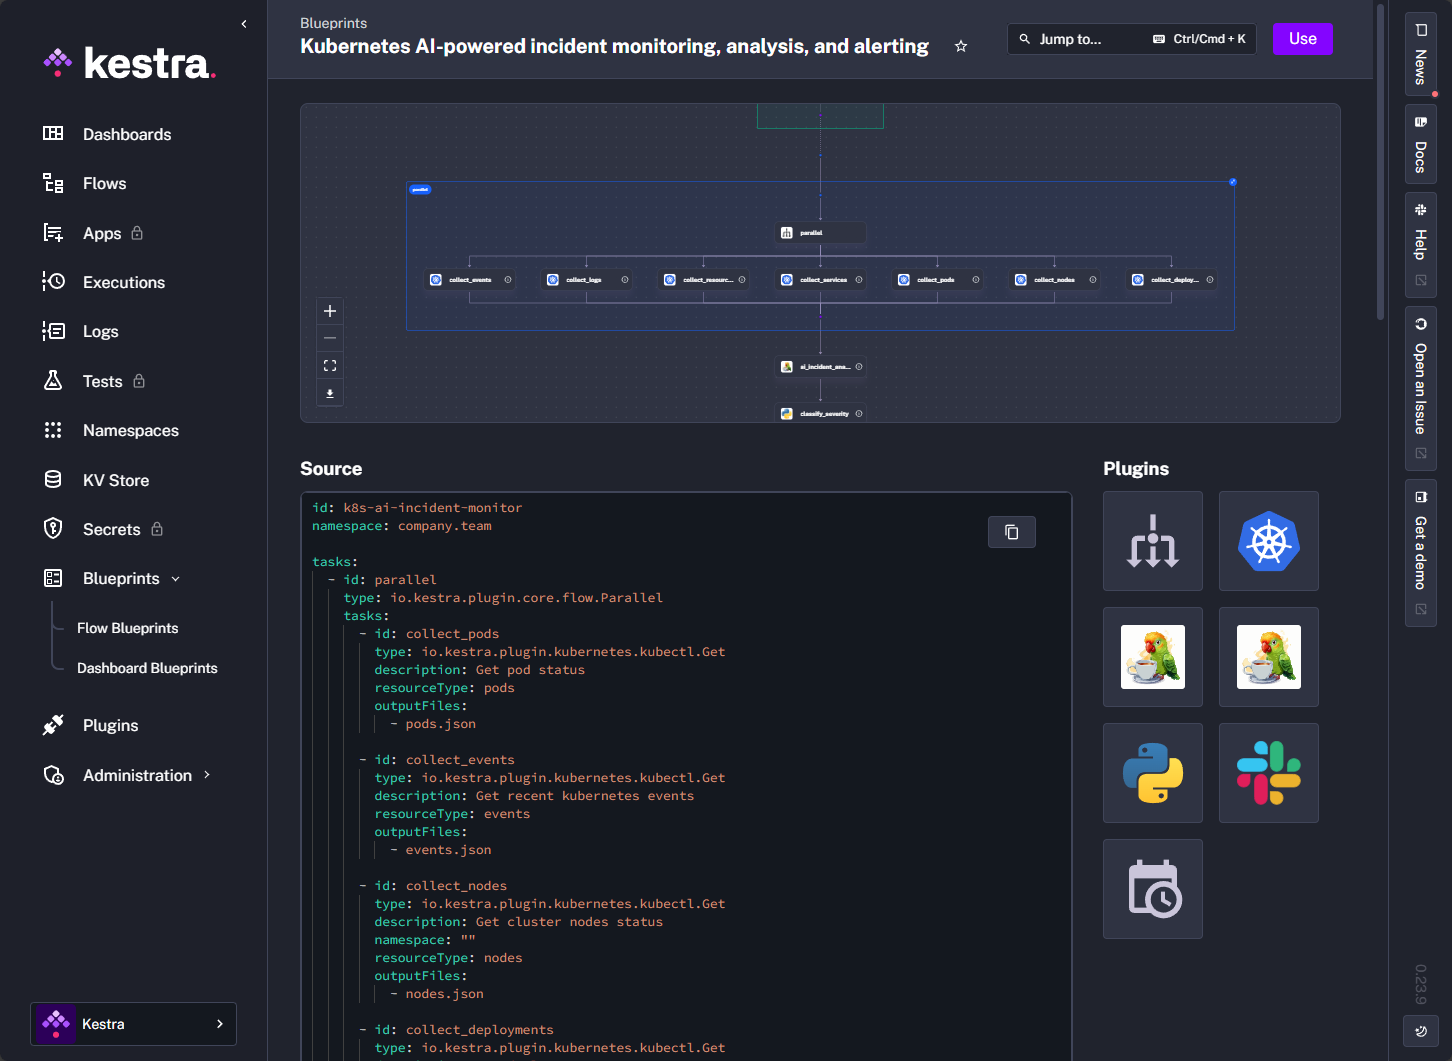
Kestra example YAML code:
id: k8s-ai-incident-monitor
namespace: company.team

tasks:
  - id: parallel
    type: io.kestra.plugin.core.flow.Parallel
    tasks:
      - id: collect_pods
        type: io.kestra.plugin.kubernetes.kubectl.Get
        description: Get pod status
        resourceType: pods
        outputFiles:
          - pods.json

      - id: collect_events
        type: io.kestra.plugin.kubernetes.kubectl.Get
        description: Get recent kubernetes events
        resourceType: events
        outputFiles:
          - events.json

      - id: collect_nodes
        type: io.kestra.plugin.kubernetes.kubectl.Get
        description: Get cluster nodes status
        namespace: ""
        resourceType: nodes
        outputFiles:
          - nodes.json

      - id: collect_deployments
        type: io.kestra.plugin.kubernetes.kubectl.Get
        description: Get deployments status
        resourceType: deployments
        outputFiles:
          - deployments.json

      - id: collect_services
        type: io.kestra.plugin.kubernetes.kubectl.Get
        description: Get services status
        resourceType: services
        outputFiles:
          - services.json

      - id: collect_resource_quotas
        type: io.kestra.plugin.kubernetes.kubectl.Get
        description: Monitor resource quotas and limits
        resourceType: resourcequotas
        outputFiles:
          - resource-quotas.json

      - id: collect_logs
        type: io.kestra.plugin.kubernetes.kubectl.Get
        description: Get pod logs for analysis
        namespace: kube-system
        resourceType: pods
        resourcesNames:
          - kube-apiserver-docker-desktop
        outputFiles:
          - kube-logs.json

  - id: ai_incident_analysis
    type: io.kestra.plugin.langchain4j.ChatCompletion
    description: AI-powered analysis of cluster incidents
    provider:
      type: io.kestra.plugin.langchain4j.provider.GoogleGemini
      apiKey: "{{secret('GOOGLE_API_KEY')}}"
      modelName: gemini-2.5-flash
    messages:
      - type: SYSTEM
        content: |
          You are a Kubernetes expert and site reliability engineer. You'll be given .ion format files uri .Download its content and Analyze the provided cluster data and provide:
          1. A concise summary of the current cluster health
          2. Root cause analysis for any issues found
          3. Impact assessment (severity, affected resources with names)
          4. Specific remediation steps with kubectl commands
          5. Preventive measures to avoid similar issues
          Do not use backticks, quotes, asterisks, or any Markdown formatting.
          Ensure all text is treated as plain text without any special characters or indentation.
          If mentioning code or error messages, format them as inline text with no special symbols.
          Don't use any quotes in your response and if you do,
          make sure to escape them with back-slashes e.g. \"Command failed with exit code 1\".
      - type: USER
        content: |
          Kubernetes Cluster Analysis Request:
          Pod Status: content from {{read(outputs.collect_pods.uri)}}
          Recent Events: Content from {{ read(outputs.collect_events.uri) }}
          Node Status: Content from {{ read(outputs.collect_nodes.uri) }}
          Deployment Status: Content from {{ read(outputs.collect_deployments.uri) }}
          Logs: Content from {{ read(outputs.collect_logs.uri) }}
          Please provide a comprehensive analysis and recommendations.

  - id: classify_severity
    type: io.kestra.plugin.scripts.python.Script
    description: Classify incident severity based on AI analysis
    script: |
      import json
      analysis = """{{ outputs.ai_incident_analysis.aiResponse }}"""
      # Extract severity indicators
      severity = "LOW"
      if any(keyword in analysis.lower() for keyword in ['critical', 'down', 'failed', 'error']):
          severity = "HIGH"
      elif any(keyword in analysis.lower() for keyword in ['warning', 'degraded', 'slow']):
          severity = "MEDIUM"
      print(json.dumps({"severity": severity, "analysis": analysis}))

  - id: send_slack_summary
    type: io.kestra.plugin.notifications.slack.SlackIncomingWebhook
    runIf: "{{ outputs.classify_severity.vars.severity == 'HIGH' }}"
    description: Send cluster health summary to Slack
    url: https://kestra.io/api/mock # replace with "{{secret('SLACK_WEBHOOK_URL')}}" for production
    payload: |
      {{
        {
          "text": "Cluster Alert with severity " ~ outputs.classify_severity.vars.severity ~ ". Full analysis - " ~ outputs.classify_severity.vars.analysis
        }
      }}

triggers:
  - id: schedule_monitor
    type: io.kestra.plugin.core.trigger.Schedule
    cron: "*/5 * * * *"

pluginDefaults:
  - type: io.kestra.plugin.kubernetes.kubectl.Get
    forced: false
    values:
      fetchType: STORE
      namespace: default

description: |
  Kubernetes AI-powered incident monitoring and alerting system.
  Monitors cluster health, analyzes issues with AI, and sends intelligent notifications.
Wrapping up
Kestra is one of those tools that you wish you had access to years ago and just makes so many things much easier. It is a great workflow orchestrator. I have found it to be one of the most flexible and intuitive tools that I am using for home lab automation and once it is up and running, it basically runs itself. What about you? Have you tried out Kestra as of yet? Let me know in the comments if you are already using it or something like n8n to automate various aspects of your home lab or production environments.
Google is updating how articles are shown. Don’t miss our leading home lab and tech content, written by humans, by setting Virtualization Howto as a preferred source.
About The Author