


Premium video
Monitoring Proxmox with Pulse
A look at a great free tool for monitoring your Proxmox installation in the home lab.
This video is included with Premium. The full description below is free to read.
About this video
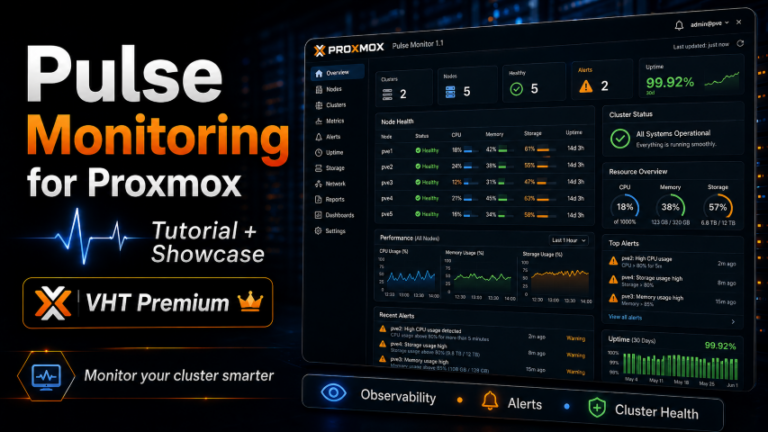
In this training video, I show how to deploy and configure Pulse. It is an open source monitoring solution that is built specifically for Proxmox VE and also monitoring Docker. We look at how Pulse connects directly to the Proxmox API, and how it provides real-time visibility into nodes, virtual machines, LXC containers, storage, and backups. Then we see how it can also bring Docker monitoring into the same dashboard
We begin by looking at what makes Pulse different from more general monitoring platforms. Because it is purpose-built for Proxmox, it is developed for the environment natively and can automatically surface metrics across Proxmox nodes and workloads without it needing any other external monitoring stack. I also cover features such as encrypted credentials, audit logging, alert history, adaptive thresholds, Proxmox Backup Server visibility, Proxmox Mail Gateway monitoring, and integrations with platforms such as Discord, Slack, Telegram, and Microsoft Teams.
From there, we walk through deploying Pulse using Docker. I show the basic Docker Compose configuration, the initial admin credentials and API token requirements, and how to access the Pulse web interface on its default port. Once the container is running, we add a Proxmox VE node using the generated one-line installation command and verify that metrics begin appearing almost immediately. We then explore the Pulse dashboard and look at node, VM, container, storage, and backup visibility. I also point out some current limitations, including the lack of deeper drill-down into individual virtual machines, while showing how the platform still provides a useful single-pane-of-glass view for a home lab or smaller Proxmox environment.
The video also covers Docker monitoring, including a few real-world configuration issues I encountered during setup. We troubleshoot the required .env file, API token configuration, Docker agent installation, and a manual agent deployment using the Pulse GitHub releases when the automated installation did not work as expected. Finally, we compare Pulse conceptually with built-in Proxmox graphs, Prometheus and Grafana, and Netdata. Pulse is especially cool when you want something lightweight, Proxmox-aware, and easier to deploy than a full observability stack using some of the other solutions out there. It still provides monitoring for Proxmox and Docker workloads in one interface.
By the end of the video, you will understand how to install Pulse, connect Proxmox VE and Docker hosts, configure monitoring and alerts, troubleshoot common setup issues. We see how to use the platform as a centralized monitoring dashboard for your home lab.
Unlock this video and the full member library with Premium — ad-free browsing included.