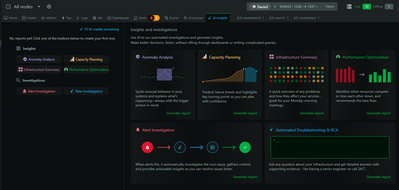
Just saw that Netdata dropped version 2.7.0 and wanted to share some of the highlights for anyone else running it in their lab.
The big headline is Netdata AI. They’re calling it your “co-SRE” for troubleshooting. You can ask it plain English questions about your infra like “why are my pods crashing in us-east-1” and it will spit out a report with timelines and possible causes. You also get automated investigations and alert root cause analysis. You also have the ability to schedule reports like weekly health checks. Everyone gets a handful (10) of free AI sessions to play with.
Another nice addition is chart annotations. You can now drop notes right on the charts to mark deployments, incidents, or whatever else you want to have tracked. Makes it way easier when you’re collaborating or just trying to remember what happened at a certain spike.
They also added a quick data export option. Any chart or table can be exported out to CSV, PNG, or PDF. Perfect if you want to share stuff outside of Netdata.
For folks running more complex setups, there’s now an OpenTelemetry plugin (alpha) that ingests metrics via OTLP gRPC and maps them to Netdata charts.
Couple of solid improvements too:
-
SNMP profiles are now stable and default with 15k entries for better device coverage
-
Nodes show up as node name/IP by default which is super handy
-
A bunch of stability fixes to squash crashes and memory issues
I already pulled the update in my lab and going to play around with the new AI features. Curious if anyone else here has kicked the tires on 2.7.0 yet? Let me know.
there are so many monitoring tools available. i keep netdata on some nodes to do real-time troubleshooting and monitoring, but i don't rely on it for anything historical. curious to see how well the "AI" feature works, or if the good stuff will be behind a paywall.


